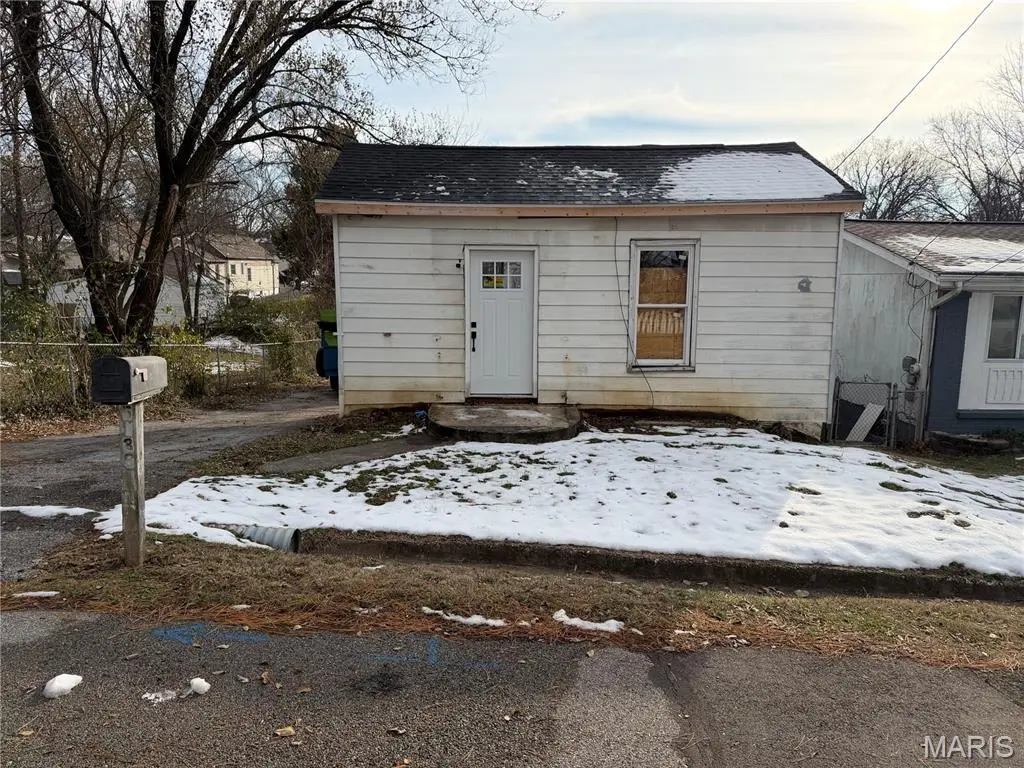
5138 Lode Ave · Affton, MO
Flood risk 6/10 · Moderate
- FEMA flood zone
- X (unshaded)
- Chance of flooding over 30 yrs
- 0.74%
- Est. flood insurance / yr
- $473 – $860
Fire risk 1/10 · Minimal
- Est. fire insurance / yr
- $1,054 – $1,958
Heat risk 5/10 · Moderate
- Hot days now (above 108°F)
- 7 days/yr
- Hot days in 30 yrs
- 21 days/yr
Wind risk 2/10 · Minimal
- Chance of severe wind over 30 yrs
- 1.0%
Air-quality risk 3/10 · Minor
- Unhealthy air days now
- 3 days/yr
- Unhealthy air days in 30 yrs
- 4 days/yr
Risk factors via First Street. Map © Google.
Why this score? — see what drove the B- grade
The composite is a weighted blend of 9 inputs, each scored 0–100. Each bar is that input's sub-score; the figure is the points it added to the 100-point composite (weight × sub-score).
- Cash flow +30.0/30.0
- 1% rule +10.0/10.0
- DSCR +10.0/10.0
- ARV discount +7.5/15.0
- Livability +3.6/5.0
- Rent growth +3.3/5.0
- Schools +3.0/10.0
- Condition / age +2.5/5.0
- Appreciation +0.0/10.0
$55,000
🖨 Deal sheet 📄 Offer letter ✓ Due diligence
Listing remarks MLS
Ranch home is Bayless school district with new roof, new framing, new doors, new windows, new water service, and set of Kitchen Cabinets included. Owner is a licensed Missouri Broker.
Key facts
- New framing
- New doors
- New water service
Tags
Neighborhood map
What this means for you Summary
Snapshot
- This is a 2-bed/1.0-bath single-family listed at $55k.
Deal economics
- At list price, monthly cash flow is $494 ($6k/yr) — positive.
- The deal already cash-flows at list — no discount required.
- Meets the 1% rule at list price ($1k rent vs $55k).
- Recommended offer: $48k (12.0% below list) — sets the bar for market timing.
- Cap rate 17.1% vs local median 3.9% in Affton — top-decile yield for the area; either an underpriced asset or a hidden risk that comps aren't pricing in. Stress-test before assuming the spread holds.
Location & tenants
- Location reads 71/100 on livability (#121 in MO) — a middle-class / working-renter tenant base. Strengths: cost of living A+, housing A+, employment B+; Watch: crime C-, amenities F, commute F.
- Bayless (suburban): math 28% / reading 42% proficiency, ranked #206 of 324 in MO (top 64%) — families likely to look elsewhere, expect single-tenant / working-renter base with shorter leases.
- Market conditions: Rents rising (+3.0%/yr); 186 active listings in the ZIP; solid renter incomes; 920 units permitted in St. Louis County in 2024 (250 in 5+ unit buildings).
- This rent is only 18% of the median local income ($77k/yr) — well below the 30% rent-burden line; pricing power to push rent on renewal without tenant pushback.
Forward outlook
- Local home prices are declining (-3.0%/yr); year-one equity from $380 of loan paydown is wiped out by about $2k of value loss. Plan a longer hold.
- At projected returns (-3.0% appreciation + 3.0% rent growth), your $15k cash investment doubles in ~4 years — after that, you're playing with house money.
Negotiation context
- It's been on market 194 days — a 12% lower offer ($48k) is reasonable based on typical stale-listing flexibility.
Risks & watch-outs
- Watch-outs: built in 1918 — expect roof / HVAC / electrical / plumbing capex.
- Climate carrying-cost: major flood risk; extreme-heat days projected 7→21/yr by 2055 (HVAC capex compounding) — expect insurance premiums to compound above CPI over the hold.
Questions for the listing agent
- It's been on market 194 days. Have you received any prior offers? Is the seller open to a 12% concession, seller financing, or rate buy-down credit?
- Built in 1918 — when were the roof, HVAC, electrical panel, plumbing, and water heater last replaced?
- Why hasn't it sold? Are there any deal-killer items the seller is aware of (foundation, flood, title, zoning, code violations)?
- Is there a deadline driving the sale (1031 exchange, divorce, estate, relocation)? That informs how much negotiation room exists.
- What's the average days-on-market for RENTAL listings here right now (not sales)? A rising rental-DOM trend means longer vacancies and softer asking-rent achievability than the comps imply.
- What's the recent tenant-quality profile in this submarket — average credit score on applications, eviction rate, late-payment / NSF rate, and stable-employment percentage? A property-management company in the area should have these aggregated.
- How much new for-sale + rental construction is in the pipeline within 1–3 miles? Heavy new supply typically softens prices + rents 12–24 months out; constrained supply supports both.
Investment metrics
- 1% rule
- 2.09% ✓
- Cap rate
- 17.07%
- Cash-on-cash
- 38.50%
- DSCR
- 2.71
- GRM
- 4.0
CMA / ARV
- ARV (median comp)
- $120,807
- List price
- $55,000
- Delta
- -54.47%
- Verdict
- UNDERPRICED
- Comps
- 7 within 1.0 mi
Show comp detail 1 sale within ~0.75 mi
| Address | Dist | Beds/Ba | Sqft | Sold | Price | $/sf | Match |
|---|---|---|---|---|---|---|---|
| 4956 Tiemann Ave | 0.46mi | 1/1.0 (-1) | 546 (+15%) | 4mo | $30,000 | $55 | 45 |
Match score weights: distance 35% · size 25% · config 20% · recency 20%. Top-matched comps best support the ARV.
Projected returns pro-forma
-3.0% appreciation · 3.01% rent growth · sell at horizon
- IRR
- 34.7%
- Equity multiple
- 2.47×
- Total profit
- $22,601
- Equity at exit
- $8,201
- IRR
- 41.5%
- Equity multiple
- 4.92×
- Total profit
- $60,394
- Equity at exit
- $4,755
Cash invested: $15,400 (down + closing). Projections, not guarantees.
Landlord ↔ Tenant lean methodology
- Overall (STATE)
- 81 Strongly Landlord-Friendly
- State Missouri
- 81 Strongly Landlord-Friendly · R+10
- County
- — inherits STATE
- City
- — inherits STATE
ZIP-level market 63123
- Rents YoY
- 3.0%
- Active inventory
- 186
- Price-to-rent
- 4.0×
Monthly cashflow live
- Estimated rent
- $1,147 medium interval (Pro) →
- Mortgage (P&I)
- −$288
- Tax from tax record
- −$101 /mo · $1,210/yr
- Insurance
- −$23
- HOA
- −$0
- Vacancy / Maint / Mgmt
- −$241
- Net cashflow
- $494
Break-even live
UW: 25.0% down · 7.5% · 30yr · 1.5% tax · 5.0% vac · 8.0% maint · 8.0% mgmt
Financing live
Cash to close
- Down payment
- $13,750
- Closing costs
- $1,650
- Reserves months
- —
- Total cash needed
- —
Loan-product check · same deal, 3 products live
Conventional
25% down · 7.5% · 30yr
- Down + closing
- —
- Monthly P&I
- —
- Monthly cashflow
- —
- DSCR
- —
- Eligible?
- —
Personal DTI + credit; lowest rate.
DSCR
20% down · 8.5% · 30yr
- Down + closing
- —
- Monthly P&I
- —
- Monthly cashflow
- —
- DSCR
- —
- Eligible?
- —
No personal income docs; deal must DSCR.
Hard money
10% down · 12.0% · 12mo
- Down + closing
- —
- Monthly P&I
- —
- Monthly cashflow
- —
- DSCR
- —
- Eligible?
- —
Short-term bridge; refi at stabilization.
Listing history 25 events
-
2026-06-18days on market $55,000 Active 194 DOM
-
2026-06-17days on market $55,000 Active 193 DOM
-
2026-06-16days on market $55,000 Active 192 DOM
-
2026-06-15days on market $55,000 Active 191 DOM
-
2026-06-13days on market $55,000 Active 189 DOM
-
2026-06-09days on market $55,000 Active 185 DOM
-
2026-06-08days on market $55,000 Active 184 DOM
-
2026-06-07days on market $55,000 Active 183 DOM
-
2026-06-03days on market $55,000 Active 179 DOM
-
2026-06-02days on market $55,000 Active 178 DOM
-
2026-06-01days on market $55,000 Active 177 DOM
-
2026-05-31days on market $55,000 Active 176 DOM
-
2026-04-13price $57,500 183-char remark
Show marketing remark (183 chars)
Ranch home is Bayless school district with new roof, new framing, new doors, new windows, new water service, and set of Kitchen Cabinets included. Owner is a licensed Missouri Broker.
-
2026-04-02price $59,900 183-char remark
Show marketing remark (183 chars)
Ranch home is Bayless school district with new roof, new framing, new doors, new windows, new water service, and set of Kitchen Cabinets included. Owner is a licensed Missouri Broker.
-
2026-03-09price $65,000 183-char remark
Show marketing remark (183 chars)
Ranch home is Bayless school district with new roof, new framing, new doors, new windows, new water service, and set of Kitchen Cabinets included. Owner is a licensed Missouri Broker.
-
2026-02-26price $68,500 183-char remark
Show marketing remark (183 chars)
Ranch home is Bayless school district with new roof, new framing, new doors, new windows, new water service, and set of Kitchen Cabinets included. Owner is a licensed Missouri Broker.
-
2026-02-23price $72,500 183-char remark
Show marketing remark (183 chars)
Ranch home is Bayless school district with new roof, new framing, new doors, new windows, new water service, and set of Kitchen Cabinets included. Owner is a licensed Missouri Broker.
-
2026-02-12price $75,000 183-char remark
Show marketing remark (183 chars)
Ranch home is Bayless school district with new roof, new framing, new doors, new windows, new water service, and set of Kitchen Cabinets included. Owner is a licensed Missouri Broker.
-
2026-01-18price $78,500 183-char remark
Show marketing remark (183 chars)
Ranch home is Bayless school district with new roof, new framing, new doors, new windows, new water service, and set of Kitchen Cabinets included. Owner is a licensed Missouri Broker.
-
2025-12-06$82,500 Active 183-char remark
Show marketing remark (183 chars)
Ranch home is Bayless school district with new roof, new framing, new doors, new windows, new water service, and set of Kitchen Cabinets included. Owner is a licensed Missouri Broker.
-
2002-09-19soldstatus
-
1995-02-01soldstatus
-
1994-09-19soldstatus
-
1994-09-19soldstatus
-
1994-09-01soldstatus
ⓘ Source: listings_history table (triggers on properties + properties_extension) + one-shot
backfill from property_details.listing_events for pre-trigger history.
Tax reassessment forecast MO · Resets to sale price
- Current annual tax
- $1,210 · $101/mo
- Projected year-2 tax
- $1,210 · $101/mo
- Expected delta
- $0/yr ($0/mo · 0.0%)
ⓘ Screening estimate from a state-policy table — verify with the county assessor before closing.
Climate risk First Street
- Flood 6/10 Major FEMA zone X (unshaded) · 74% chance over 30 yrs
- Wildfire 1/10 Low
- Heat 5/10 Major 7 d/yr ≥108°F today · 21 d/yr by 30 yrs out
- Wind 2/10 Low 100% chance of damaging wind over 30 yrs
- Air quality 3/10 Moderate 3 unhealthy d/yr today · 4 by 30 yrs out
Nearby sold comps map
Loading sold comps map…
Walkable amenities ~0.75 mi
Loading nearby amenities…
Taxation est. · year 1
- Rental income
- $13,765
- − Mortgage interest
- −$3,081
- − Property taxes
- −$1,210
- − Insurance
- −$275
- − Repairs & maintenance
- −$1,101
- − Management
- −$1,101
- − Depreciation
- −$1,600
- Taxable income
- $5,397
- Est. tax owed @ 24.0%
- −$1,295
- After-tax cash flow
- $4,633/yr
For passive investors: Depreciation is non-cash, so a rental often shows a tax loss while cash-flowing — sheltering income. Rental losses are passive: they offset passive income freely, and up to $25,000/yr can offset ordinary (W-2) income if you actively participate and your MAGI is under $100k (phasing out to $0 by $150k); unused losses carry forward. On sale, claimed depreciation is recaptured at up to 25%, and gains may owe capital-gains tax (a 1031 exchange can defer both). Figures are a year-1 estimate at your 24.0% rate — not tax advice; consult a CPA.
Schools (NCES district)
- District
- Bayless
- NCES district ID
- 2904500
- Math proficiency
- 28% ▼ -15.00%
- Reading proficiency
- 42% ▼ -8.00%
- Median HH income
- $49,378
- Composite
- 30.24/100
- National rank
- #6293
- State rank
- #206 of 324 in MO
Livability — Affton
- Score
- 71/100
- State rank
- #121
- US rank
- #7312
Category grades
Schools grade is shown separately in the Schools card above.
Census & demographics
- Census place
- Affton, MO
- County
- Saint Louis County · 888,823 people
- City population
- 49,077
- Metro
- St. Louis, MO-IL
- Population (ZIP)
- 49,077
- Household income
- $77,055
- Rent vs Own
- Severe rent burden
- 753.0
Population outlook (St. Louis County) Hauer SSP2
- Today (2025)
- 1,025,227 people
- By 2030
- 1,028,023 · +0.3%
- By 2040
- 1,020,940 · -0.4%
- By 2050
- 1,007,280 · -1.8%
- By 2075
- 987,277 · -3.7%
- By 2100
- 921,984 · -10.1%
Race, ethnicity, and origin ACS 2023
- Neighborhood character
- Predominantly White (82%)
- Race & ethnicity
- White 82% Two or more races 7% Asian 5% Hispanic / Latino 5% Black 3%
- Common ancestry
- American 5% Lithuanian 3% Romanian 2%
- Foreign-born
- 13% · Vietnam, Canada
- Languages at home
- 83% English-only · Russian/Polish/Slavic 6% Spanish 3% Other Indo-European 3%
Political lean MEDSL · St. Louis
- 2024 margin
- Strong D (+23.4) · D 60.8% · R 37.4% · Other 1.7%
- 2008→2024 swing
- +3.5pp toward D · 2008: 19.9pp · 2024: 23.4pp
- All cycles
- 2024: D+23.4 2020: D+24.0 2016: D+16.2 2012: D+13.7 2008: D+19.9
Not yet ingested
- Civics
- —
Market trends
- HPI YoY
- ▼ -229.90%
- Current HPI
- 220.258
- Rent YoY
- ▲ 3.01%
- Metro
- St. Louis, MO-IL
- State GDP YoY
- ▲ 1.84%
- F500 in state
- 20
Industry mix (Fortune 500 HQ in MO)
| Industry | F500 HQs | Revenue |
|---|---|---|
| Healthcare | 1 | $163B |
|
||
| Insurance | 1 | $21B |
|
||
| Industrial Technology | 1 | $17B |
|
||
| Retail | 1 | $16B |
|
||
| Industrial Distribution | 1 | $10B |
|
||
| Utilities | 1 | $9B |
|
||
Price history
-30.3% since first listed13 events — show timeline
- 2026-04-13 Price Changed $57,500 MARIS as Distributed by MLS Grid
- 2026-04-02 Price Changed $59,900 MARIS as Distributed by MLS Grid
- 2026-03-09 Price Changed $65,000 MARIS as Distributed by MLS Grid
- 2026-02-26 Price Changed $68,500 MARIS as Distributed by MLS Grid
- 2026-02-23 Price Changed $72,500 MARIS as Distributed by MLS Grid
- 2026-02-12 Price Changed $75,000 MARIS as Distributed by MLS Grid
- 2026-01-18 Price Changed $78,500 MARIS as Distributed by MLS Grid
- 2025-12-06 Listed $82,500 MARIS as Distributed by MLS Grid
- 2002-09-19 Sold (Public Records) — Public Records
- 1995-02-01 Sold (Public Records) — Public Records
- 1994-09-19 Sold (Public Records) — Public Records
- 1994-09-19 Sold (Public Records) — Public Records
- 1994-09-01 Sold (Public Records) — Public Records
Property tax history
+2.0%/yrLatest (2022): $1,210 · +2.6% YoY. Source: county tax records.
Cash-flow waterfall
monthlySold comps — $/sqft
last 12 mo · ≤1 miLoading sold comps…