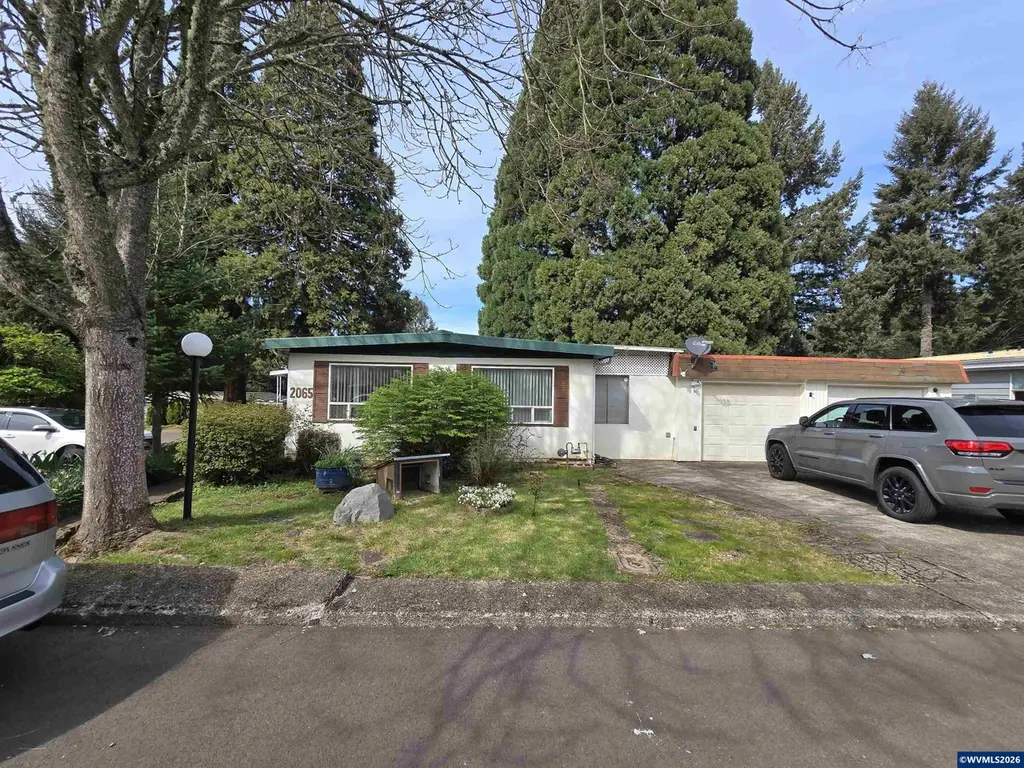
2065 National Ct SE · Salem, OR
Flood risk 1/10 · Minimal
- FEMA flood zone
- X (unshaded)
- Chance of flooding over 30 yrs
- 0.0%
- Est. flood insurance / yr
- $507 – $1,088
Fire risk 4/10 · Minor
- Est. fire insurance / yr
- $498 – $926
Heat risk 3/10 · Minor
- Hot days now (above 91°F)
- 7 days/yr
- Hot days in 30 yrs
- 14 days/yr
Wind risk 1/10 · Minimal
- Chance of severe wind over 30 yrs
- —
Air-quality risk 9/10 · Severe
- Unhealthy air days now
- 12 days/yr
- Unhealthy air days in 30 yrs
- 13 days/yr
Risk factors via First Street. Map © Google.
Why this score? — see what drove the C- grade
The composite is a weighted blend of 9 inputs, each scored 0–100. Each bar is that input's sub-score; the figure is the points it added to the 100-point composite (weight × sub-score).
- Cash flow +19.9/30.0
- ARV discount +7.5/15.0
- DSCR +6.3/10.0
- 1% rule +4.8/10.0
- Livability +4.0/5.0
- Schools +3.7/10.0
- Rent growth +2.9/5.0
- Condition / age +2.5/5.0
- Appreciation +0.0/10.0
$175,000
🖨 Deal sheet 📄 Offer letter ✓ Due diligence
Listing remarks
Discover the potential in this 2-bed, 2-bath manufactured home set on its own private lot and surrounded by mature trees. This property offers a peaceful setting with plenty of room to make it your own. Inside, the home features a functional layout with comfortable living spaces and two full bathrooms, providing flexibility for everyday living.
Key facts
- Private lot
- Attached workshop
- Single-car garage
Tags
Property features AI
Finance
- Other: Private lot surrounded by mature trees
- HOA & community: No homeowners association
Exterior
- Parking: Attached garage with one garage space; Attached workshop
- Utilities: City water; Electric water heater
- Home design: Single-story home; Manufactured home
- Construction: Board & batt siding; Pier foundation; Metal or aluminum roof; Built in 1971
- Exterior features: Partially fenced yard; Covered deck; Covered patio; Hot tub; Underground sprinkler system; Landscaped yard
Interior
- Kitchen: Dishwasher; Electric range
- Bedrooms: Master bedroom on the main level
- Flooring: Carpet
- Bathrooms: Two full bathrooms
- Heating & cooling: Gas heating; Heat pump
- Interior features: Carpet flooring; High-speed internet available; Disposal
- Laundry & utility: Electric water heater
Neighborhood map
What this means for you Summary
Snapshot
- This is a 2-bed/2.0-bath single-family listed at $175k.
Deal economics
- At list price, monthly cash flow is $211 ($3k/yr) — positive.
- The deal already cash-flows at list — no discount required.
- To meet the 1% rule (rent ≥ 1% of price), the offer needs to be $171k (2.5% below list).
- Recommended offer: $171k (2.5% below list) — sets the bar for 1% rule.
- Cap rate 7.7% vs local median 2.9% in Salem — top-decile yield for the area; either an underpriced asset or a hidden risk that comps aren't pricing in. Stress-test before assuming the spread holds.
Location & tenants
- Location reads 79/100 on livability (#59 in OR, #2,084 nationally) — a middle-class / working-renter tenant base. Strengths: amenities A+, commute A+, housing A+; Watch: schools D, crime F.
- Salem-Keizer SD 24J (urban): math 34% / reading 47% proficiency, ranked #103 of 183 in OR (top 56%) — families likely to look elsewhere, expect single-tenant / working-renter base with shorter leases.
- Market conditions: Rents rising (+1.6%/yr); 272 active listings in the ZIP; 31 comparable units currently listed for rent nearby; rentals at typical pace (median 21d on market — plan ~3-4 weeks tenant-placement turnaround); solid renter incomes; 1,591 units permitted in Marion County in 2024 (716 in 5+ unit buildings).
Forward outlook
- Local home prices are declining (-3.0%/yr); year-one equity from $1k of loan paydown is wiped out by about $5k of value loss. Plan a longer hold.
- Marion County population projected at +17% by 2050 — long-run rental-demand tailwind backs the buy-and-hold thesis.
Negotiation context
- It's been on market 15 days — a 2% lower offer ($172k) is reasonable based on typical stale-listing flexibility.
- 2 sale attempts since 12y ago with the ask held roughly flat each time — persistent listings suggest the price (not the market) is what's stuck; bring a comps-based counter.
Questions for the listing agent
- Built in 1971 — when were the roof, HVAC, electrical panel, plumbing, and water heater last replaced?
- Is there a deadline driving the sale (1031 exchange, divorce, estate, relocation)? That informs how much negotiation room exists.
- Schools are D-rated, which usually means shorter tenancies and higher turnover. Who's the typical renter profile here, and what's been the actual vacancy rate?
- Crime grade is F in this area — have there been break-ins, vandalism, or insurance claims at this property in the last 3 years? What carrier currently insures it and at what premium?
- What's the average days-on-market for RENTAL listings here right now (not sales)? A rising rental-DOM trend means longer vacancies and softer asking-rent achievability than the comps imply.
- What's the recent tenant-quality profile in this submarket — average credit score on applications, eviction rate, late-payment / NSF rate, and stable-employment percentage? A property-management company in the area should have these aggregated.
- How much new for-sale + rental construction is in the pipeline within 1–3 miles? Heavy new supply typically softens prices + rents 12–24 months out; constrained supply supports both.
Investment metrics
- 1% rule
- 0.98% ✗
- Cap rate
- 7.74%
- Cash-on-cash
- 5.16%
- DSCR
- 1.23
- GRM
- 8.5
CMA / ARV
- ARV (median comp)
- $402,530
- List price
- $175,000
- Delta
- -56.52%
- Verdict
- UNDERPRICED
- Comps
- 20 within 1.0 mi
Show comp detail 7 sales within ~0.75 mi
| Address | Dist | Beds/Ba | Sqft | Sold | Price | $/sf | Match |
|---|---|---|---|---|---|---|---|
| 1968 Spicetree Ln | 0.21mi | 3/2.0 (+1) | 1,390 (+3%) | 7mo | $423,857 | $305 | 74 |
| 6591 Fairway Ave SE | 0.31mi | 2/2.0 | 1,340 (-0%) | 15mo | $312,000 | $233 | 72 |
| 2514 Locksley Ave SE | 0.58mi | 3/2.0 (+1) | 1,385 (+3%) | 13mo | $441,000 | $318 | 52 |
| 1425 Rees Hill Rd SE | 0.56mi | 3/2.0 (+1) | 1,428 (+6%) | 10mo | $455,000 | $319 | 51 |
| 1400 Rees Hl SE | 0.57mi | 3/2.0 (+1) | 1,464 (+9%) | 8mo | $425,000 | $290 | 47 |
| 2521 Round Table Ct SE | 0.57mi | 3/2.0 (+1) | 1,181 (-12%) | 16mo | $390,000 | $330 | 35 |
| 2525 Tournament Ave | 0.64mi | 3/2.0 (+1) | 1,521 (+13%) | 24mo | $449,000 | $295 | 24 |
Match score weights: distance 35% · size 25% · config 20% · recency 20%. Top-matched comps best support the ARV.
Projected returns pro-forma
-3.0% appreciation · 1.64% rent growth · sell at horizon
- IRR
- -9.8%
- Equity multiple
- 0.65×
- Total profit
- $-17,257
- Equity at exit
- $26,093
- IRR
- -2.2%
- Equity multiple
- 0.86×
- Total profit
- $-7,018
- Equity at exit
- $15,131
Cash invested: $49,000 (down + closing). Projections, not guarantees.
Landlord ↔ Tenant lean methodology
- Overall (STATE)
- 28 Tenant-Leaning
- State Oregon
- 28 Tenant-Leaning · D+6
- County
- — inherits STATE
- City
- — inherits STATE
ZIP-level market 97306
- Rents YoY
- 1.6%
- Active inventory
- 272
- Price-to-rent
- 8.5×
Monthly cashflow live
- Estimated rent
- $1,707 high interval (Pro) →
- Mortgage (P&I)
- −$918
- Tax from tax record
- −$147 /mo · $1,766/yr
- Insurance
- −$73
- HOA
- −$0
- Vacancy / Maint / Mgmt
- −$358
- Net cashflow
- $211
Break-even live
UW: 25.0% down · 7.5% · 30yr · 1.5% tax · 5.0% vac · 8.0% maint · 8.0% mgmt
Financing live
Cash to close
- Down payment
- $43,750
- Closing costs
- $5,250
- Reserves months
- —
- Total cash needed
- —
Loan-product check · same deal, 3 products live
Conventional
25% down · 7.5% · 30yr
- Down + closing
- —
- Monthly P&I
- —
- Monthly cashflow
- —
- DSCR
- —
- Eligible?
- —
Personal DTI + credit; lowest rate.
DSCR
20% down · 8.5% · 30yr
- Down + closing
- —
- Monthly P&I
- —
- Monthly cashflow
- —
- DSCR
- —
- Eligible?
- —
No personal income docs; deal must DSCR.
Hard money
10% down · 12.0% · 12mo
- Down + closing
- —
- Monthly P&I
- —
- Monthly cashflow
- —
- DSCR
- —
- Eligible?
- —
Short-term bridge; refi at stabilization.
Rent comps 31 comps
| Address | Beds | Baths | Sqft | Rent | $/sqft | DOM | Units | Dist |
|---|---|---|---|---|---|---|---|---|
| 2116 Nomad Ct SE Unit 2120 Salem, OR | 2.0 | 1.0 | 1050 | $1,425 | $1.36 | 13d | 1 | 0.09mi |
| 2194 Navaho Ct SE Unit 2198 Salem, OR | 2.0 | 1.0 | 989 | $1,395 | $1.41 | 43d | 1 | 0.18mi |
| 1860 Rees Hill Rd SE Salem, OR | 2.0 | 2.0 | 962 | $1,675 | $1.74 | 13d | 2 | 0.18mi |
| 1860 Rees Hill Rd SE Unit 1870-205 Salem, OR | 2.0 | 2.0 | 1000 | $1,800 | $1.80 | 23d | 1 | 0.18mi |
| 1860 Rees Hill Rd SE Unit 1890-112 Salem, OR | 2.0 | 2.0 | 925 | $1,650 | $1.78 | 43d | 1 | 0.18mi |
| 2220 Navaho Ct SE Unit 2220 Salem, OR | 2.0 | 1.0 | 1023 | $1,295 | $1.27 | 23d | 1 | 0.19mi |
| 6953 Talloc Ave SE Unit 6955 Salem, OR | 3.0 | 2.5 | 1418 | $2,295 | $1.62 | 13d | 1 | 0.50mi |
| 1900 Madras St SE Salem, OR | 1.0–3.0 | 1.0–2.0 | 895 | $1,615 | $1.80 | 13d | 10 | 0.71mi |
| 1691 Waln Dr SE Salem, OR | 1.0–2.0 | 1.0–2.0 | 955 | $1,725 | $1.81 | 13d | 6 | 0.73mi |
| 6127 Blue River Dr SE Salem, OR | 3.0 | 2.5 | 1531 | $2,450 | $1.60 | 43d | 1 | 0.78mi |
| 1951 Madras St SE Salem, OR | 2.0 | 2.5 | 1465 | $1,975 | $1.35 | 21d | 1 | 0.80mi |
| 1626 Madras St SE Salem, OR | 2.0 | 1.0 | 921 | $1,695 | $1.84 | 43d | 1 | 0.82mi |
| 6150 Fircrest St SE Unit 6160 Salem, OR | 3.0 | 1.5 | 1140 | $2,050 | $1.80 | 13d | 1 | 0.86mi |
| 6150 Fircrest St SE Salem, OR | 3.0 | 1.5 | 1140 | $2,050 | $1.80 | 13d | 1 | 0.86mi |
| 5943 Blue River Dr SE Salem, OR | 3.0 | 3.0 | 1472 | $2,395 | $1.63 | 43d | 1 | 0.90mi |
| 1544 Fircrest Ct SE Salem, OR | 2.0 | 1.5 | 1296 | $1,850 | $1.43 | 23d | 1 | 0.91mi |
| 5952 Park Ct SE Salem, OR | 1.0–2.0 | 1.0 | 742 | $1,299 | $1.75 | 13d | 11 | 0.93mi |
| 1807 Wiltsey Rd SE Salem, OR | 1.0–2.0 | 1.0–2.0 | 845 | $1,710 | $2.02 | 13d | 6 | 0.96mi |
| 5851 Reed Ln SE Salem, OR | 2.0 | 2.0 | 990 | $1,652 | $1.67 | 13d | 7 | 0.97mi |
| 1410 Jonmart Ave SE Salem, OR | 3.0 | 2.0 | 1096 | $1,995 | $1.82 | 13d | 1 | 0.97mi |
| 5775 Commercial St SE Salem, OR | 1.0–3.0 | 1.0–2.0 | 779 | $1,970 | $2.53 | 23d | 17 | 1.00mi |
| 5775 Commercial St SE Salem, OR | 1.0–3.0 | 1.0–2.0 | 779 | $1,900 | $2.44 | 13d | 47 | 1.00mi |
| 5823 Reed Ln SE Unit 112 Salem, OR | 2.0 | 2.5 | 1198 | $1,995 | $1.67 | 23d | 1 | 1.03mi |
| 5815 Reed Ln SE Unit 133 Salem, OR | 2.0 | 2.5 | 1198 | $1,995 | $1.67 | 23d | 1 | 1.06mi |
| 1543 Wiltsey Rd SE Salem, OR | 2.0 | 1.0–2.0 | 1043 | $1,475 | $1.41 | 13d | 4 | 1.08mi |
| 5512 Murray St SE Salem, OR | 3.0 | 2.0 | 1275 | $2,645 | $2.07 | 21d | 1 | 1.36mi |
| 5787 Sunstone St SE Unit 5787 Salem, OR | 3.0 | 1.5 | 1192 | $1,645 | $1.38 | 23d | 1 | 1.41mi |
| 2772 Bastille Ave SE Salem, OR | 3.0 | 2.0 | 1614 | $2,495 | $1.55 | 21d | 1 | 1.42mi |
| 5535 Woodside Dr SE Unit 442-60 Salem, OR | 2.0 | 1.0 | 982 | $1,399 | $1.42 | 43d | 1 | 1.42mi |
| 5442 Monterey Dr SE Unit 5442 Salem, OR | 2.0 | 2.0 | 1112 | $1,995 | $1.79 | 23d | 1 | 1.48mi |
| 5423 Monterey Dr SE Salem, OR | 3.0 | 2.0 | 1457 | $2,295 | $1.58 | 23d | 1 | 1.48mi |
Listing history 7 events
-
2026-05-04$175,000 Active 752-char remark
-
2014-10-03soldstatus $87,000 Sold
-
2014-10-03soldstatus $87,000
-
2014-07-24status Pending
-
2014-04-09historical
-
2014-02-03price $99,500
-
2014-01-17$102,500 Active
ⓘ Source: listings_history table (triggers on properties + properties_extension) + one-shot
backfill from property_details.listing_events for pre-trigger history.
Tax reassessment forecast OR · Resets to sale price
- Current annual tax
- $1,766 · $147/mo
- Projected year-2 tax
- $1,766 · $147/mo
- Expected delta
- $0/yr ($0/mo · 0.0%)
ⓘ Screening estimate from a state-policy table — verify with the county assessor before closing.
Climate risk First Street
- Flood 1/10 Low FEMA zone X (unshaded) · 0% chance over 30 yrs
- Wildfire 4/10 Moderate
- Heat 3/10 Moderate 7 d/yr ≥91°F today · 14 d/yr by 30 yrs out
- Wind 1/10 Low
- Air quality 9/10 Extreme 12 unhealthy d/yr today · 13 by 30 yrs out
Nearby sold comps map
Loading sold comps map…
Walkable amenities ~0.75 mi
Loading nearby amenities…
Taxation est. · year 1
- Rental income
- $20,485
- − Mortgage interest
- −$9,803
- − Property taxes
- −$1,766
- − Insurance
- −$875
- − Repairs & maintenance
- −$1,639
- − Management
- −$1,639
- − Depreciation
- −$5,091
- Taxable loss
- −$328
- Est. tax savings @ 24.0%
- +$79
- After-tax cash flow
- $2,608/yr
For passive investors: Depreciation is non-cash, so a rental often shows a tax loss while cash-flowing — sheltering income. Rental losses are passive: they offset passive income freely, and up to $25,000/yr can offset ordinary (W-2) income if you actively participate and your MAGI is under $100k (phasing out to $0 by $150k); unused losses carry forward. On sale, claimed depreciation is recaptured at up to 25%, and gains may owe capital-gains tax (a 1031 exchange can defer both). Figures are a year-1 estimate at your 24.0% rate — not tax advice; consult a CPA.
Schools (NCES district)
- District
- Salem-Keizer SD 24J
- NCES district ID
- 4110820
- Math proficiency
- 34% ▼ -1.00%
- Reading proficiency
- 47% ▼ -2.00%
- Median HH income
- $48,632
- Composite
- 37.16/100
- National rank
- #9017
- State rank
- #103 of 183 in OR
Livability — Salem
- Score
- 79/100
- State rank
- #59
- US rank
- #2084
Category grades
Schools grade is shown separately in the Schools card above.
Census & demographics
- Census place
- Salem, OR
- County
- Marion County · 258,219 people
- City population
- 193,601
- Metro
- Salem, OR
- Population (ZIP)
- 34,383
- Household income
- $101,753
- Rent vs Own
- Severe rent burden
- 1437.0
Population outlook (Marion County) Hauer SSP2
- Today (2025)
- 360,940 people
- By 2030
- 375,178 · +3.9%
- By 2040
- 400,914 · +11.1%
- By 2050
- 422,187 · +17.0%
- By 2075
- 460,305 · +27.5%
- By 2100
- 464,025 · +28.6%
Race, ethnicity, and origin ACS 2023
- Neighborhood character
- Predominantly White (74%)
- Race & ethnicity
- White 74% Hispanic / Latino 12% Two or more races 9% Asian 5% Pacific Islander 2% Black 1%
- Hispanic origin (detail)
- Mexican 9%
- Common ancestry
- Italian 6% Portuguese 5% Slovak 3%
- Foreign-born
- 8% · Canada, China, Vietnam
- Languages at home
- 86% English-only · Spanish 6% Other Asian/Pacific 3% Russian/Polish/Slavic 1%
Political lean MEDSL · Marion
- 2024 margin
- Toss-up / Even · D 47.5% · R 49.5% · Other 3.0%
- 2008→2024 swing
- -4.2pp toward R · 2008: 2.2pp · 2024: -2.0pp
- All cycles
- 2024: R+2.0 2020: D+1.1 2016: R+5.0 2012: R+3.5 2008: D+2.2
Not yet ingested
- Civics
- —
Market trends
- HPI YoY
- ▼ -335.25%
- Current HPI
- 279.7875
- Rent YoY
- ▲ 1.64%
- Metro
- Salem, OR
- State GDP YoY
- ▲ 2.05%
- F500 in state
- 2
Industry mix (Fortune 500 HQ in OR)
| Industry | F500 HQs | Revenue |
|---|---|---|
| Consumer Goods | 1 | $51B |
|
||
Price history
+56.1% since first listed10 events — show timeline
- 2026-06-04 Sold (Public Records) $160,000 Public Records
- 2026-06-04 Sold (MLS) $160,000 WVMLS
- 2026-05-19 Pending — WVMLS
- 2026-05-04 Listed $175,000 WVMLS
- 2014-10-03 Sold (Public Records) $87,000 Public Records
- 2014-10-03 Sold (MLS) $87,000 WVMLS
- 2014-07-24 Pending — WVMLS
- 2014-04-09 Listing Removed — WVMLS
- 2014-02-03 Price Changed $99,500 WVMLS
- 2014-01-17 Listed $102,500 WVMLS
Property tax history
+3.5%/yrLatest (2025): $1,766 · +7.8% YoY. Source: county tax records.
Cash-flow waterfall
monthlySold comps — $/sqft
last 12 mo · ≤1 miLoading sold comps…