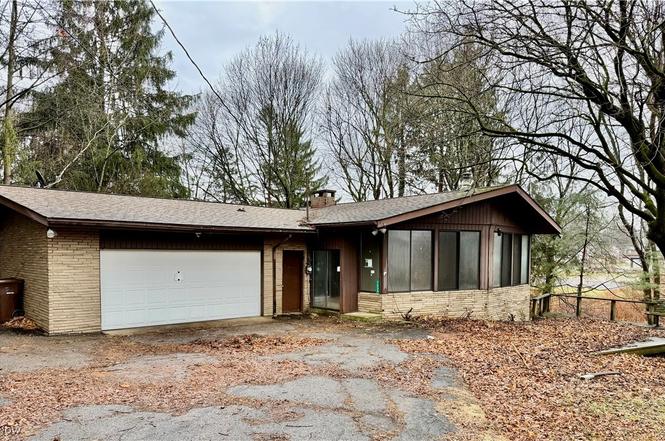
2898 Canton Rd · Uniontown, OH
Flood risk No data
- FEMA flood zone
- —
- Chance of flooding over 30 yrs
- %
- Est. flood insurance / yr
- —
Fire risk No data
- Est. fire insurance / yr
- —
Heat risk No data
- Hot days now (above °F)
- days/yr
- Hot days in 30 yrs
- days/yr
Wind risk No data
- Chance of severe wind over 30 yrs
- %
Air-quality risk No data
- Unhealthy air days now
- days/yr
- Unhealthy air days in 30 yrs
- days/yr
Risk factors via First Street. Map © Google.
Why this score? — see what drove the C- grade
The composite is a weighted blend of 9 inputs, each scored 0–100. Each bar is that input's sub-score; the figure is the points it added to the 100-point composite (weight × sub-score).
- Cash flow +19.3/30.0
- ARV discount +7.5/15.0
- DSCR +6.1/10.0
- 1% rule +5.1/10.0
- Livability +3.9/5.0
- Schools +3.7/10.0
- Rent growth +2.5/5.0
- Condition / age +2.5/5.0
- Appreciation +0.0/10.0
$190,000
🖨 Deal sheet 📄 Offer letter ✓ Due diligence
Listing remarks
Investor special or perfect project for a buyer with vision! This home offers an exciting opportunity to create something truly special. The home features an open-concept layout and several modern design elements that provide a strong foundation for renovation and customization. With the right updates, this property has the potential to shine. Whether you’re an investor, flipper, or homeowner looking to build equity through improvements, this property is a blank canvas ready for transformation. Priced to reflect its condition, it presents a great value in today’s market. Bring your ideas, your contractor, and your creativity to unlock its full potential. Schedule your private sh
Key facts
- 1.02 acre lot
- 2 garage spots
- Built 1967
Neighborhood map
What this means for you Summary
Snapshot
- This is a 3-bed/2.0-bath single-family listed at $190k.
Deal economics
- At list price, monthly cash flow is $208 ($2k/yr) — positive.
- The deal already cash-flows at list — no discount required.
- Meets the 1% rule at list price ($2k rent vs $190k).
- Recommended offer: $167k (12.0% below list) — sets the bar for market timing.
- Cap rate 7.6% vs local median 3.0% in Uniontown — top-decile yield for the area; either an underpriced asset or a hidden risk that comps aren't pricing in. Stress-test before assuming the spread holds.
Location & tenants
- Location reads 78/100 on livability (#176 in OH, #2,742 nationally) — a middle-class / working-renter tenant base. Strengths: schools A+, employment A+, cost of living A+; Watch: amenities F, commute F, health & safety F.
- Springfield Local (suburban): math 40% / reading 46% proficiency, ranked #512 of 656 in OH (top 78%) — families likely to look elsewhere, expect single-tenant / working-renter base with shorter leases.
- Market conditions: 182 active listings in the ZIP; solid renter incomes; 1,114 units permitted in Summit County in 2024 (397 in 5+ unit buildings).
Forward outlook
- Local home prices are declining (-3.0%/yr); year-one equity from $1k of loan paydown is wiped out by about $6k of value loss. Plan a longer hold.
- Summit County population projected to shrink 6% by 2050 — rents likely to lag national; underwrite the cash flow, not the appreciation.
Negotiation context
- It's been on market 148 days — a 12% lower offer ($167k) is reasonable based on typical stale-listing flexibility.
Questions for the listing agent
- It's been on market 148 days. Have you received any prior offers? Is the seller open to a 12% concession, seller financing, or rate buy-down credit?
- Built in 1967 — when were the roof, HVAC, electrical panel, plumbing, and water heater last replaced?
- Why hasn't it sold? Are there any deal-killer items the seller is aware of (foundation, flood, title, zoning, code violations)?
- Is there a deadline driving the sale (1031 exchange, divorce, estate, relocation)? That informs how much negotiation room exists.
- Schools are A-rated — typically a magnet for longer-tenancy family renters. What's the average tenant stay here, and is there a school-zone premium baked into asking?
- What's the average days-on-market for RENTAL listings here right now (not sales)? A rising rental-DOM trend means longer vacancies and softer asking-rent achievability than the comps imply.
- What's the recent tenant-quality profile in this submarket — average credit score on applications, eviction rate, late-payment / NSF rate, and stable-employment percentage? A property-management company in the area should have these aggregated.
- How much new for-sale + rental construction is in the pipeline within 1–3 miles? Heavy new supply typically softens prices + rents 12–24 months out; constrained supply supports both.
Investment metrics
- 1% rule
- 1.01% ✓
- Cap rate
- 7.61%
- Cash-on-cash
- 4.69%
- DSCR
- 1.21
- GRM
- 8.2
CMA / ARV
No comps found within radius.
Projected returns pro-forma
-3.0% appreciation · 3.0% rent growth · sell at horizon
- IRR
- -9.0%
- Equity multiple
- 0.67×
- Total profit
- $-17,519
- Equity at exit
- $28,330
- IRR
- 0.5%
- Equity multiple
- 1.04×
- Total profit
- $1,911
- Equity at exit
- $16,428
Cash invested: $53,200 (down + closing). Projections, not guarantees.
Landlord ↔ Tenant lean methodology
- Overall (STATE)
- 73 Landlord-Friendly
- State Ohio
- 73 Landlord-Friendly · R+6
- County
- — inherits STATE
- City
- — inherits STATE
ZIP-level market 44685
- Active inventory
- 182
- Price-to-rent
- 8.2×
Monthly cashflow live
- Estimated rent
- $1,925 medium interval (Pro) →
- Mortgage (P&I)
- −$996
- Tax est. 1.5%
- −$238 /mo · $2,850/yr
- Insurance
- −$79
- HOA
- −$0
- Vacancy / Maint / Mgmt
- −$404
- Net cashflow
- $208
Break-even live
UW: 25.0% down · 7.5% · 30yr · 1.5% tax · 5.0% vac · 8.0% maint · 8.0% mgmt
Financing live
Cash to close
- Down payment
- $47,500
- Closing costs
- $5,700
- Reserves months
- —
- Total cash needed
- —
Loan-product check · same deal, 3 products live
Conventional
25% down · 7.5% · 30yr
- Down + closing
- —
- Monthly P&I
- —
- Monthly cashflow
- —
- DSCR
- —
- Eligible?
- —
Personal DTI + credit; lowest rate.
DSCR
20% down · 8.5% · 30yr
- Down + closing
- —
- Monthly P&I
- —
- Monthly cashflow
- —
- DSCR
- —
- Eligible?
- —
No personal income docs; deal must DSCR.
Hard money
10% down · 12.0% · 12mo
- Down + closing
- —
- Monthly P&I
- —
- Monthly cashflow
- —
- DSCR
- —
- Eligible?
- —
Short-term bridge; refi at stabilization.
Listing history 4 events
-
2026-06-18days on market $190,000 Active 148 DOM
-
2026-06-17days on market $190,000 Active 147 DOM
-
2026-06-16remarks 687-char remark
-
2026-06-16$190,000 Active 146 DOM
ⓘ Source: listings_history table (triggers on properties + properties_extension) + one-shot
backfill from property_details.listing_events for pre-trigger history.
Nearby sold comps map
Loading sold comps map…
Walkable amenities ~0.75 mi
Loading nearby amenities…
Taxation est. · year 1
- Rental income
- $23,103
- − Mortgage interest
- −$10,643
- − Property taxes
- −$2,850
- − Insurance
- −$950
- − Repairs & maintenance
- −$1,848
- − Management
- −$1,848
- − Depreciation
- −$5,527
- Taxable loss
- −$564
- Est. tax savings @ 24.0%
- +$135
- After-tax cash flow
- $2,630/yr
For passive investors: Depreciation is non-cash, so a rental often shows a tax loss while cash-flowing — sheltering income. Rental losses are passive: they offset passive income freely, and up to $25,000/yr can offset ordinary (W-2) income if you actively participate and your MAGI is under $100k (phasing out to $0 by $150k); unused losses carry forward. On sale, claimed depreciation is recaptured at up to 25%, and gains may owe capital-gains tax (a 1031 exchange can defer both). Figures are a year-1 estimate at your 24.0% rate — not tax advice; consult a CPA.
Schools (NCES district)
- District
- Springfield Local
- NCES district ID
- 3905006
- Math proficiency
- 40% ▼ -16.00%
- Reading proficiency
- 46% ▼ -12.00%
- Median HH income
- $47,669
- Composite
- 36.74/100
- National rank
- #4588
- State rank
- #512 of 656 in OH
Livability — Uniontown
- Score
- 78/100
- State rank
- #176
- US rank
- #2742
Category grades
Schools grade is shown separately in the Schools card above.
Census & demographics
- County
- Summit County · 440,783 people
- City population
- 28,794
- Metro
- Akron, OH
- Population (ZIP)
- 28,794
- Household income
- $102,773
- Rent vs Own
- Severe rent burden
- 403.0
Population outlook (Summit County) Hauer SSP2
- Today (2025)
- 546,583 people
- By 2030
- 544,028 · -0.5%
- By 2040
- 531,363 · -2.8%
- By 2050
- 514,923 · -5.8%
- By 2075
- 481,765 · -11.9%
- By 2100
- 432,265 · -20.9%
Race, ethnicity, and origin ACS 2023
- Neighborhood character
- Predominantly White (93%)
- Race & ethnicity
- White 93% Two or more races 3% Hispanic / Latino 2% Asian 2% Black 1%
- Common ancestry
- Romanian 2% Lithuanian 2% Slovak 2%
- Foreign-born
- 2% · Canada, China, South Korea
- Languages at home
- 97% English-only · Russian/Polish/Slavic 1% Spanish 1%
Political lean MEDSL · Summit
- 2024 margin
- Lean D (+7.0) · D 53.0% · R 46.0%
- 2008→2024 swing
- -9.6pp toward R · 2008: 16.6pp · 2024: 7.0pp
- All cycles
- 2024: D+7.0 2020: D+9.6 2016: D+8.2 2012: D+14.8 2008: D+16.6
Not yet ingested
- Civics
- —
Market trends
- HPI YoY
- ▼ -197.59%
- Current HPI
- 217.2906
- Rent YoY
- —
- Metro
- Akron, OH
- State GDP YoY
- ▲ 1.98%
- F500 in state
- 48
Industry mix (Fortune 500 HQ in OH)
| Industry | F500 HQs | Revenue |
|---|---|---|
| Insurance | 3 | $145B |
|
||
| Industrial Machinery | 3 | $49B |
|
||
| Financial Services | 3 | $24B |
|
||
| Consumer Goods | 2 | $93B |
|
||
| Aerospace / Defense | 2 | $47B |
|
||
| Utilities | 2 | $33B |
|
||
Cash-flow waterfall
monthlySold comps — $/sqft
last 12 mo · ≤1 miLoading sold comps…