 42-Plex
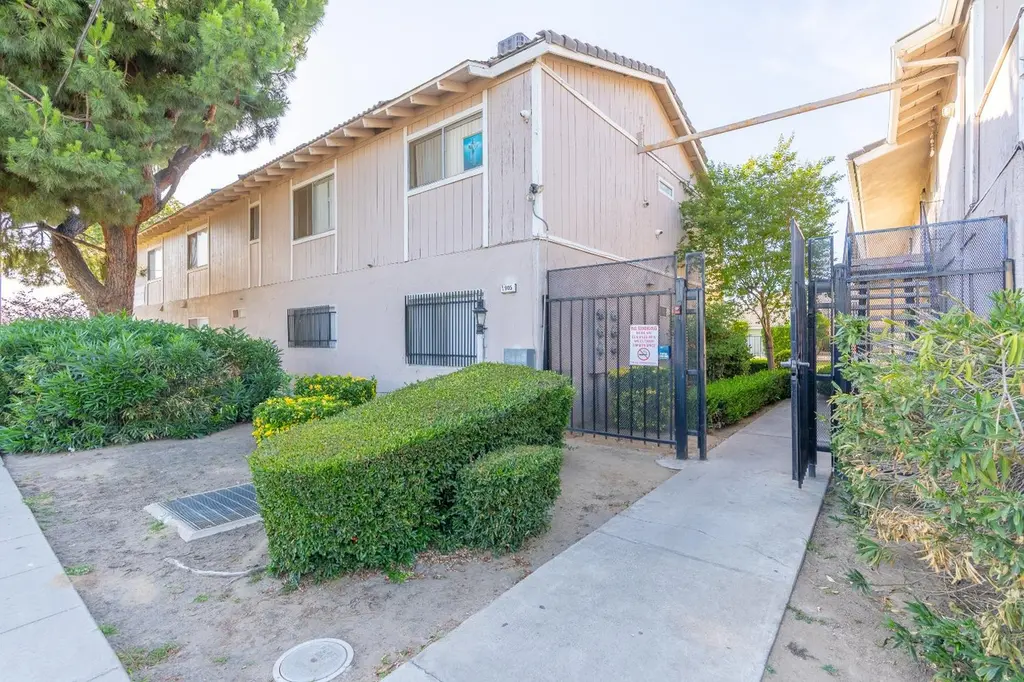
1905 E Pontiac Way · Fresno, CA
Flood risk 3/10 · Minor
- FEMA flood zone
- X (shaded)
- Chance of flooding over 30 yrs
- 0.1%
- Est. flood insurance / yr
- $507 – $1,088
Fire risk 1/10 · Minimal
- Est. fire insurance / yr
- $659 – $1,223
Heat risk 8/10 · Major
- Hot days now (above 105°F)
- 7 days/yr
- Hot days in 30 yrs
- 17 days/yr
Wind risk 1/10 · Minimal
- Chance of severe wind over 30 yrs
- —
Air-quality risk 10/10 · Severe
- Unhealthy air days now
- 48 days/yr
- Unhealthy air days in 30 yrs
- 50 days/yr
Risk factors via First Street. Map © Google.
Why this score? — see what drove the C- grade
The composite is a weighted blend of 9 inputs, each scored 0–100. Each bar is that input's sub-score; the figure is the points it added to the 100-point composite (weight × sub-score).
- Cash flow +20.7/30.0
- ARV discount +7.5/15.0
- DSCR +6.6/10.0
- 1% rule +4.3/10.0
- Rent growth +3.2/5.0
- Livability +3.1/5.0
- Schools +2.7/10.0
- Condition / age +2.5/5.0
- Appreciation +0.0/10.0
$5,670,000
🖨 Deal sheet 📄 Offer letter ✓ Due diligence
Multi-family units
County records classify this as Multi-Family (5+ Unit). Listing-text estimate: 42 units. confirmed
5+ unit building — per-unit beds/baths from public records are typically unavailable; the breakdown below (if shown) is an estimate from the listing text.
Listing remarks MLS
Very nice 42 units apartment complex offered at $35,000 per door. This property is located on 1.17 acre corner lot. Tile roof and stucco exterior. Covered parking, large open area w/ fenced pool & recreation room. Walking distance to Manchester Mall. With a very low inventory this property makes a great choice for savvy investor. Please write offers subject to walk through inspection and please do not walk the grounds. Tenants are not aware of sale!
Key facts
- Gated pool
- 42 unit community
- Lush landscaping
Tags
Property features AI
Finance
- HOA & community: On-site manager
Exterior
- Parking: Carport; Open parking available
- Utilities: Electric service on; Public utilities
- Home design: Multi-family property
- Construction: Stucco, wood siding, and brick exterior; Concrete perimeter foundation with wood subfloor
- Exterior features: Tile roof; Two levels; Urban lot setting; Community pool
Interior
- Kitchen: Multiple refrigerators; Multiple stoves
- Bathrooms: Multiple bathrooms
- Heating & cooling: Central heat and air conditioning
- Interior features: Refrigerators (more than one unit); Stoves (more than one unit); Washer/Dryer units (leased); Central heat and air conditioning; No fireplaces
- Laundry & utility: Washer and dryer units (leased); On-site utility room
Neighborhood map
What this means for you Summary
Snapshot
- This is a 40×1bd/1ba + 2×2bd/1ba units multifamily listed at $5.67M.
Deal economics
- At list price, monthly cash flow is $8k ($92k/yr) — positive. Per door: $183/mo.
- The deal already cash-flows at list — no discount required.
- To meet the 1% rule (rent ≥ 1% of price), the offer needs to be $5.28M (6.9% below list).
- Recommended offer: $5.28M (6.9% below list) — sets the bar for 1% rule.
- Cap rate 7.9% vs local median 3.7% in Fresno — top-decile yield for the area; either an underpriced asset or a hidden risk that comps aren't pricing in. Stress-test before assuming the spread holds.
Location & tenants
- Location reads 62/100 on livability (#469 in CA) — a middle-class / working-renter tenant base. Strengths: commute A+, housing A+; Watch: amenities D+, employment D+, schools D.
- Fresno Unified (urban): math 18% / reading 47% proficiency, ranked #327 of 517 in CA (top 63%) — families likely to look elsewhere, expect single-tenant / working-renter base with shorter leases; 77% free/reduced lunch — lower-income household profile, screen leases tightly.
- Market conditions: Rents rising (+2.6%/yr); 83 active listings in the ZIP; 2,426 units permitted in Fresno County in 2024 (296 in 5+ unit buildings).
- At $52,813/mo this rent would consume 1136% of the median local household income ($56k/yr) (locally 3028% of renters already pay >50% of income on rent) — very limited rent-growth headroom before tenants either downsize or default.
Forward outlook
- Local home prices are declining (-3.0%/yr); year-one equity from $39k of loan paydown is wiped out by about $170k of value loss. Plan a longer hold.
- Fresno County population projected at +11% by 2050 — modest demand growth; plan on rents tracking national, not racing it.
Negotiation context
- It's been on market 15 days — a 2% lower offer ($5.58M) is reasonable based on typical stale-listing flexibility.
- 5 sale attempts since 14y ago with the ask held roughly flat each time — persistent listings suggest the price (not the market) is what's stuck; bring a comps-based counter.
- Current owner paid $1.50M; list at $5.67M implies a 278% gain — meaningful room to come down on a strong offer.
Risks & watch-outs
- Climate carrying-cost: extreme-heat days projected 7→17/yr by 2055 (HVAC capex compounding) — expect insurance premiums to compound above CPI over the hold.
Questions for the listing agent
- Can we see the unit-by-unit rent roll, current vacancy, and any below-market leases? What's the average tenancy length?
- What capital expenditures (roof, boiler, parking lot, exteriors) have been made in the last 5 years, and what's planned in the next 2?
- Built in 1978 — when were the roof, HVAC, electrical panel, plumbing, and water heater last replaced?
- Is there a deadline driving the sale (1031 exchange, divorce, estate, relocation)? That informs how much negotiation room exists.
- Schools are D-rated, which usually means shorter tenancies and higher turnover. Who's the typical renter profile here, and what's been the actual vacancy rate?
- Crime grade is F in this area — have there been break-ins, vandalism, or insurance claims at this property in the last 3 years? What carrier currently insures it and at what premium?
- What's the average days-on-market for RENTAL listings here right now (not sales)? A rising rental-DOM trend means longer vacancies and softer asking-rent achievability than the comps imply.
- What's the recent tenant-quality profile in this submarket — average credit score on applications, eviction rate, late-payment / NSF rate, and stable-employment percentage? A property-management company in the area should have these aggregated.
- How much new apartment / multifamily construction is in the pipeline within 1–3 miles? Heavy new supply (>2% of stock underway) typically softens rents 12–24 months out; light construction supports rent growth.
Investment metrics
- 1% rule
- 0.93% ✗
- Cap rate
- 7.92%
- Cash-on-cash
- 5.80%
- DSCR
- 1.26
- GRM
- 8.9
CMA / ARV
No comps found within radius.
Projected returns pro-forma
-3.0% appreciation · 2.64% rent growth · sell at horizon
- IRR
- -7.7%
- Equity multiple
- 0.72×
- Total profit
- $-451,621
- Equity at exit
- $845,415
- IRR
- 1.3%
- Equity multiple
- 1.09×
- Total profit
- $148,632
- Equity at exit
- $490,238
Cash invested: $1,587,600 (down + closing). Projections, not guarantees.
Landlord ↔ Tenant lean methodology
- Overall (STATE)
- 18 Strongly Tenant-Friendly
- State California
- 18 Strongly Tenant-Friendly · D+13
- County
- — inherits STATE
- City
- — inherits STATE
ZIP-level market 93726
- Rents YoY
- 2.6%
- Active inventory
- 83
- Price-to-rent
- 376.9×
Monthly cashflow live
- Estimated rent
- $52,813 high interval (Pro) →
- Mortgage (P&I)
- −$29,734
- Tax from tax record
- −$1,954 /mo · $23,454/yr
- Insurance
- −$2,362
- HOA
- −$0
- Vacancy / Maint / Mgmt
- −$11,091
- Net cashflow
- $7,671
Break-even live
42-unit breakdown (identical units grouped — click to expand)
| Units | Beds | Baths | Est. rent |
|---|---|---|---|
| 40× units | 1 | 1 | $50,160 |
| #1 | 1 | 1 | $1,254 |
| #2 | 1 | 1 | $1,254 |
| #3 | 1 | 1 | $1,254 |
| #4 | 1 | 1 | $1,254 |
| #5 | 1 | 1 | $1,254 |
| #6 | 1 | 1 | $1,254 |
| #7 | 1 | 1 | $1,254 |
| #8 | 1 | 1 | $1,254 |
| #9 | 1 | 1 | $1,254 |
| #10 | 1 | 1 | $1,254 |
| #11 | 1 | 1 | $1,254 |
| #12 | 1 | 1 | $1,254 |
| #13 | 1 | 1 | $1,254 |
| #14 | 1 | 1 | $1,254 |
| #15 | 1 | 1 | $1,254 |
| #16 | 1 | 1 | $1,254 |
| #17 | 1 | 1 | $1,254 |
| #18 | 1 | 1 | $1,254 |
| #19 | 1 | 1 | $1,254 |
| #20 | 1 | 1 | $1,254 |
| #21 | 1 | 1 | $1,254 |
| #22 | 1 | 1 | $1,254 |
| #23 | 1 | 1 | $1,254 |
| #24 | 1 | 1 | $1,254 |
| #25 | 1 | 1 | $1,254 |
| #26 | 1 | 1 | $1,254 |
| #27 | 1 | 1 | $1,254 |
| #28 | 1 | 1 | $1,254 |
| #29 | 1 | 1 | $1,254 |
| #30 | 1 | 1 | $1,254 |
| #31 | 1 | 1 | $1,254 |
| #32 | 1 | 1 | $1,254 |
| #33 | 1 | 1 | $1,254 |
| #34 | 1 | 1 | $1,254 |
| #35 | 1 | 1 | $1,254 |
| #36 | 1 | 1 | $1,254 |
| #37 | 1 | 1 | $1,254 |
| #38 | 1 | 1 | $1,254 |
| #39 | 1 | 1 | $1,254 |
| #40 | 1 | 1 | $1,254 |
| 2× units | 2 | 1 | $2,662 |
| #41 | 2 | 1 | $1,331 |
| #42 | 2 | 1 | $1,331 |
| Total (42 units) | $52,813 | ||
UW: 25.0% down · 7.5% · 30yr · 1.5% tax · 5.0% vac · 8.0% maint · 8.0% mgmt
Financing live
Cash to close
- Down payment
- $1,417,500
- Closing costs
- $170,100
- Reserves months
- —
- Total cash needed
- —
Loan-product check · same deal, 3 products live
Conventional
25% down · 7.5% · 30yr
- Down + closing
- —
- Monthly P&I
- —
- Monthly cashflow
- —
- DSCR
- —
- Eligible?
- —
Personal DTI + credit; lowest rate.
DSCR
20% down · 8.5% · 30yr
- Down + closing
- —
- Monthly P&I
- —
- Monthly cashflow
- —
- DSCR
- —
- Eligible?
- —
No personal income docs; deal must DSCR.
Hard money
10% down · 12.0% · 12mo
- Down + closing
- —
- Monthly P&I
- —
- Monthly cashflow
- —
- DSCR
- —
- Eligible?
- —
Short-term bridge; refi at stabilization.
Listing history 11 events
-
2026-06-18days on market $5,670,000 Active 15 DOM
-
2026-06-17days on market $5,670,000 Active 14 DOM
-
2026-06-16days on market $5,670,000 Active 13 DOM
-
2026-06-15days on market $5,670,000 Active 12 DOM
-
2026-06-13days on market $5,670,000 Active 10 DOM
-
2026-06-10days on market $5,670,000 Active 7 DOM
-
2026-06-09days on market $5,670,000 Active 6 DOM
-
2026-06-08days on market $5,670,000 Active 5 DOM
-
2026-06-07days on market $5,670,000 Active 4 DOM
-
2026-06-05remarks 699-char remark
-
2026-06-05$5,670,000 Active 1 DOM
ⓘ Source: listings_history table (triggers on properties + properties_extension) + one-shot
backfill from property_details.listing_events for pre-trigger history.
Tax reassessment forecast CA · Resets to sale price
- Current annual tax
- $23,454 · $1,954/mo
- Projected year-2 tax
- $43,092 · $3,591/mo
- Expected delta
- +$19,638/yr (+$1,637/mo · 83.7%)
ⓘ Screening estimate from a state-policy table — verify with the county assessor before closing.
Climate risk First Street
- Flood 3/10 Moderate FEMA zone X (shaded) · 10% chance over 30 yrs
- Wildfire 1/10 Low
- Heat 8/10 Severe 7 d/yr ≥105°F today · 17 d/yr by 30 yrs out
- Wind 1/10 Low
- Air quality 10/10 Extreme 48 unhealthy d/yr today · 50 by 30 yrs out
Nearby sold comps map
Loading sold comps map…
Walkable amenities ~0.75 mi
Loading nearby amenities…
Taxation est. · year 1
- Rental income
- $633,756
- − Mortgage interest
- −$317,608
- − Property taxes
- −$23,454
- − Insurance
- −$28,350
- − Repairs & maintenance
- −$50,700
- − Management
- −$50,700
- − Depreciation
- −$164,945
- Taxable loss
- −$2,002
- Est. tax savings @ 24.0%
- +$481
- After-tax cash flow
- $92,535/yr
For passive investors: Depreciation is non-cash, so a rental often shows a tax loss while cash-flowing — sheltering income. Rental losses are passive: they offset passive income freely, and up to $25,000/yr can offset ordinary (W-2) income if you actively participate and your MAGI is under $100k (phasing out to $0 by $150k); unused losses carry forward. On sale, claimed depreciation is recaptured at up to 25%, and gains may owe capital-gains tax (a 1031 exchange can defer both). Figures are a year-1 estimate at your 24.0% rate — not tax advice; consult a CPA.
Schools (NCES district)
- District
- Fresno Unified
- NCES district ID
- 0614550
- Math proficiency
- 18% ▼ -12.00%
- Reading proficiency
- 47% ▲ 9.00%
- Median HH income
- $36,095
- Composite
- 26.83/100
- National rank
- #7111
- State rank
- #327 of 517 in CA
Livability — Fresno
- Score
- 62/100
- State rank
- #469
- US rank
- #15907
Category grades
Schools grade is shown separately in the Schools card above.
Census & demographics
- Census place
- Fresno, CA
- County
- Fresno County · 834,801 people
- City population
- 593,114
- Metro
- Fresno, CA
- Population (ZIP)
- 44,527
- Household income
- $55,771
- Rent vs Own
- Severe rent burden
- 3028.0
Population outlook (Fresno County) Hauer SSP2
- Today (2025)
- 1,042,971 people
- By 2030
- 1,072,198 · +2.8%
- By 2040
- 1,122,408 · +7.6%
- By 2050
- 1,157,251 · +11.0%
- By 2075
- 1,182,575 · +13.4%
- By 2100
- 1,105,899 · +6.0%
Race, ethnicity, and origin ACS 2023
- Neighborhood character
- Diverse neighborhood (Simpson 0.60)
- Race & ethnicity
- Hispanic / Latino 58% Two or more races 24% White 22% Asian 8% Black 5% Native American 2%
- Hispanic origin (detail)
- Mexican 53%
- Common ancestry
- Slovak 1% Iranian 1% Italian 1%
- Foreign-born
- 16% · Canada, Philippines
- Languages at home
- 58% English-only · Spanish 34% Other Asian/Pacific 5% Other Indo-European 2%
Political lean MEDSL · Fresno
- 2024 margin
- Toss-up / Even · D 46.5% · R 50.9% · Other 2.6%
- 2008→2024 swing
- -6.5pp toward R · 2008: 2.1pp · 2024: -4.4pp
- All cycles
- 2024: R+4.4 2020: D+7.8 2016: D+3.9 2012: R+2.9 2008: D+2.1
Not yet ingested
- Civics
- —
Market trends
- HPI YoY
- ▼ -343.33%
- Current HPI
- 437.4299
- Rent YoY
- ▲ 2.64%
- Metro
- Fresno, CA
- State GDP YoY
- ▲ 3.21%
- F500 in state
- 116
Industry mix (Fortune 500 HQ in CA)
| Industry | F500 HQs | Revenue |
|---|---|---|
| Technology | 27 | $1,492B |
|
||
| Financial Services | 3 | $174B |
|
||
| Retail | 3 | $44B |
|
||
| Insurance | 3 | $26B |
|
||
| Media / Entertainment | 2 | $115B |
|
||
| Pharmaceuticals / Biotech | 2 | $62B |
|
||
Price history
+980.0% since first listed17 events — show timeline
- 2026-06-03 Listed $5,670,000 FRESNOMLS
- 2016-09-30 Sold (Public Records) $1,500,000 Public Records
- 2016-09-30 Sold (MLS) $1,500,000 FRESNOMLS
- 2016-06-15 Pending — FRESNOMLS
- 2015-12-29 Listed $1,500,000 FRESNOMLS
- 2015-12-29 Delisted — FRESNOMLS
- 2015-05-02 Price Changed $1,650,000 FRESNOMLS
- 2015-02-28 Listed $1,699,000 FRESNOMLS
- 2015-02-28 Delisted — FRESNOMLS
- 2014-08-04 Listed $1,700,000 FRESNOMLS
- 2013-03-01 Sold (Public Records) $1,425,000 Public Records
- 2013-03-01 Sold (MLS) $1,425,000 FRESNOMLS
- 2013-02-06 Price Changed $1,450,000 FRESNOMLS
- 2013-02-06 Delisted — FRESNOMLS
- 2012-10-10 Listed $1,425,000 FRESNOMLS
- 1994-07-11 Sold (Public Records) $930,000 Public Records
- 1979-08-30 Sold (Public Records) $525,000 Public Records
Property tax history
+2.2%/yrLatest (2025): $23,454 · +3.8% YoY. Source: county tax records.
Cash-flow waterfall
monthlySold comps — $/sqft
last 12 mo · ≤1 miLoading sold comps…