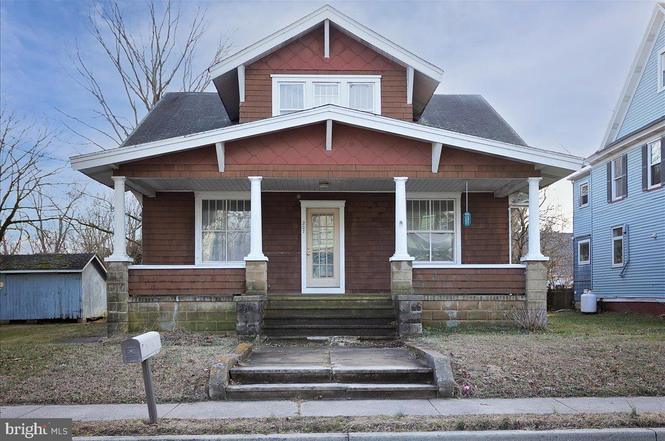
207 W Sunset Ave W · Greensboro, MD
Flood risk 1/10 · Minimal
- FEMA flood zone
- X (unshaded)
- Chance of flooding over 30 yrs
- 0.0%
- Est. flood insurance / yr
- $473 – $860
Fire risk 1/10 · Minimal
- Est. fire insurance / yr
- $755 – $1,403
Heat risk 8/10 · Major
- Hot days now (above 104°F)
- 7 days/yr
- Hot days in 30 yrs
- 15 days/yr
Wind risk 6/10 · Moderate
- Chance of severe wind over 30 yrs
- 41.0%
Air-quality risk 2/10 · Minimal
- Unhealthy air days now
- 2 days/yr
- Unhealthy air days in 30 yrs
- 2 days/yr
Risk factors via First Street. Map © Google.
Why this score? — see what drove the C grade
The composite is a weighted blend of 9 inputs, each scored 0–100. Each bar is that input's sub-score; the figure is the points it added to the 100-point composite (weight × sub-score).
- Cash flow +20.3/30.0
- Appreciation +7.7/10.0
- ARV discount +7.5/15.0
- DSCR +6.4/10.0
- 1% rule +6.1/10.0
- Livability +3.4/5.0
- Rent growth +2.5/5.0
- Condition / age +2.5/5.0
- Schools +1.9/10.0
$195,000
🖨 Deal sheet 📄 Offer letter ✓ Due diligence
Listing remarks
Welcome to 207 W Sunset Avenue, a well-located property in the heart of Greensboro, Maryland. Situated on a quiet residential street, this home offers convenient access to local shops, dining, schools, and parks, while maintaining the charm of a small-town setting. The property presents a solid opportunity for a primary residence, investment, or renovation project. With its established neighborhood and close proximity to major routes, commuting throughout Caroline County and the surrounding Eastern Shore is a breeze! This property is being sold as is and all inspections are for informational purposes only.
Key facts
- 0.32 acre lot
- Built 1914
- Listed 26 days
Neighborhood map
What this means for you Summary
Snapshot
- This is a 6-bed/1.0-bath single-family listed at $195k.
Deal economics
- At list price, monthly cash flow is $250 ($3k/yr) — positive.
- The deal already cash-flows at list — no discount required.
- Meets the 1% rule at list price ($2k rent vs $195k).
- Recommended offer: $192k (1.5% below list) — sets the bar for market timing.
Location & tenants
- Location reads 68/100 on livability (#202 in MD) — a middle-class / working-renter tenant base. Strengths: cost of living A+, health & safety A+, crime A-; Watch: amenities F, commute F, employment F.
- Caroline County Public Schools (rural): math 13% / reading 29% proficiency, ranked #17 of 24 in MD (top 71%) — low school quality limits family demand, transient renter base, plan for 1-2y turnover.
- Zoned schools: North Caroline High School (math 39% / reading 61%, grade D+, #106 of 222 statewide, top 48%, 1,226 students, 59% FRL).
- Zoned-school proficiency averages 50% at this address vs 21% district-wide (+29 pts) — the actual schools serving this property are materially stronger than the Caroline County Public Schools average implies; a family-tenant draw the district grade alone would hide.
- Market conditions: 40 active listings in the ZIP; 59 units permitted in Caroline County in 2024 (0 in 5+ unit buildings).
Forward outlook
- In year one you build about $12k of equity ($1k loan paydown + $11k appreciation (5.4% local appreciation)).
- Caroline County population projected at -19% by 2050 — secular population decline; favor cash flow + early exit over multi-decade hold.
- At projected returns (5.4% appreciation + 3.0% rent growth), your $55k cash investment doubles in ~4 years — after that, you're playing with house money.
- By year 4, paydown + projected appreciation supports a ~$40k cash-out refi (75% LTV) — recoverable capital for the next deal without selling this one.
Negotiation context
- It's been on market 26 days — a 2% lower offer ($192k) is reasonable based on typical stale-listing flexibility.
- 6 sale attempts since 18y ago with the ask held roughly flat each time — persistent listings suggest the price (not the market) is what's stuck; bring a comps-based counter.
- Current owner paid $95k; list at $195k implies a 105% gain — meaningful room to come down on a strong offer.
Risks & watch-outs
- Watch-outs: built in 1914 — expect roof / HVAC / electrical / plumbing capex.
Questions for the listing agent
- Built in 1914 — when were the roof, HVAC, electrical panel, plumbing, and water heater last replaced?
- Is there a deadline driving the sale (1031 exchange, divorce, estate, relocation)? That informs how much negotiation room exists.
- Schools are D-rated, which usually means shorter tenancies and higher turnover. Who's the typical renter profile here, and what's been the actual vacancy rate?
- What's the average days-on-market for RENTAL listings here right now (not sales)? A rising rental-DOM trend means longer vacancies and softer asking-rent achievability than the comps imply.
- What's the recent tenant-quality profile in this submarket — average credit score on applications, eviction rate, late-payment / NSF rate, and stable-employment percentage? A property-management company in the area should have these aggregated.
- How much new for-sale + rental construction is in the pipeline within 1–3 miles? Heavy new supply typically softens prices + rents 12–24 months out; constrained supply supports both.
Investment metrics
- 1% rule
- 1.11% ✓
- Cap rate
- 7.83%
- Cash-on-cash
- 5.49%
- DSCR
- 1.24
- GRM
- 7.5
CMA / ARV
- ARV (on-the-fly)
- $88,068
- Comps found
- 1
Show comp detail 1 sale within ~0.75 mi
| Address | Dist | Beds/Ba | Sqft | Sold | Price | $/sf | Match |
|---|---|---|---|---|---|---|---|
| 406 N Main St | 0.40mi | 5/2.0 (-1) | 2,012 (-6%) | 24mo | $82,500 | $41 | 42 |
Match score weights: distance 35% · size 25% · config 20% · recency 20%. Top-matched comps best support the ARV.
Projected returns pro-forma
5.43% appreciation · 3.0% rent growth · sell at horizon
- IRR
- 18.6%
- Equity multiple
- 2.20×
- Total profit
- $65,712
- Equity at exit
- $115,578
- IRR
- 18.4%
- Equity multiple
- 4.35×
- Total profit
- $183,013
- Equity at exit
- $203,800
Cash invested: $54,600 (down + closing). Projections, not guarantees.
Landlord ↔ Tenant lean methodology
- Overall (STATE)
- 27 Tenant-Leaning
- State Maryland
- 27 Tenant-Leaning · D+14
- County
- — inherits STATE
- City
- — inherits STATE
ZIP-level market 21639
- Home prices YoY
- 1.7%
- Active inventory
- 40
- Price-to-rent
- 7.5×
Monthly cashflow live
- Estimated rent
- $2,160 medium interval (Pro) →
- Mortgage (P&I)
- −$1,023
- Tax from tax record
- −$353 /mo · $4,233/yr
- Insurance
- −$81
- HOA
- −$0
- Vacancy / Maint / Mgmt
- −$454
- Net cashflow
- $250
Break-even live
UW: 25.0% down · 7.5% · 30yr · 1.5% tax · 5.0% vac · 8.0% maint · 8.0% mgmt
Financing live
Cash to close
- Down payment
- $48,750
- Closing costs
- $5,850
- Reserves months
- —
- Total cash needed
- —
Loan-product check · same deal, 3 products live
Conventional
25% down · 7.5% · 30yr
- Down + closing
- —
- Monthly P&I
- —
- Monthly cashflow
- —
- DSCR
- —
- Eligible?
- —
Personal DTI + credit; lowest rate.
DSCR
20% down · 8.5% · 30yr
- Down + closing
- —
- Monthly P&I
- —
- Monthly cashflow
- —
- DSCR
- —
- Eligible?
- —
No personal income docs; deal must DSCR.
Hard money
10% down · 12.0% · 12mo
- Down + closing
- —
- Monthly P&I
- —
- Monthly cashflow
- —
- DSCR
- —
- Eligible?
- —
Short-term bridge; refi at stabilization.
Listing history 22 events
-
2026-03-19status Pending
-
2026-02-23status Active
-
2026-02-16historical
-
2026-02-16$195,000 Active
-
2026-02-13historical $195,000
-
2024-03-15historical
-
2024-03-15$235,000 Active
-
2024-03-01historical
-
2016-11-29historical Withdrawn
-
2016-11-29historical
-
2016-10-13Active
-
2016-10-13$149,500
-
2009-01-15soldstatus $95,000
-
2009-01-12soldstatus $95,000 Sold
-
2009-01-05historical
-
2008-12-30price $99,000
-
2008-12-05price $115,000
-
2008-11-12price $119,900
-
2008-09-02price $165,000
-
2008-08-05price $170,000
-
2008-07-15$181,900
-
1993-06-18soldstatus $70,000
ⓘ Source: listings_history table (triggers on properties + properties_extension) + one-shot
backfill from property_details.listing_events for pre-trigger history.
Tax reassessment forecast MD · Partial reset (capped growth)
- Current annual tax
- $4,233 · $353/mo
- Projected year-2 tax
- $4,233 · $353/mo
- Expected delta
- $0/yr ($0/mo · 0.0%)
ⓘ Screening estimate from a state-policy table — verify with the county assessor before closing.
Climate risk First Street
- Flood 1/10 Low FEMA zone X (unshaded) · 0% chance over 30 yrs
- Wildfire 1/10 Low
- Heat 8/10 Severe 7 d/yr ≥104°F today · 15 d/yr by 30 yrs out
- Wind 6/10 Major 41% chance of damaging wind over 30 yrs
- Air quality 2/10 Low 2 unhealthy d/yr today · 2 by 30 yrs out
Nearby sold comps map
Loading sold comps map…
Walkable amenities ~0.75 mi
Loading nearby amenities…
Taxation est. · year 1
- Rental income
- $25,917
- − Mortgage interest
- −$10,923
- − Property taxes
- −$4,233
- − Insurance
- −$975
- − Repairs & maintenance
- −$2,073
- − Management
- −$2,073
- − Depreciation
- −$5,673
- Taxable loss
- −$33
- Est. tax savings @ 24.0%
- +$8
- After-tax cash flow
- $3,003/yr
For passive investors: Depreciation is non-cash, so a rental often shows a tax loss while cash-flowing — sheltering income. Rental losses are passive: they offset passive income freely, and up to $25,000/yr can offset ordinary (W-2) income if you actively participate and your MAGI is under $100k (phasing out to $0 by $150k); unused losses carry forward. On sale, claimed depreciation is recaptured at up to 25%, and gains may owe capital-gains tax (a 1031 exchange can defer both). Figures are a year-1 estimate at your 24.0% rate — not tax advice; consult a CPA.
Schools (NCES district)
- District
- Caroline County Public Schools
- NCES district ID
- 2400180
- Math proficiency
- 13% ▼ -22.00%
- Reading proficiency
- 29% ▼ -14.00%
- Median HH income
- $55,076
- Composite
- 19.16/100
- National rank
- #8823
- State rank
- #17 of 24 in MD
Livability — Greensboro
- Score
- 68/100
- State rank
- #202
- US rank
- #9657
Category grades
Schools grade is shown separately in the Schools card above.
Census & demographics
- Census place
- Greensboro, MD
- Population (ZIP)
- 4,621
Population outlook (Caroline County) Hauer SSP2
- Today (2025)
- 31,205 people
- By 2030
- 30,204 · -3.2%
- By 2040
- 27,866 · -10.7%
- By 2050
- 25,342 · -18.8%
- By 2075
- 20,554 · -34.1%
- By 2100
- 17,415 · -44.2%
Race, ethnicity, and origin ACS 2023
- Neighborhood character
- Predominantly White (71%)
- Race & ethnicity
- White 71% Hispanic / Latino 19% Two or more races 11% Black 9% Native American 4%
- Hispanic origin (detail)
- Mexican 4% Puerto Rican 2%
- Common ancestry
- Lithuanian 5% Slovak 3% Iranian 2%
- Foreign-born
- 11% · Canada
- Languages at home
- 84% English-only · Spanish 15% Other Indo-European 1%
Political lean MEDSL · Caroline
- 2024 margin
- Solid R (+38.0) · D 29.9% · R 67.9% · Other 2.2%
- 2008→2024 swing
- -15.0pp toward R · 2008: -23.0pp · 2024: -38.0pp
- All cycles
- 2024: R+38.0 2020: R+32.9 2016: R+39.5 2012: R+24.4 2008: R+23.0
Not yet ingested
- Civics
- —
Market trends
- HPI YoY
- ▲ 5.43%
- Current HPI
- 321.0192
- Rent YoY
- —
- Metro
- —
- State GDP YoY
- ▲ 2.97%
- F500 in state
- 12
Industry mix (Fortune 500 HQ in MD)
| Industry | F500 HQs | Revenue |
|---|---|---|
| Aerospace / Defense | 1 | $71B |
|
||
| Utilities | 1 | $25B |
|
||
| Hotels | 1 | $24B |
|
||
| Consumer Goods | 1 | $7B |
|
||
| Real Estate | 1 | $6B |
|
||
| Chemicals | 1 | $2B |
|
||
Price history
+178.6% since first listed22 events — show timeline
- 2026-03-19 Pending — BRIGHT MLS
- 2026-02-23 Relisted — BRIGHT MLS
- 2026-02-16 Listing Removed — BRIGHT MLS
- 2026-02-16 Listed $195,000 BRIGHT MLS
- 2026-02-13 Coming Soon $195,000 BRIGHT MLS
- 2024-03-15 Listing Removed — BRIGHT MLS
- 2024-03-15 Listed $235,000 BRIGHT MLS
- 2024-03-01 Coming Soon — BRIGHT MLS
- 2016-11-29 Listing Removed — BRIGHT MLS
- 2016-11-29 Delisted — MRIS
- 2016-10-13 Listed — MRIS
- 2016-10-13 Listed $149,500 BRIGHT MLS
- 2009-01-15 Sold (Public Records) $95,000 Public Records
- 2009-01-12 Sold (MLS) $95,000 MRIS
- 2009-01-05 Delisted — MRIS
- 2008-12-30 Price Changed $99,000 MRIS
- 2008-12-05 Price Changed $115,000 MRIS
- 2008-11-12 Price Changed $119,900 MRIS
- 2008-09-02 Price Changed $165,000 MRIS
- 2008-08-05 Price Changed $170,000 MRIS
- 2008-07-15 Listed $181,900 MRIS
- 1993-06-18 Sold (Public Records) $70,000 Public Records
Property tax history
+5.7%/yrLatest (2025): $4,233 · +5.1% YoY. Source: county tax records.
Cash-flow waterfall
monthlySold comps — $/sqft
last 12 mo · ≤1 miLoading sold comps…