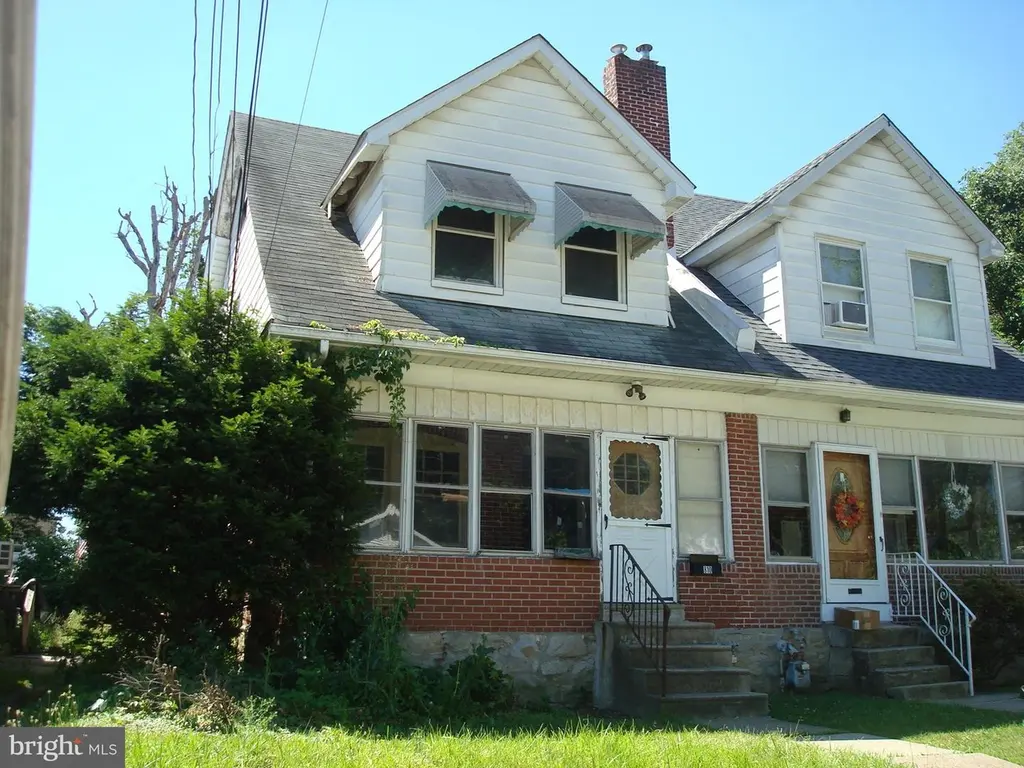
810 Bartram Ave · Collingdale, PA
Flood risk 7/10 · Major
- FEMA flood zone
- X (unshaded)
- Chance of flooding over 30 yrs
- 0.95%
- Est. flood insurance / yr
- $473 – $860
Fire risk 1/10 · Minimal
- Est. fire insurance / yr
- $511 – $949
Heat risk 6/10 · Moderate
- Hot days now (above 103°F)
- 7 days/yr
- Hot days in 30 yrs
- 15 days/yr
Wind risk 6/10 · Moderate
- Chance of severe wind over 30 yrs
- 27.0%
Air-quality risk 4/10 · Minor
- Unhealthy air days now
- 3 days/yr
- Unhealthy air days in 30 yrs
- 6 days/yr
Risk factors via First Street. Map © Google.
Why this score? — see what drove the B- grade
The composite is a weighted blend of 9 inputs, each scored 0–100. Each bar is that input's sub-score; the figure is the points it added to the 100-point composite (weight × sub-score).
- Cash flow +28.1/30.0
- DSCR +10.0/10.0
- 1% rule +9.7/10.0
- ARV discount +7.5/15.0
- Rent growth +5.0/5.0
- Livability +4.2/5.0
- Condition / age +2.5/5.0
- Schools +2.0/10.0
- Appreciation +0.0/10.0
$128,500
🖨 Deal sheet 📄 Offer letter ✓ Due diligence
Listing remarks
Built in 1955, with Renovation this will be a Sweet house!! Enclosed front porch increases the Living space. Nice floor plan, wood floors that will be beautiful with refinishing. This house is being sold AS IS. No repairs will be made by the Estate. Conditional U & O will allow Buyer to Settle. New Owner will need to obtain U & O once repairs have been made. Once the house is cleared out, showings will start.
Key facts
- Built 1955
- Listed 2 days
Property features AI
Finance
- Other: Lot dimensions approximately 25 x 100
- Financial info: Fee simple ownership
Exterior
- Parking: On-street parking
- Utilities: Public water; Public sewer; Electric available; Natural gas available; Sewer available; Water available
- Home design: Detached property; North-facing main entrance; Pitched shingle roof
- Construction: Frame and masonry construction; Block foundation; Building winterized; Major rehab needed
- Exterior features: Middle-of-block location; Municipal trash service
Interior
- Bedrooms: Three bedrooms on the first upper level
- Flooring: Wood flooring
- Bathrooms: One full bathroom
- Heating & cooling: Forced air heating; Natural gas hot water
- Interior features: Plaster walls; Not furnished
- Laundry & utility: Laundry in the basement
Neighborhood map
What this means for you Summary
Snapshot
- This is a 3-bed/1.0-bath single-family listed at $128k.
Deal economics
- At list price, monthly cash flow is $349 ($4k/yr) — positive.
- The deal already cash-flows at list — no discount required.
- Meets the 1% rule at list price ($2k rent vs $128k).
- Cap rate 10.1% vs local median 6.0% in Collingdale — top-decile yield for the area; either an underpriced asset or a hidden risk that comps aren't pricing in. Stress-test before assuming the spread holds.
Location & tenants
- Location reads 84/100 on livability (#105 in PA, #781 nationally) — a professional / high-income tenant draw. Strengths: commute A+, cost of living A+, housing A+; Watch: employment C-, amenities D.
- Southeast Delco SD (suburban): math 13% / reading 33% proficiency, ranked #478 of 539 in PA (top 89%) — low school quality limits family demand, transient renter base, plan for 1-2y turnover; 63% free/reduced lunch — lower-income household profile, screen leases tightly.
- Market conditions: Rents rising fast (+13.1%/yr); 99 active listings in the ZIP; 40 comparable units currently listed for rent nearby; rentals at typical pace (median 25d on market — plan ~3-4 weeks tenant-placement turnaround); 299 units permitted in Delaware County in 2024 (5 in 5+ unit buildings).
- At $1,888/mo this rent would consume 49% of the median local household income ($46k/yr) (locally 1468% of renters already pay >50% of income on rent) — very limited rent-growth headroom before tenants either downsize or default.
Forward outlook
- Local home prices are declining (-3.0%/yr); year-one equity from $888 of loan paydown is wiped out by about $4k of value loss. Plan a longer hold.
- At projected returns (-3.0% appreciation + 8.0% rent growth), your $36k cash investment doubles in ~7 years — after that, you're playing with house money.
Negotiation context
- Only 2 days on market — expect competitive offers; lowballing is unlikely to land.
Risks & watch-outs
- Watch-outs: property tax is 3.4% of price; flood insurance adds $56/mo; built in 1955 — expect roof / HVAC / electrical / plumbing capex.
- Climate carrying-cost: major flood risk; major wind risk, 27% chance of damaging wind over 30y; extreme-heat days projected 7→15/yr by 2055 (HVAC capex compounding) — expect insurance premiums to compound above CPI over the hold.
Questions for the listing agent
- Built in 1955 — when were the roof, HVAC, electrical panel, plumbing, and water heater last replaced?
- Property tax is high relative to price — has the assessment been appealed recently, and will the sale trigger a re-assessment?
- What's the actual annual flood-insurance premium (NFIP or private), and is the property in a SFHA with mandatory coverage?
- Is there a deadline driving the sale (1031 exchange, divorce, estate, relocation)? That informs how much negotiation room exists.
- What's the average days-on-market for RENTAL listings here right now (not sales)? A rising rental-DOM trend means longer vacancies and softer asking-rent achievability than the comps imply.
- What's the recent tenant-quality profile in this submarket — average credit score on applications, eviction rate, late-payment / NSF rate, and stable-employment percentage? A property-management company in the area should have these aggregated.
- How much new for-sale + rental construction is in the pipeline within 1–3 miles? Heavy new supply typically softens prices + rents 12–24 months out; constrained supply supports both.
Investment metrics
- 1% rule
- 1.47% ✓
- Cap rate
- 10.07%
- Cash-on-cash
- 13.50%
- DSCR
- 1.60
- GRM
- 5.7
CMA / ARV
- ARV (on-the-fly)
- $261,936
- Comps found
- 12
Show comp detail 12 sales within ~0.75 mi
| Address | Dist | Beds/Ba | Sqft | Sold | Price | $/sf | Match |
|---|---|---|---|---|---|---|---|
| 49 S Woodlawn Ave | 0.44mi | 3/1.5 | 1,224 (0%) | 11mo | $190,000 | $155 | 68 |
| 230 Felton | 0.34mi | 3/1.5 | 1,288 (+5%) | 6mo | $275,000 | $214 | 68 |
| 1025 Bartram Ave | 0.21mi | 3/1.0 | 1,334 (+9%) | 12mo | $232,000 | $174 | 65 |
| 1177 Broad St | 0.45mi | 2/1.0 (-1) | 1,215 (-1%) | 11mo | $220,000 | $181 | 63 |
| 811 Springfield Rd | 0.67mi | 3/2.0 | 1,218 (-0%) | 1mo | $190,000 | $156 | 63 |
| 1190 Clifton Ave | 0.27mi | 2/1.0 (-1) | 1,159 (-5%) | 13mo | $207,000 | $179 | 63 |
| 515 Beechwood | 0.34mi | 3/2.0 | 1,172 (-4%) | 14mo | $275,000 | $235 | 61 |
| 55 Beech Ave | 0.57mi | 3/2.0 | 1,248 (+2%) | 13mo | $315,000 | $252 | 55 |
| 806 W Penn Pines Blvd | 0.69mi | 4/1.0 (+1) | 1,270 (+4%) | 2mo | $278,000 | $219 | 55 |
| 101 S Glenwood Ave | 0.37mi | 3/2.0 | 1,375 (+12%) | 4mo | $350,000 | $255 | 55 |
| 501 W Rively Ave | 0.54mi | 3/1.5 | 1,092 (-11%) | 8mo | $325,000 | $298 | 48 |
| 113 S Sycamore Ave | 0.44mi | 2/2.0 (-1) | 1,323 (+8%) | 16mo | $275,000 | $208 | 43 |
Match score weights: distance 35% · size 25% · config 20% · recency 20%. Top-matched comps best support the ARV.
Projected returns pro-forma
-3.0% appreciation · 8.0% rent growth · sell at horizon
- IRR
- 7.7%
- Equity multiple
- 1.32×
- Total profit
- $11,583
- Equity at exit
- $19,160
- IRR
- 21.6%
- Equity multiple
- 3.36×
- Total profit
- $84,895
- Equity at exit
- $11,110
Cash invested: $35,980 (down + closing). Projections, not guarantees.
Landlord ↔ Tenant lean methodology
- Overall (STATE)
- 62 Landlord-Friendly
- State Pennsylvania
- 62 Landlord-Friendly · EVEN
- County
- — inherits STATE
- City
- — inherits STATE
ZIP-level market 19023
- Rents YoY
- 13.1%
- Active inventory
- 99
- Price-to-rent
- 5.7×
Monthly cashflow live
- Estimated rent
- $1,888 high interval (Pro) →
- Mortgage (P&I)
- −$674
- Tax from tax record
- −$360 /mo · $4,315/yr
- Insurance
- −$54
- Flood insurance flood zone
- −$56 /mo · $666/yr
- HOA
- −$0
- Vacancy / Maint / Mgmt
- −$397
- Net cashflow
- $349
Break-even live
UW: 25.0% down · 7.5% · 30yr · 1.5% tax · 5.0% vac · 8.0% maint · 8.0% mgmt
Financing live
Cash to close
- Down payment
- $32,125
- Closing costs
- $3,855
- Reserves months
- —
- Total cash needed
- —
Loan-product check · same deal, 3 products live
Conventional
25% down · 7.5% · 30yr
- Down + closing
- —
- Monthly P&I
- —
- Monthly cashflow
- —
- DSCR
- —
- Eligible?
- —
Personal DTI + credit; lowest rate.
DSCR
20% down · 8.5% · 30yr
- Down + closing
- —
- Monthly P&I
- —
- Monthly cashflow
- —
- DSCR
- —
- Eligible?
- —
No personal income docs; deal must DSCR.
Hard money
10% down · 12.0% · 12mo
- Down + closing
- —
- Monthly P&I
- —
- Monthly cashflow
- —
- DSCR
- —
- Eligible?
- —
Short-term bridge; refi at stabilization.
Rent comps 40 comps
| Address | Beds | Baths | Sqft | Rent | $/sqft | DOM | Units | Dist |
|---|---|---|---|---|---|---|---|---|
| 304 Pine St Glenolden, PA | 3.0 | 2.0 | 1120 | $2,400 | $2.14 | 43d | 1 | 0.42mi |
| 306 Pine St Glenolden, PA | 3.0 | 2.0 | 1120 | $2,400 | $2.14 | 4d | 1 | 0.42mi |
| 112 Juliana Ter Darby, PA | 3.0 | 1.0 | 1020 | $2,450 | $2.40 | 24d | 1 | 0.42mi |
| 112 Juliana Ter Darby, PA | 3.0 | 1.0 | 1020 | $2,350 | $2.30 | 44d | 1 | 0.42mi |
| 118 Felton Ave Darby, PA | 3.0 | 1.0 | 1152 | $1,750 | $1.52 | 22d | 1 | 0.43mi |
| 1201 Bartram Ave Darby, PA | 2.0 | 1.0 | 700 | $1,350 | $1.93 | 11d | 1 | 0.45mi |
| 100 S Oak Ave Glenolden, PA | 1.0–2.0 | 1.0–2.0 | 830 | $1,500 | $1.81 | 24d | 3 | 0.65mi |
| 66 Folcroft Ave Folcroft, PA | 3.0 | 1.0 | 1224 | $1,895 | $1.55 | 3d | 1 | 0.66mi |
| 2 Winthrop Rd Darby, PA | 3.0 | 1.5 | 1224 | $1,900 | $1.55 | 22d | 1 | 0.74mi |
| 1074 N Academy Ave Glenolden, PA | 3.0 | 1.0 | 1152 | $1,850 | $1.61 | 5d | 1 | 0.80mi |
| 132 Folcroft Ave Folcroft, PA | 2.0 | 1.0 | 725 | $1,679 | $2.32 | 2d | 3 | 0.81mi |
| 902 Maple Ave Glenolden, PA | 3.0 | 1.0 | 1152 | $1,745 | $1.51 | 43d | 1 | 0.84mi |
| 925 Maple Ave Glenolden, PA | 3.0 | 2.0 | 1152 | $2,800 | $2.43 | 22d | 1 | 0.87mi |
| 1 Jefferson St Unit 413D Clifton Heights, PA | 3.0 | 1.0 | 800 | $1,529 | $1.91 | 43d | 1 | 0.96mi |
| 926 Green Ln Secane, PA | 2.0 | 1.0 | 862 | $2,185 | $2.53 | 43d | 1 | 0.96mi |
| 137 W Maryland Ave Unit 2nd Flr Aldan, PA | 2.0 | 1.0 | 800 | $1,400 | $1.75 | 5d | 1 | 1.00mi |
| 909 Springfield Rd Unit D Darby, PA | 4.0 | 1.0 | 900 | $1,600 | $1.78 | 43d | 1 | 1.01mi |
| 1300 Main St Unit Basement Darby, PA | 2.0 | 1.0 | 800 | $1,450 | $1.81 | 11d | 1 | 1.02mi |
| 1300 Main St Unit Basement Darby, PA | 2.0 | 1.0 | 1000 | $1,450 | $1.45 | 24d | 1 | 1.02mi |
| 1512 Elmwood Ave Folcroft, PA | 2.0 | 1.0 | 850 | $1,499 | $1.76 | 24d | 1 | 1.02mi |
| 1505 Elmwood Ave Unit 5 Folcroft, PA | 2.0 | 1.0 | 850 | $1,499 | $1.76 | 24d | 1 | 1.04mi |
| 1503 Elmwood Ave Folcroft, PA | 3.0 | 1.0 | 1025 | $1,699 | $1.66 | 24d | 1 | 1.04mi |
| 1503 Elmwood Ave Folcroft, PA | 3.0 | 1.0 | 850 | $1,799 | $2.12 | 43d | 1 | 1.04mi |
| 1513 Elmwood Ave Unit 4 Folcroft, PA | 3.0 | 1.0 | 1025 | $1,699 | $1.66 | 24d | 1 | 1.04mi |
| 1513 Elmwood Ave Unit 5 Folcroft, PA | 3.0 | 1.0 | 850 | $1,799 | $2.12 | 43d | 1 | 1.04mi |
| 201 Westbridge Rd Glenolden, PA | 3.0 | 1.5 | 1224 | $2,350 | $1.92 | 24d | 1 | 1.05mi |
| 1511 Elmwood Ave Folcroft, PA | 1.0–3.0 | 1.0 | 725 | $1,649 | $2.27 | 24d | 3 | 1.05mi |
| 145 Isabel Ave Unit 145B Glenolden, PA | 2.0 | 1.0 | 890 | $1,525 | $1.71 | 43d | 1 | 1.05mi |
| 96 E Berkley Ave Clifton Heights, PA | 2.0 | 1.5 | 1352 | $1,850 | $1.37 | 18d | 1 | 1.05mi |
| 601 Poplar St Sharon Hill, PA | 1.0–2.0 | 1.0 | 787 | $1,599 | $2.03 | 15d | 5 | 1.06mi |
| 319 S Church St Clifton Heights, PA | 3.0 | 1.0 | 1152 | $1,900 | $1.65 | 43d | 1 | 1.07mi |
| 209 Hamilton Ave Darby, PA | 4.0 | 1.0 | 1400 | $1,595 | $1.14 | 15d | 1 | 1.08mi |
| 60 W Broadway Ave Clifton Heights, PA | 3.0 | 1.0 | 1160 | $2,200 | $1.90 | 43d | 1 | 1.12mi |
| 216 Borough Rd Unit A Primos, PA | 2.0 | 2.0 | 800 | $1,500 | $1.88 | 24d | 1 | 1.13mi |
| 37 Concord Rd Darby, PA | 3.0 | 1.0 | 1120 | $1,795 | $1.60 | 43d | 1 | 1.13mi |
| 304 Christopher Pl Unit 1st Floor Primos, PA | 2.0 | 1.0 | 875 | $1,400 | $1.60 | 3d | 1 | 1.14mi |
| 29 Logan Ave Unit 11 Glenolden, PA | 2.0 | 1.0 | 850 | $1,350 | $1.59 | 24d | 1 | 1.15mi |
| 312 E Baltimore Ave Clifton Heights, PA | 1.0–2.0 | 1.0 | 812 | $1,649 | $2.03 | 2d | 3 | 1.21mi |
| 426 S Springfield Rd Clifton Heights, PA | 1.0–2.0 | 1.0 | 775 | $1,599 | $2.06 | 24d | 1 | 1.24mi |
| 216 W Washington Ave Clifton Heights, PA | 3.0 | 1.5 | 1152 | $1,875 | $1.63 | 4d | 1 | 1.24mi |
Listing history 10 events
-
2026-06-18days on market $128,500 Active 2 DOM
-
2026-06-17statusdays on market $128,500 Active 1 DOM
-
2026-06-16days on market $128,500 Coming Soon 11 DOM
-
2026-06-15days on market $128,500 Coming Soon 10 DOM
-
2026-06-13days on market $128,500 Coming Soon 8 DOM
-
2026-06-13days on market $128,500 Coming Soon 7 DOM
-
2026-06-09days on market $128,500 Coming Soon 4 DOM
-
2026-06-08days on market $128,500 Coming Soon 3 DOM
-
2026-06-07remarks 412-char remark
-
2026-06-07$128,500 Coming Soon 2 DOM
ⓘ Source: listings_history table (triggers on properties + properties_extension) + one-shot
backfill from property_details.listing_events for pre-trigger history.
Tax reassessment forecast PA · Partial reset (capped growth)
- Current annual tax
- $4,315 · $360/mo
- Projected year-2 tax
- $4,315 · $360/mo
- Expected delta
- $0/yr ($0/mo · 0.0%)
ⓘ Screening estimate from a state-policy table — verify with the county assessor before closing.
Climate risk First Street
- Flood 7/10 Severe FEMA zone X (unshaded) · 95% chance over 30 yrs
- Wildfire 1/10 Low
- Heat 6/10 Major 7 d/yr ≥103°F today · 15 d/yr by 30 yrs out
- Wind 6/10 Major 27% chance of damaging wind over 30 yrs
- Air quality 4/10 Moderate 3 unhealthy d/yr today · 6 by 30 yrs out
Nearby sold comps map
Loading sold comps map…
Walkable amenities ~0.75 mi
Loading nearby amenities…
Taxation est. · year 1
- Rental income
- $22,659
- − Mortgage interest
- −$7,198
- − Property taxes
- −$4,315
- − Insurance
- −$1,309
- − Repairs & maintenance
- −$1,813
- − Management
- −$1,813
- − Depreciation
- −$3,738
- Taxable income
- $2,474
- Est. tax owed @ 24.0%
- −$594
- After-tax cash flow
- $3,597/yr
For passive investors: Depreciation is non-cash, so a rental often shows a tax loss while cash-flowing — sheltering income. Rental losses are passive: they offset passive income freely, and up to $25,000/yr can offset ordinary (W-2) income if you actively participate and your MAGI is under $100k (phasing out to $0 by $150k); unused losses carry forward. On sale, claimed depreciation is recaptured at up to 25%, and gains may owe capital-gains tax (a 1031 exchange can defer both). Figures are a year-1 estimate at your 24.0% rate — not tax advice; consult a CPA.
Schools (NCES district)
- District
- Southeast Delco SD
- NCES district ID
- 4222400
- Math proficiency
- 13% ▼ -8.00%
- Reading proficiency
- 33% ▼ -9.00%
- Median HH income
- $49,309
- Composite
- 20.25/100
- National rank
- #8623
- State rank
- #478 of 539 in PA
Livability — Collingdale
- Score
- 84/100
- State rank
- #105
- US rank
- #781
Category grades
Schools grade is shown separately in the Schools card above.
Census & demographics
- Census place
- Collingdale, PA
- County
- Delaware County · 399,863 people
- City population
- 22,247
- Metro
- Philadelphia-Camden-Wilmington, PA-NJ-DE-MD
- Population (ZIP)
- 22,247
- Household income
- $46,463
- Rent vs Own
- Severe rent burden
- 1468.0
Population outlook (Delaware County) Hauer SSP2
- Today (2025)
- 577,490 people
- By 2030
- 581,243 · +0.6%
- By 2040
- 584,700 · +1.2%
- By 2050
- 586,581 · +1.6%
- By 2075
- 598,706 · +3.7%
- By 2100
- 590,823 · +2.3%
Race, ethnicity, and origin ACS 2023
- Neighborhood character
- Predominantly Black (76%)
- Race & ethnicity
- Black 76% White 15% Two or more races 5% Hispanic / Latino 3% Asian 2%
- Common ancestry
- Swiss 5% Hispanic 1% Romanian 1%
- Foreign-born
- 18% · Canada
- Languages at home
- 84% English-only · French/Haitian/Cajun 4% Spanish 3% Other Asian/Pacific 1%
Political lean MEDSL · Delaware
- 2024 margin
- Strong D (+23.7) · D 61.4% · R 37.6% · Other 1.0%
- 2008→2024 swing
- +2.3pp toward D · 2008: 21.4pp · 2024: 23.7pp
- All cycles
- 2024: D+23.7 2020: D+26.7 2016: D+22.0 2012: D+21.8 2008: D+21.4
Not yet ingested
- Civics
- —
Market trends
- HPI YoY
- ▼ -190.50%
- Current HPI
- 277.7034
- Rent YoY
- ▲ 13.10%
- Metro
- Philadelphia-Camden-Wilmington, PA-NJ-DE-MD
- State GDP YoY
- ▲ 1.68%
- F500 in state
- 34
Industry mix (Fortune 500 HQ in PA)
| Industry | F500 HQs | Revenue |
|---|---|---|
| Healthcare | 2 | $309B |
|
||
| Insurance | 2 | $27B |
|
||
| Telecommunications / Media | 1 | $124B |
|
||
| Industrial Distribution | 1 | $22B |
|
||
| Financial Services | 1 | $20B |
|
||
| Chemicals / Materials | 1 | $18B |
|
||
Price history
1 event — show timeline
- 2026-06-05 Coming Soon $128,500 BRIGHT MLS
Property tax history
+2.2%/yrLatest (2026): $4,315 · -5.9% YoY. Source: county tax records.
Cash-flow waterfall
monthlySold comps — $/sqft
last 12 mo · ≤1 miLoading sold comps…