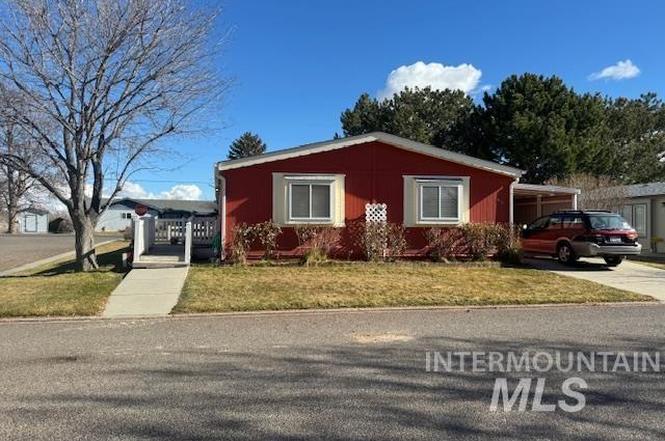
910 Moonglo #49 · Buhl, ID
Flood risk 4/10 · Minor
- FEMA flood zone
- —
- Chance of flooding over 30 yrs
- 0.22%
- Est. flood insurance / yr
- —
Fire risk 2/10 · Minimal
- Est. fire insurance / yr
- $584 – $1,086
Heat risk 4/10 · Minor
- Hot days now (above 92°F)
- 8 days/yr
- Hot days in 30 yrs
- 21 days/yr
Wind risk 1/10 · Minimal
- Chance of severe wind over 30 yrs
- —
Air-quality risk 6/10 · Moderate
- Unhealthy air days now
- 10 days/yr
- Unhealthy air days in 30 yrs
- 11 days/yr
Risk factors via First Street. Map © Google.
Why this score? — see what drove the B- grade
The composite is a weighted blend of 9 inputs, each scored 0–100. Each bar is that input's sub-score; the figure is the points it added to the 100-point composite (weight × sub-score).
- Cash flow +30.0/30.0
- 1% rule +10.0/10.0
- DSCR +10.0/10.0
- ARV discount +7.5/15.0
- Livability +3.5/5.0
- Schools +2.8/10.0
- Rent growth +2.5/5.0
- Condition / age +2.5/5.0
- Appreciation +0.0/10.0
$60,000
🖨 Deal sheet 📄 Offer letter ✓ Due diligence
Listing remarks
Step into comfort and community in this well cared for 3 bed, 2 bath home nestled with a welcoming 55+ neighborhood. Designed for easy living, the layout offers generous living space, abundant natural light, and a private primary retreat. Located just minutes from local conveniences, you will love the balance of quiet community living with quick access to town. Perfect for those ready to enjoy a simplified lifestyle without sacrificing space.
Key facts
- Parking
- Built 1985
- Listed 113 days
Property features AI
Finance
- HOA & community: Located in an over-55 community (mobile home park)
Exterior
- Parking: Covered carport space for 1 vehicle
- Utilities: Community water service; Sewer connected; Cable connected
- Home design: Mobile/manufactured home on a rented lot; Located in an over-55 community; Single-family use in a mobile home park
- Construction: Built in 1985
- Exterior features: Composition roof; Skylight(s); Automatic sprinkler system
Interior
- Kitchen: Dishwasher; Garbage disposal; Freestanding oven/range; Refrigerator; Electric water heater
- Bedrooms: Three bedrooms, all on the main level
- Flooring: Carpet; Vinyl
- Bathrooms: Two bathrooms
- Heating & cooling: Electric forced-air heating; Central air conditioning
- Interior features: Primary bedroom has a private bath; Split bedroom floorplan
- Laundry & utility: Washer/dryer hook-ups (implied by appliances and utilities)
Neighborhood map
What this means for you Summary
Snapshot
- This is a 3-bed/2.0-bath manufactured listed at $60k.
Deal economics
- At list price, monthly cash flow is $815 ($10k/yr) — positive.
- The deal already cash-flows at list — no discount required.
- Meets the 1% rule at list price ($2k rent vs $60k).
- Recommended offer: $55k (9.0% below list) — sets the bar for market timing.
- Cap rate 22.6% vs local median 2.1% in Buhl — top-decile yield for the area; either an underpriced asset or a hidden risk that comps aren't pricing in. Stress-test before assuming the spread holds.
Location & tenants
- Location reads 69/100 on livability (#66 in ID) — a middle-class / working-renter tenant base. Strengths: crime A+, cost of living A+, housing A+; Watch: health & safety C-, amenities F, commute F.
- Buhl Joint District (rural): math 29% / reading 38% proficiency, ranked #80 of 92 in ID (top 87%) — families likely to look elsewhere, expect single-tenant / working-renter base with shorter leases.
- Zoned schools: Buhl High School (math 27% / reading 37%, grade F, #119 of 169 statewide, top 73%, 360 students, 32% FRL) — zoned schools average 32% FRL vs 56% district-wide (24 pts lower); this property's tenant base skews higher-income than the district average.
- Market conditions: 115 active listings in the ZIP; 636 units permitted in Twin Falls County in 2024 (12 in 5+ unit buildings).
Forward outlook
- Local home prices are declining (-3.0%/yr); year-one equity from $415 of loan paydown is wiped out by about $2k of value loss. Plan a longer hold.
- Twin Falls County population projected at +29% by 2050 — long-run rental-demand tailwind backs the buy-and-hold thesis.
- At projected returns (-3.0% appreciation + 3.0% rent growth), your $17k cash investment doubles in ~2 years — after that, you're playing with house money.
Negotiation context
- It's been on market 113 days — a 9% lower offer ($55k) is reasonable based on typical stale-listing flexibility.
- 3 sale attempts since 18y ago; this cycle's ask has dropped $40k (40%) from the opening price — seller is motivated, your offer sets the floor, not the list.
Questions for the listing agent
- It's been on market 113 days. Have you received any prior offers? Is the seller open to a 9% concession, seller financing, or rate buy-down credit?
- Why hasn't it sold? Are there any deal-killer items the seller is aware of (foundation, flood, title, zoning, code violations)?
- Is there a deadline driving the sale (1031 exchange, divorce, estate, relocation)? That informs how much negotiation room exists.
- Schools are D-rated, which usually means shorter tenancies and higher turnover. Who's the typical renter profile here, and what's been the actual vacancy rate?
- What's the average days-on-market for RENTAL listings here right now (not sales)? A rising rental-DOM trend means longer vacancies and softer asking-rent achievability than the comps imply.
- What's the recent tenant-quality profile in this submarket — average credit score on applications, eviction rate, late-payment / NSF rate, and stable-employment percentage? A property-management company in the area should have these aggregated.
- How much new for-sale + rental construction is in the pipeline within 1–3 miles? Heavy new supply typically softens prices + rents 12–24 months out; constrained supply supports both.
Investment metrics
- 1% rule
- 2.59% ✓
- Cap rate
- 22.59%
- Cash-on-cash
- 58.22%
- DSCR
- 3.59
- GRM
- 3.2
CMA / ARV
- ARV (on-the-fly)
- $171,990
- Comps found
- 4
Show comp detail 4 sales within ~0.75 mi
| Address | Dist | Beds/Ba | Sqft | Sold | Price | $/sf | Match |
|---|---|---|---|---|---|---|---|
| 910 Moonglo Rd #14 | 0.20mi | 3/2.0 | 1,404 (+6%) | 2mo | $162,500 | $116 | 79 |
| 910 Moonglo Rd #57 | 0.20mi | 3/2.0 | 1,296 (-2%) | 14mo | $195,000 | $150 | 76 |
| 910 Moonglo #18 | 0.20mi | 3/2.0 | 1,350 (+2%) | 19mo | $175,000 | $130 | 72 |
| 910 Moonglo Rd #88 | 0.19mi | 2/2.0 (-1) | 1,491 (+13%) | 11mo | $134,900 | $90 | 56 |
Match score weights: distance 35% · size 25% · config 20% · recency 20%. Top-matched comps best support the ARV.
Projected returns pro-forma
-3.0% appreciation · 3.0% rent growth · sell at horizon
- IRR
- 56.8%
- Equity multiple
- 3.51×
- Total profit
- $42,212
- Equity at exit
- $8,946
- IRR
- 61.7%
- Equity multiple
- 7.17×
- Total profit
- $103,697
- Equity at exit
- $5,188
Cash invested: $16,800 (down + closing). Projections, not guarantees.
Landlord ↔ Tenant lean methodology
- Overall (STATE)
- 91 Strongly Landlord-Friendly
- State Idaho
- 91 Strongly Landlord-Friendly · R+18
- County
- — inherits STATE
- City
- — inherits STATE
ZIP-level market 83316
- Home prices YoY
- -26.4%
- Active inventory
- 115
- Price-to-rent
- 3.2×
Monthly cashflow live
- Estimated rent
- $1,557 medium interval (Pro) →
- Mortgage (P&I)
- −$315
- Tax est. 1.5%
- −$75 /mo · $900/yr
- Insurance
- −$25
- HOA
- −$0
- Vacancy / Maint / Mgmt
- −$327
- Net cashflow
- $815
Break-even live
UW: 25.0% down · 7.5% · 30yr · 1.5% tax · 5.0% vac · 8.0% maint · 8.0% mgmt
Financing live
Cash to close
- Down payment
- $15,000
- Closing costs
- $1,800
- Reserves months
- —
- Total cash needed
- —
Loan-product check · same deal, 3 products live
Conventional
25% down · 7.5% · 30yr
- Down + closing
- —
- Monthly P&I
- —
- Monthly cashflow
- —
- DSCR
- —
- Eligible?
- —
Personal DTI + credit; lowest rate.
DSCR
20% down · 8.5% · 30yr
- Down + closing
- —
- Monthly P&I
- —
- Monthly cashflow
- —
- DSCR
- —
- Eligible?
- —
No personal income docs; deal must DSCR.
Hard money
10% down · 12.0% · 12mo
- Down + closing
- —
- Monthly P&I
- —
- Monthly cashflow
- —
- DSCR
- —
- Eligible?
- —
Short-term bridge; refi at stabilization.
Listing history 24 events
-
2026-06-18days on market $60,000 Active 113 DOM
-
2026-06-17pricedays on market $60,000 Active 112 DOM
-
2026-06-16days on market $70,000 Active 111 DOM
-
2026-06-15days on market $70,000 Active 110 DOM
-
2026-06-13days on market $70,000 Active 108 DOM
-
2026-06-12days on market $70,000 Active 107 DOM
-
2026-06-09days on market $70,000 Active 104 DOM
-
2026-06-09price $70,000 Active 103 DOM
-
2026-06-08days on market $75,000 Active 103 DOM
-
2026-06-07days on market $75,000 Active 102 DOM
-
2026-06-07days on market $75,000 Active 101 DOM
-
2026-06-04days on market $75,000 Active 98 DOM
-
2026-06-02days on market $75,000 Active 97 DOM
-
2026-06-01days on market $75,000 Active 96 DOM
-
2026-05-31days on market $75,000 Active 95 DOM
-
2026-05-31days on market $75,000 Active 94 DOM
-
2026-05-21status Pending
-
2026-04-21price $75,000
-
2026-03-28price $80,000
-
2026-03-08price $89,500
-
2026-03-05status Active
-
2026-02-23historical
-
2026-02-09$99,500 Active
-
2008-09-10$65,500
ⓘ Source: listings_history table (triggers on properties + properties_extension) + one-shot
backfill from property_details.listing_events for pre-trigger history.
Climate risk First Street
- Flood 4/10 Moderate 22% chance over 30 yrs
- Wildfire 2/10 Low
- Heat 4/10 Moderate 8 d/yr ≥92°F today · 21 d/yr by 30 yrs out
- Wind 1/10 Low
- Air quality 6/10 Major 10 unhealthy d/yr today · 11 by 30 yrs out
Nearby sold comps map
Loading sold comps map…
Walkable amenities ~0.75 mi
Loading nearby amenities…
Taxation est. · year 1
- Rental income
- $18,679
- − Mortgage interest
- −$3,361
- − Property taxes
- −$900
- − Insurance
- −$300
- − Repairs & maintenance
- −$1,494
- − Management
- −$1,494
- − Depreciation
- −$1,745
- Taxable income
- $9,384
- Est. tax owed @ 24.0%
- −$2,252
- After-tax cash flow
- $7,528/yr
For passive investors: Depreciation is non-cash, so a rental often shows a tax loss while cash-flowing — sheltering income. Rental losses are passive: they offset passive income freely, and up to $25,000/yr can offset ordinary (W-2) income if you actively participate and your MAGI is under $100k (phasing out to $0 by $150k); unused losses carry forward. On sale, claimed depreciation is recaptured at up to 25%, and gains may owe capital-gains tax (a 1031 exchange can defer both). Figures are a year-1 estimate at your 24.0% rate — not tax advice; consult a CPA.
Schools (NCES district)
- District
- Buhl Joint District
- NCES district ID
- 1600480
- Math proficiency
- 29% ▼ -1.00%
- Reading proficiency
- 38% ▼ -1.00%
- Median HH income
- $39,830
- Composite
- 28.1/100
- National rank
- #6826
- State rank
- #80 of 92 in ID
Livability — Buhl
- Score
- 69/100
- State rank
- #66
- US rank
- #8278
Category grades
Schools grade is shown separately in the Schools card above.
Census & demographics
- Census place
- Buhl, ID
- Population (ZIP)
- 10,075
Population outlook (Twin Falls County) Hauer SSP2
- Today (2025)
- 92,642 people
- By 2030
- 97,900 · +5.7%
- By 2040
- 108,553 · +17.2%
- By 2050
- 119,443 · +28.9%
- By 2075
- 146,906 · +58.6%
- By 2100
- 168,212 · +81.6%
Race, ethnicity, and origin ACS 2023
- Neighborhood character
- Predominantly White (78%)
- Race & ethnicity
- White 78% Hispanic / Latino 18% Two or more races 8%
- Hispanic origin (detail)
- Mexican 16%
- Common ancestry
- Italian 4% Iranian 4% Russian 2%
- Foreign-born
- 9% · Canada
- Languages at home
- 86% English-only · Spanish 14%
Political lean MEDSL · Twin Falls
- 2024 margin
- Solid R (+48.8) · D 24.2% · R 73.1% · Other 2.7%
- 2008→2024 swing
- -12.1pp toward R · 2008: -36.7pp · 2024: -48.8pp
- All cycles
- 2024: R+48.8 2020: R+45.0 2016: R+44.6 2012: R+43.5 2008: R+36.7
Not yet ingested
- Civics
- —
Market trends
- HPI YoY
- ▼ -107.32%
- Current HPI
- 298.5092
- Rent YoY
- —
- Metro
- —
- State GDP YoY
- ▲ 4.51%
- F500 in state
- 6
Industry mix (Fortune 500 HQ in ID)
| Industry | F500 HQs | Revenue |
|---|---|---|
| Retail | 1 | $79B |
|
||
| Technology | 1 | $25B |
|
||
| Food / Agriculture | 1 | $6B |
|
||
Price history
+14.5% since first listed8 events — show timeline
- 2026-05-21 Pending — IMLS
- 2026-04-21 Price Changed $75,000 IMLS
- 2026-03-28 Price Changed $80,000 IMLS
- 2026-03-08 Price Changed $89,500 IMLS
- 2026-03-05 Relisted — IMLS
- 2026-02-23 Listing Removed — IMLS
- 2026-02-09 Listed $99,500 IMLS
- 2008-09-10 Listed $65,500 IMLS
Cash-flow waterfall
monthlySold comps — $/sqft
last 12 mo · ≤1 miLoading sold comps…