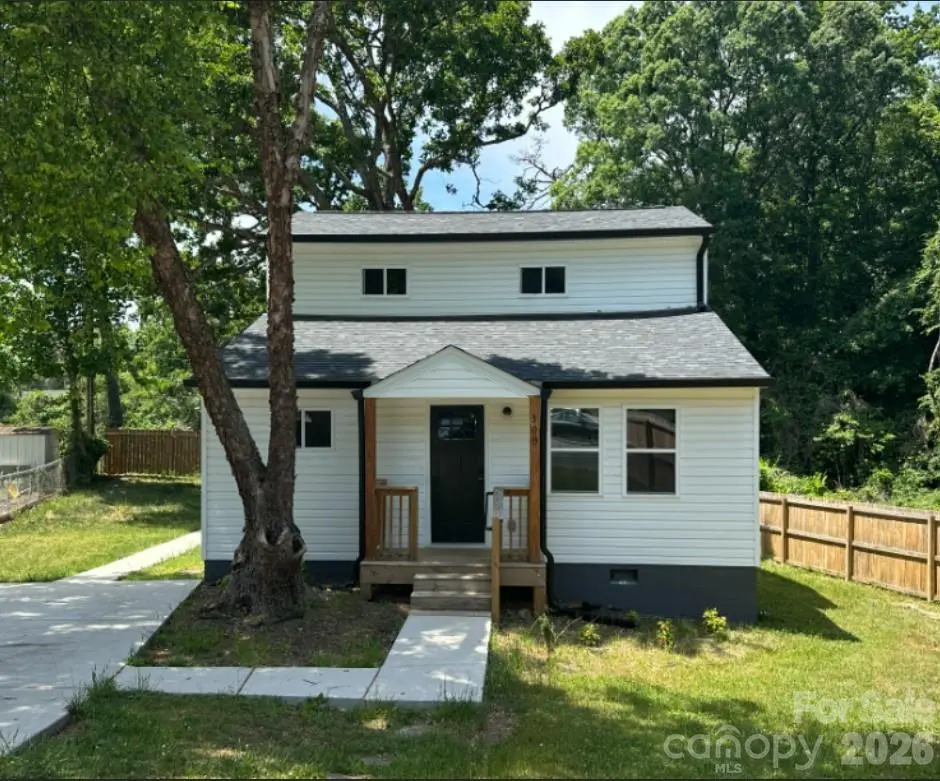
308 Alexander St · Mooresville, NC
Flood risk 1/10 · Minimal
- FEMA flood zone
- X (unshaded)
- Chance of flooding over 30 yrs
- 0.0%
- Est. flood insurance / yr
- $507 – $1,088
Fire risk 1/10 · Minimal
- Est. fire insurance / yr
- $906 – $1,684
Heat risk 5/10 · Moderate
- Hot days now (above 103°F)
- 7 days/yr
- Hot days in 30 yrs
- 15 days/yr
Wind risk 4/10 · Minor
- Chance of severe wind over 30 yrs
- 10.0%
Air-quality risk 2/10 · Minimal
- Unhealthy air days now
- 1 days/yr
- Unhealthy air days in 30 yrs
- 2 days/yr
Risk factors via First Street. Map © Google.
Why this score? — see what drove the D grade
The composite is a weighted blend of 9 inputs, each scored 0–100. Each bar is that input's sub-score; the figure is the points it added to the 100-point composite (weight × sub-score).
- ARV discount +12.4/15.0
- Cash flow +9.8/30.0
- Schools +4.6/10.0
- Livability +3.7/5.0
- Rent growth +2.9/5.0
- DSCR +2.8/10.0
- Condition / age +2.5/5.0
- 1% rule +2.4/10.0
- Appreciation +0.0/10.0
$239,000
🖨 Deal sheet 📄 Offer letter ✓ Due diligence
Listing remarks
* * * $5,000 Lender Credit when you get approved with participating lender * * * Welcome to Mooresville! This well-maintained, low-maintenance home is an excellent opportunity for first-time buyers, downsizers, or investors looking to expand their rental portfolio. Ideally located just minutes from downtown Mooresville, Mitchell Community College, shopping, dining, entertainment, and everyday conveniences, this home offers both comfort and convenience. Situated at the end of a quiet cul-de-sac, the property provides a peaceful setting with great curb appeal. Exterior features include a concrete parking pad, white vinyl siding, mature shade trees, a partially fenced yard, a spacious bac
Key facts
- 0.31 acre lot
- Built 1960
- Listed 30 days
Property features AI
Finance
- Other: Property located at 308 Alexander St, Mooresville, NC; Approximately 1,166 total living area; above-grade finished area reported
- HOA & community: No HOA
Exterior
- Parking: Driveway with 1 open parking space; Additional parking space(s)
- Utilities: City water; Public sewer
- Home design: Single-family residence (residential); Site-built construction; Two levels; RG zoning
- Construction: Vinyl exterior; Crawl space foundation
- Exterior features: Deck; Front porch; Partial wood privacy fencing in the backyard; Lot is on a cul-de-sac, level to sloped and wooded; Concrete, paved, publicly maintained road access
Interior
- Kitchen: Dishwasher; Electric oven; Microwave; Refrigerator
- Bedrooms: 3 bedrooms total — 2 upstairs, 1 on the main level
- Bathrooms: 2 full bathrooms (both on the main level)
- Heating & cooling: Central heating (forced air); Central air conditioning; Ceiling fan(s)
- Interior features: 8 total rooms; Central heating with forced air; Ceiling fans and central air conditioning
- Laundry & utility: Laundry located in the kitchen, inside on the main level
Neighborhood map
What this means for you Summary
Snapshot
- This is a 3-bed/2.0-bath single-family listed at $239k.
Deal economics
- At list price, monthly cash flow is $-151 ($-2k/yr) — negative.
- To cash-flow at today's rent, offer at most $212k (11.2% below list).
- To meet the 1% rule (rent ≥ 1% of price), the offer needs to be $176k (26.4% below list).
- Recommended offer: $176k (26.4% below list) — sets the bar for 1% rule.
- Cap rate 5.5% vs local median 2.9% in Mooresville — top-decile yield for the area; either an underpriced asset or a hidden risk that comps aren't pricing in. Stress-test before assuming the spread holds.
Location & tenants
- Location reads 73/100 on livability (#66 in NC) — a middle-class / working-renter tenant base. Strengths: housing A+, health & safety A+, employment A-; Watch: amenities F, commute F.
- Mooresville Graded School District (other): math 51% / reading 55% proficiency, ranked #49 of 178 in NC (top 28%) — acceptable for families but not a draw, mixed tenant base, ~2y average lease.
- Market conditions: Rents rising (+1.6%/yr); 488 active listings in the ZIP; 18 comparable units currently listed for rent nearby; rentals at typical pace (median 16d on market — plan ~3-4 weeks tenant-placement turnaround); solid renter incomes; 1,955 units permitted in Iredell County in 2024 (128 in 5+ unit buildings).
Forward outlook
- Local home prices are declining (-3.0%/yr); year-one equity from $2k of loan paydown is wiped out by about $7k of value loss. Plan a longer hold.
- Iredell County population projected at +26% by 2050 — long-run rental-demand tailwind backs the buy-and-hold thesis.
Negotiation context
- It's been on market 30 days — a 2% lower offer ($235k) is reasonable based on typical stale-listing flexibility.
- 3 sale attempts since 2y ago with the ask held roughly flat each time — persistent listings suggest the price (not the market) is what's stuck; bring a comps-based counter.
- Current owner paid $55k; list at $239k implies a 335% gain — meaningful room to come down on a strong offer.
Risks & watch-outs
- Climate carrying-cost: extreme-heat days projected 7→15/yr by 2055 (HVAC capex compounding) — expect insurance premiums to compound above CPI over the hold.
Questions for the listing agent
- What do current leases actually rent for vs. the listed asking? Can we see a recent rent roll and the last 12 months of T-12 income?
- Built in 1960 — when were the roof, HVAC, electrical panel, plumbing, and water heater last replaced?
- Is there a deadline driving the sale (1031 exchange, divorce, estate, relocation)? That informs how much negotiation room exists.
- Schools are B-rated — typically a magnet for longer-tenancy family renters. What's the average tenant stay here, and is there a school-zone premium baked into asking?
- The area grade is low — what's the realistic commute time and amenity access for the typical tenant pool here? Any planned neighborhood developments (good or bad) we should know about?
- What's the average days-on-market for RENTAL listings here right now (not sales)? A rising rental-DOM trend means longer vacancies and softer asking-rent achievability than the comps imply.
- What's the recent tenant-quality profile in this submarket — average credit score on applications, eviction rate, late-payment / NSF rate, and stable-employment percentage? A property-management company in the area should have these aggregated.
- How much new for-sale + rental construction is in the pipeline within 1–3 miles? Heavy new supply typically softens prices + rents 12–24 months out; constrained supply supports both.
Investment metrics
- 1% rule
- 0.74% ✗
- Cap rate
- 5.53%
- Cash-on-cash
- -2.71%
- DSCR
- 0.88
- GRM
- 11.3
CMA / ARV
- ARV (median comp)
- $268,272
- List price
- $239,000
- Delta
- -10.91%
- Verdict
- UNDERPRICED
- Comps
- 20 within 1.0 mi
Show comp detail 12 sales within ~0.75 mi
| Address | Dist | Beds/Ba | Sqft | Sold | Price | $/sf | Match |
|---|---|---|---|---|---|---|---|
| 532 W Mclelland Ave | 0.19mi | 3/2.0 | 1,205 (+3%) | 5mo | $270,000 | $224 | 82 |
| 422 W Mclelland Ave | 0.26mi | 3/2.0 | 1,190 (+2%) | 8mo | $295,000 | $248 | 78 |
| 131 Canopy Ct | 0.41mi | 3/2.0 | 1,239 (+6%) | 10mo | $345,000 | $278 | 62 |
| 415 W Iredell Ave | 0.64mi | 3/2.5 | 1,222 (+4%) | 0mo | $215,000 | $176 | 60 |
| 409 W Iredell Ave | 0.63mi | 3/2.5 | 1,222 (+4%) | 1mo | $221,000 | $181 | 60 |
| 333 W Wilson Ave | 0.33mi | 3/1.0 | 1,099 (-6%) | 13mo | $275,000 | $250 | 60 |
| 505 S Academy St | 0.52mi | 2/1.0 (-1) | 1,188 (+2%) | 8mo | $248,000 | $209 | 58 |
| 239 Bradford Glyn Dr | 0.40mi | 3/2.0 | 1,303 (+11%) | 13mo | $340,000 | $261 | 52 |
| 208 Pond St | 0.67mi | 2/1.0 (-1) | 1,117 (-4%) | 4mo | $232,500 | $208 | 49 |
| 315 W Lowrance Ave | 0.68mi | 2/2.0 (-1) | 1,020 (-13%) | 1mo | $275,000 | $270 | 41 |
| 318 N Academy St | 0.68mi | 3/1.5 | 1,326 (+13%) | 5mo | $329,900 | $249 | 40 |
| 309 Lutz Ave | 0.58mi | 2/1.0 (-1) | 1,008 (-14%) | 9mo | $166,000 | $165 | 34 |
Match score weights: distance 35% · size 25% · config 20% · recency 20%. Top-matched comps best support the ARV.
Projected returns pro-forma
-3.0% appreciation · 1.58% rent growth · sell at horizon
- IRR
- -22.3%
- Equity multiple
- 0.24×
- Total profit
- $-50,884
- Equity at exit
- $35,636
- IRR
- -20.1%
- Equity multiple
- 0.00×
- Total profit
- $-66,767
- Equity at exit
- $20,664
Cash invested: $66,920 (down + closing). Projections, not guarantees.
Landlord ↔ Tenant lean methodology
- Overall (STATE)
- 85 Strongly Landlord-Friendly
- State North Carolina
- 85 Strongly Landlord-Friendly · R+3
- County
- — inherits STATE
- City
- — inherits STATE
ZIP-level market 28115
- Rents YoY
- 1.6%
- Active inventory
- 488
- Price-to-rent
- 11.3×
Monthly cashflow live
- Estimated rent
- $1,758 high interval (Pro) →
- Mortgage (P&I)
- −$1,253
- Tax from tax record
- −$187 /mo · $2,249/yr
- Insurance
- −$100
- HOA
- −$0
- Vacancy / Maint / Mgmt
- −$369
- Net cashflow
- $-151
Break-even live
UW: 25.0% down · 7.5% · 30yr · 1.5% tax · 5.0% vac · 8.0% maint · 8.0% mgmt
Financing live
Cash to close
- Down payment
- $59,750
- Closing costs
- $7,170
- Reserves months
- —
- Total cash needed
- —
Loan-product check · same deal, 3 products live
Conventional
25% down · 7.5% · 30yr
- Down + closing
- —
- Monthly P&I
- —
- Monthly cashflow
- —
- DSCR
- —
- Eligible?
- —
Personal DTI + credit; lowest rate.
DSCR
20% down · 8.5% · 30yr
- Down + closing
- —
- Monthly P&I
- —
- Monthly cashflow
- —
- DSCR
- —
- Eligible?
- —
No personal income docs; deal must DSCR.
Hard money
10% down · 12.0% · 12mo
- Down + closing
- —
- Monthly P&I
- —
- Monthly cashflow
- —
- DSCR
- —
- Eligible?
- —
Short-term bridge; refi at stabilization.
Rent comps 18 comps
| Address | Beds | Baths | Sqft | Rent | $/sqft | DOM | Units | Dist |
|---|---|---|---|---|---|---|---|---|
| 161 Lansing Cir Mooresville, NC | 3.0 | 1.0–2.0 | 717 | $1,747 | $2.43 | 1d | 11 | 0.55mi |
| 222 S Main St Mooresville, NC | 3.0 | 2.0 | 1353 | $1,879 | $1.39 | 1d | 2 | 0.55mi |
| 201 N Church St Mooresville, NC | 2.0–3.0 | 2.0 | 1293 | $1,995 | $1.54 | 1d | 4 | 0.78mi |
| 630 S Main St Apt 14 Mooresville, NC | 2.0 | 1.5 | 1100 | $1,425 | $1.30 | 24d | 1 | 0.79mi |
| 900 W Wilson Ave Mooresville, NC | 2.0 | 1.0 | 970 | $1,248 | $1.29 | 2d | 8 | 0.86mi |
| 153 Marakery Rd Mooresville, NC | 3.0 | 2.5 | 1327 | $1,600 | $1.21 | 24d | 1 | 0.89mi |
| 729 Spruce St Mooresville, NC | 2.0 | 1.0 | 1250 | $1,400 | $1.12 | 24d | 1 | 0.90mi |
| 208 Parker Ave Mooresville, NC | 2.0 | 1.0 | 1200 | $1,400 | $1.17 | 24d | 1 | 1.00mi |
| 532 E Iredell Ave Unit B Mooresville, NC | 2.0 | 1.0 | 755 | $1,025 | $1.36 | 24d | 1 | 1.05mi |
| 504 E McLelland Ave Mooresville, NC | 3.0 | 2.0 | 1054 | $1,673 | $1.59 | 24d | 1 | 1.10mi |
| 604 E Iredell Ave Unit 2 Mooresville, NC | 3.0 | 2.0 | 1323 | $1,395 | $1.05 | 24d | 1 | 1.11mi |
| 604 E Iredell Ave Mooresville, NC | 3.0 | 2.0 | 1323 | $1,395 | $1.05 | 16d | 2 | 1.11mi |
| 604 E Iredell Ave Unit 2 Mooresville, NC | 3.0 | 2.0 | 1323 | $1,395 | $1.05 | 14d | 1 | 1.11mi |
| 445 Stonewood Dr Mooresville, NC | 1.0–2.0 | 1.0 | 660 | $1,265 | $1.92 | 2d | 4 | 1.25mi |
| 117 Abberly Green Blvd Unit Elliot I Mooresville, NC | 2.0 | 2.0 | 1204 | $1,648 | $1.37 | 5d | 1 | 1.32mi |
| 157 Hathaway Ln Mooresville, NC | 1.0–3.0 | 1.0–2.0 | 1204 | $1,959 | $1.63 | 1d | 36 | 1.40mi |
| 123 Talbert Woods Dr Mooresville, NC | 1.0–3.0 | 1.0–2.5 | 1140 | $1,602 | $1.40 | 1d | 24 | 1.40mi |
| 36 Selma Dr Unit B Mooresville, NC | 3.0 | 2.0 | 1100 | $1,700 | $1.55 | 24d | 1 | 1.44mi |
Listing history 22 events
-
2026-06-18days on market $239,000 Active 30 DOM
-
2026-06-17days on market $239,000 Active 29 DOM
-
2026-06-16days on market $239,000 Active 28 DOM
-
2026-06-15price $239,000 Active 27 DOM
-
2026-06-15days on market $242,500 Active 27 DOM
-
2026-06-13days on market $242,500 Active 25 DOM
-
2026-06-09days on market $242,500 Active 21 DOM
-
2026-06-08days on market $242,500 Active 20 DOM
-
2026-06-07pricedays on market $242,500 Active 19 DOM
-
2026-06-04days on market $250,000 Active 16 DOM
-
2026-06-03days on market $250,000 Active 15 DOM
-
2026-06-02days on market $250,000 Active 14 DOM
-
2026-06-01days on market $250,000 Active 13 DOM
-
2026-05-31days on market $250,000 Active 12 DOM
-
2026-05-06historical $250,000 1515-char remark
-
2025-04-08historical $1,850
-
2025-03-05$1,850
-
2025-01-13price $250,000
-
2025-01-01price $259,000
-
2024-12-06$269,500 Active
-
2024-08-30soldstatus $55,000
-
2000-11-28soldstatus $49,500
ⓘ Source: listings_history table (triggers on properties + properties_extension) + one-shot
backfill from property_details.listing_events for pre-trigger history.
Tax reassessment forecast NC · Resets to sale price
- Current annual tax
- $2,249 · $187/mo
- Projected year-2 tax
- $2,249 · $187/mo
- Expected delta
- $0/yr ($0/mo · 0.0%)
ⓘ Screening estimate from a state-policy table — verify with the county assessor before closing.
Climate risk First Street
- Flood 1/10 Low FEMA zone X (unshaded) · 0% chance over 30 yrs
- Wildfire 1/10 Low
- Heat 5/10 Major 7 d/yr ≥103°F today · 15 d/yr by 30 yrs out
- Wind 4/10 Moderate 10% chance of damaging wind over 30 yrs
- Air quality 2/10 Low 1 unhealthy d/yr today · 2 by 30 yrs out
Nearby sold comps map
Loading sold comps map…
Walkable amenities ~0.75 mi
Loading nearby amenities…
Taxation est. · year 1
- Rental income
- $21,099
- − Mortgage interest
- −$13,388
- − Property taxes
- −$2,249
- − Insurance
- −$1,195
- − Repairs & maintenance
- −$1,688
- − Management
- −$1,688
- − Depreciation
- −$6,953
- Taxable loss
- −$6,061
- Est. tax savings @ 24.0%
- +$1,455
- After-tax cash flow
- $-361/yr
For passive investors: Depreciation is non-cash, so a rental often shows a tax loss while cash-flowing — sheltering income. Rental losses are passive: they offset passive income freely, and up to $25,000/yr can offset ordinary (W-2) income if you actively participate and your MAGI is under $100k (phasing out to $0 by $150k); unused losses carry forward. On sale, claimed depreciation is recaptured at up to 25%, and gains may owe capital-gains tax (a 1031 exchange can defer both). Figures are a year-1 estimate at your 24.0% rate — not tax advice; consult a CPA.
Schools (NCES district)
- District
- Mooresville Graded School District
- NCES district ID
- 3703120
- Math proficiency
- 51% ▼ -3.00%
- Reading proficiency
- 55% ▬ 0.00%
- Median HH income
- $54,800
- Composite
- 45.72/100
- National rank
- #2574
- State rank
- #49 of 178 in NC
Livability — Mooresville
- Score
- 73/100
- State rank
- #66
- US rank
- #5026
Category grades
Schools grade is shown separately in the Schools card above.
Census & demographics
- Census place
- Mooresville, NC
- County
- Iredell County · 182,638 people
- City population
- 92,370
- Metro
- Charlotte-Concord-Gastonia, NC-SC
- Population (ZIP)
- 43,544
- Household income
- $87,787
- Rent vs Own
- Severe rent burden
- 803.0
Population outlook (Iredell County) Hauer SSP2
- Today (2025)
- 194,510 people
- By 2030
- 206,171 · +6.0%
- By 2040
- 227,781 · +17.1%
- By 2050
- 245,102 · +26.0%
- By 2075
- 280,896 · +44.4%
- By 2100
- 294,375 · +51.3%
Race, ethnicity, and origin ACS 2023
- Neighborhood character
- Predominantly White (77%)
- Race & ethnicity
- White 77% Black 10% Hispanic / Latino 6% Two or more races 6% Asian 2%
- Hispanic origin (detail)
- Mexican 2% Puerto Rican 1%
- Common ancestry
- Iranian 3% Lithuanian 3% Romanian 3%
- Foreign-born
- 6% · Canada, Vietnam
- Languages at home
- 93% English-only · Spanish 4% Other Asian/Pacific 1% Vietnamese 1%
Political lean MEDSL · Iredell
- 2024 margin
- Solid R (+32.6) · D 33.2% · R 65.8%
- 2008→2024 swing
- -8.2pp toward R · 2008: -24.4pp · 2024: -32.6pp
- All cycles
- 2024: R+32.6 2020: R+32.4 2016: R+36.8 2012: R+30.5 2008: R+24.4
Not yet ingested
- Civics
- —
Market trends
- HPI YoY
- ▼ -135.96%
- Current HPI
- 246.6181
- Rent YoY
- ▲ 1.58%
- Metro
- Charlotte-Concord-Gastonia, NC-SC
- State GDP YoY
- ▲ 3.28%
- F500 in state
- 26
Industry mix (Fortune 500 HQ in NC)
| Industry | F500 HQs | Revenue |
|---|---|---|
| Financial Services | 2 | $213B |
|
||
| Retail | 2 | $95B |
|
||
| Industrial Conglomerate | 1 | $38B |
|
||
| Metals / Steel | 1 | $35B |
|
||
| Utilities | 1 | $30B |
|
||
| Industrial Machinery | 1 | $19B |
|
||
Price history
+382.8% since first listed11 events — show timeline
- 2026-06-15 Price Changed $239,000 CANOPYMLS as Distributed by MLS Grid
- 2026-06-04 Price Changed $242,500 CANOPYMLS as Distributed by MLS Grid
- 2026-05-19 Listed $250,000 CANOPYMLS as Distributed by MLS Grid
- 2026-05-06 Coming Soon $250,000 CANOPYMLS as Distributed by MLS Grid
- 2025-04-08 Rental Removed $1,850 RENTALBEAST
- 2025-03-05 Listed for Rent $1,850 RENTALBEAST
- 2025-01-13 Price Changed $250,000 CANOPYMLS as Distributed by MLS Grid
- 2025-01-01 Price Changed $259,000 CANOPYMLS as Distributed by MLS Grid
- 2024-12-06 Listed $269,500 CANOPYMLS as Distributed by MLS Grid
- 2024-08-30 Sold (Public Records) $55,000 Public Records
- 2000-11-28 Sold (Public Records) $49,500 Public Records
Property tax history
+5.5%/yrLatest (2025): $2,249 · +3.9% YoY. Source: county tax records.
Cash-flow waterfall
monthlySold comps — $/sqft
last 12 mo · ≤1 miLoading sold comps…