6716 Navajo Trl · Lake Norman of Catawba, NC
Flood risk No data
- FEMA flood zone
- —
- Chance of flooding over 30 yrs
- —
- Est. flood insurance / yr
- —
Fire risk No data
- Est. fire insurance / yr
- —
Heat risk No data
- Hot days now (above threshold)
- —
- Hot days in 30 yrs
- —
Wind risk No data
- Chance of severe wind over 30 yrs
- —
Air-quality risk No data
- Unhealthy air days now
- —
- Unhealthy air days in 30 yrs
- —
Risk factors via First Street. Map © Google.
Why this score? — see what drove the C- grade
The composite is a weighted blend of 9 inputs, each scored 0–100. Each bar is that input's sub-score; the figure is the points it added to the 100-point composite (weight × sub-score).
- Cash flow +21.6/30.0
- ARV discount +7.5/15.0
- DSCR +6.9/10.0
- 1% rule +4.7/10.0
- Schools +4.5/10.0
- Livability +3.2/5.0
- Rent growth +2.5/5.0
- Condition / age +2.5/5.0
- Appreciation +0.0/10.0
$215,000
🖨 Deal sheet 📄 Offer letter ✓ Due diligence
Listing remarks
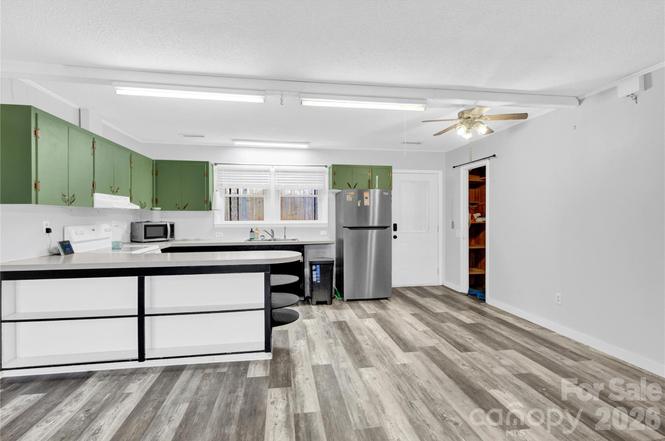
* * MOTIVATED SELLER! * * TWO KITCHENS, TWO ENTRANCES, DUPLEX OPTION, MOTHER-IN-LAW SUITE, FLEXIBLE SPACE. This home is a place that offers comfort, privacy, and flexibility, setting on a private . 86 acre lot surrounded by mature trees giving you a sense of peace and quiet. The moment you walk in, you'll notice the fresh paint and LVP flooring throughout the home giving you an updated and clean look ready for you to make it your own. What truly makes this home special is the versatility it offers with two entry points and two kitchens ready for your families needs, a guest room set up, or use it as a duplex and make additional income. Located just minutes from Hwy 150 and close proximit
Key facts
- 0.85 acre lot
- 2 parking spots
- Built 1900
Property features AI
Finance
- HOA & community: No HOA
Exterior
- Parking: Attached carport with 2 spaces
- Utilities: Shared well water; Septic system installed
- Home design: Single-family residential; Site-built, one level; R-30 zoning
- Construction: Vinyl exterior; Slab foundation; Built as site-built construction
- Exterior features: Dirt road access on a privately maintained road; Approximately 0.85 acre lot
Interior
- Kitchen: Electric cooktop; Electric oven; Microwave; Electric water heater
- Bedrooms: 3 bedrooms (all on the main level)
- Bathrooms: 2 full bathrooms (both on the main level)
- Heating & cooling: Heat pump; Central air conditioning
- Interior features: 9 total rooms; Fireplace
- Laundry & utility: Main-level laundry room with washer and electric dryer hookups
Neighborhood map
What this means for you Summary
Snapshot
- This is a 3-bed/2.0-bath single-family listed at $215k.
Deal economics
- At list price, monthly cash flow is $327 ($4k/yr) — positive.
- The deal already cash-flows at list — no discount required.
- To meet the 1% rule (rent ≥ 1% of price), the offer needs to be $209k (3.0% below list).
- Recommended offer: $189k (12.0% below list) — sets the bar for market timing.
- Cap rate 8.1% vs local median 2.7% in Lake Norman of Catawba — top-decile yield for the area; either an underpriced asset or a hidden risk that comps aren't pricing in. Stress-test before assuming the spread holds.
Location & tenants
- Location reads 65/100 on livability (#302 in NC) — a middle-class / working-renter tenant base. Strengths: crime A+, employment A+, housing A; Watch: amenities F, commute F, cost of living F.
- Catawba County Schools (rural): math 54% / reading 51% proficiency, ranked #54 of 178 in NC (top 30%) — acceptable for families but not a draw, mixed tenant base, ~2y average lease.
- Market conditions: 279 active listings in the ZIP; 2 comparable units currently listed for rent nearby; solid renter incomes; 2,016 units permitted in Catawba County in 2024 (255 in 5+ unit buildings).
Forward outlook
- Local home prices are declining (-3.0%/yr); year-one equity from $1k of loan paydown is wiped out by about $6k of value loss. Plan a longer hold.
- Catawba County population projected to shrink 7% by 2050 — rents likely to lag national; underwrite the cash flow, not the appreciation.
Negotiation context
- It's been on market 137 days — a 12% lower offer ($189k) is reasonable based on typical stale-listing flexibility.
- Current owner paid $155k; 39% above their basis — modest negotiation headroom, anchor on the comps not their cost.
Risks & watch-outs
- Watch-outs: built in 1900 — expect roof / HVAC / electrical / plumbing capex.
Questions for the listing agent
- It's been on market 137 days. Have you received any prior offers? Is the seller open to a 12% concession, seller financing, or rate buy-down credit?
- Built in 1900 — when were the roof, HVAC, electrical panel, plumbing, and water heater last replaced?
- Why hasn't it sold? Are there any deal-killer items the seller is aware of (foundation, flood, title, zoning, code violations)?
- Is there a deadline driving the sale (1031 exchange, divorce, estate, relocation)? That informs how much negotiation room exists.
- Schools are B-rated — typically a magnet for longer-tenancy family renters. What's the average tenant stay here, and is there a school-zone premium baked into asking?
- What's the average days-on-market for RENTAL listings here right now (not sales)? A rising rental-DOM trend means longer vacancies and softer asking-rent achievability than the comps imply.
- What's the recent tenant-quality profile in this submarket — average credit score on applications, eviction rate, late-payment / NSF rate, and stable-employment percentage? A property-management company in the area should have these aggregated.
- How much new for-sale + rental construction is in the pipeline within 1–3 miles? Heavy new supply typically softens prices + rents 12–24 months out; constrained supply supports both.
Investment metrics
- 1% rule
- 0.97% ✗
- Cap rate
- 8.12%
- Cash-on-cash
- 6.52%
- DSCR
- 1.29
- GRM
- 8.6
CMA / ARV
- ARV (on-the-fly)
- $582,360
- Comps found
- 3
Show comp detail 3 sales within ~0.75 mi
| Address | Dist | Beds/Ba | Sqft | Sold | Price | $/sf | Match |
|---|---|---|---|---|---|---|---|
| 6819 Navajo Trl | 0.22mi | 3/2.0 | 1,370 (-1%) | 17mo | $465,000 | $339 | 74 |
| 6778 Emerald Isle Dr | 0.38mi | 3/2.0 | 1,237 (-10%) | 4mo | $522,600 | $422 | 62 |
| 7041 Wateredge Dr | 0.66mi | 3/1.0 | 1,512 (+10%) | 16mo | $725,000 | $479 | 36 |
Match score weights: distance 35% · size 25% · config 20% · recency 20%. Top-matched comps best support the ARV.
Projected returns pro-forma
-3.0% appreciation · 3.0% rent growth · sell at horizon
- IRR
- -6.3%
- Equity multiple
- 0.77×
- Total profit
- $-14,090
- Equity at exit
- $32,057
- IRR
- 3.3%
- Equity multiple
- 1.24×
- Total profit
- $14,255
- Equity at exit
- $18,589
Cash invested: $60,200 (down + closing). Projections, not guarantees.
Landlord ↔ Tenant lean methodology
- Overall (STATE)
- 85 Strongly Landlord-Friendly
- State North Carolina
- 85 Strongly Landlord-Friendly · R+3
- County
- — inherits STATE
- City
- — inherits STATE
ZIP-level market 28673
- Home prices YoY
- -18.0%
- Active inventory
- 279
- Price-to-rent
- 8.6×
Monthly cashflow live
- Estimated rent
- $2,086 medium interval (Pro) →
- Mortgage (P&I)
- −$1,127
- Tax from tax record
- −$104 /mo · $1,246/yr
- Insurance
- −$90
- HOA
- −$0
- Vacancy / Maint / Mgmt
- −$438
- Net cashflow
- $327
Break-even live
UW: 25.0% down · 7.5% · 30yr · 1.5% tax · 5.0% vac · 8.0% maint · 8.0% mgmt
Financing live
Cash to close
- Down payment
- $53,750
- Closing costs
- $6,450
- Reserves months
- —
- Total cash needed
- —
Loan-product check · same deal, 3 products live
Conventional
25% down · 7.5% · 30yr
- Down + closing
- —
- Monthly P&I
- —
- Monthly cashflow
- —
- DSCR
- —
- Eligible?
- —
Personal DTI + credit; lowest rate.
DSCR
20% down · 8.5% · 30yr
- Down + closing
- —
- Monthly P&I
- —
- Monthly cashflow
- —
- DSCR
- —
- Eligible?
- —
No personal income docs; deal must DSCR.
Hard money
10% down · 12.0% · 12mo
- Down + closing
- —
- Monthly P&I
- —
- Monthly cashflow
- —
- DSCR
- —
- Eligible?
- —
Short-term bridge; refi at stabilization.
Rent comps 2 comps
| Address | Beds | Baths | Sqft | Rent | $/sqft | DOM | Units | Dist |
|---|---|---|---|---|---|---|---|---|
| 4455 Reed Creek Dr #304 Sherrills Ford, NC | 2.0 | 2.0 | 1271 | $1,499 | $1.18 | 23d | 1 | 0.74mi |
| 4455 Reed Creek Dr #305 Sherrills Ford, NC | 2.0 | 2.0 | 1271 | $1,850 | $1.46 | 23d | 1 | 0.77mi |
Listing history 20 events
-
2026-06-18days on market $215,000 Active 137 DOM
-
2026-06-17days on market $215,000 Active 136 DOM
-
2026-06-16days on market $215,000 Active 135 DOM
-
2026-06-15days on market $215,000 Active 134 DOM
-
2026-06-13days on market $215,000 Active 132 DOM
-
2026-06-13days on market $215,000 Active 131 DOM
-
2026-06-09days on market $215,000 Active 128 DOM
-
2026-06-08days on market $215,000 Active 127 DOM
-
2026-06-07days on market $215,000 Active 126 DOM
-
2026-06-04days on market $215,000 Active 123 DOM
-
2026-06-03days on market $215,000 Active 122 DOM
-
2026-06-02days on market $215,000 Active 121 DOM
-
2026-06-01days on market $215,000 Active 120 DOM
-
2026-05-31days on market $215,000 Active 119 DOM
-
2026-04-17price $215,000
-
2026-03-18price $230,000
-
2026-03-02price $240,000
-
2026-02-01$250,000 Active
-
2026-01-26historical $250,000
-
2024-02-12soldstatus $155,000
ⓘ Source: listings_history table (triggers on properties + properties_extension) + one-shot
backfill from property_details.listing_events for pre-trigger history.
Tax reassessment forecast NC · Resets to sale price
- Current annual tax
- $1,246 · $104/mo
- Projected year-2 tax
- $1,763 · $147/mo
- Expected delta
- +$517/yr (+$43/mo · 41.5%)
ⓘ Screening estimate from a state-policy table — verify with the county assessor before closing.
Nearby sold comps map
Loading sold comps map…
Walkable amenities ~0.75 mi
Loading nearby amenities…
Taxation est. · year 1
- Rental income
- $25,030
- − Mortgage interest
- −$12,043
- − Property taxes
- −$1,246
- − Insurance
- −$1,075
- − Repairs & maintenance
- −$2,002
- − Management
- −$2,002
- − Depreciation
- −$6,255
- Taxable income
- $406
- Est. tax owed @ 24.0%
- −$97
- After-tax cash flow
- $3,825/yr
For passive investors: Depreciation is non-cash, so a rental often shows a tax loss while cash-flowing — sheltering income. Rental losses are passive: they offset passive income freely, and up to $25,000/yr can offset ordinary (W-2) income if you actively participate and your MAGI is under $100k (phasing out to $0 by $150k); unused losses carry forward. On sale, claimed depreciation is recaptured at up to 25%, and gains may owe capital-gains tax (a 1031 exchange can defer both). Figures are a year-1 estimate at your 24.0% rate — not tax advice; consult a CPA.
Schools (NCES district)
- District
- Catawba County Schools
- NCES district ID
- 3700690
- Math proficiency
- 54% ▲ 9.00%
- Reading proficiency
- 51% ▲ 3.00%
- Median HH income
- $48,180
- Composite
- 44.71/100
- National rank
- #2754
- State rank
- #54 of 178 in NC
Livability — Lake Norman of Catawba
- Score
- 65/100
- State rank
- #302
- US rank
- #12561
Category grades
Schools grade is shown separately in the Schools card above.
Census & demographics
- Census place
- Lake Norman of Catawba, NC
- County
- Catawba County · 105,763 people
- City population
- 7,768
- Metro
- Hickory-Lenoir-Morganton, NC
- Population (ZIP)
- 6,874
- Household income
- $99,688
- Rent vs Own
- Severe rent burden
- 55.0
Population outlook (Catawba County) Hauer SSP2
- Today (2025)
- 156,513 people
- By 2030
- 155,267 · -0.8%
- By 2040
- 151,110 · -3.5%
- By 2050
- 145,524 · -7.0%
- By 2075
- 134,047 · -14.4%
- By 2100
- 119,424 · -23.7%
Race, ethnicity, and origin ACS 2023
- Neighborhood character
- Predominantly White (95%)
- Race & ethnicity
- White 95% Hispanic / Latino 2% Two or more races 2% Black 2%
- Common ancestry
- Slovak 3% Serbian 3% Romanian 2%
- Foreign-born
- 3% · Canada
- Languages at home
- 96% English-only · Spanish 2% German/W. Germanic 1% Russian/Polish/Slavic 1%
Political lean MEDSL · Catawba
- 2024 margin
- Solid R (+38.0) · D 30.6% · R 68.6%
- 2008→2024 swing
- -13.0pp toward R · 2008: -25.0pp · 2024: -38.0pp
- All cycles
- 2024: R+38.0 2020: R+37.0 2016: R+38.0 2012: R+29.6 2008: R+25.0
Not yet ingested
- Civics
- —
Market trends
- HPI YoY
- ▼ -65.68%
- Current HPI
- 300.0328
- Rent YoY
- —
- Metro
- Hickory-Lenoir-Morganton, NC
- State GDP YoY
- ▲ 3.28%
- F500 in state
- 26
Industry mix (Fortune 500 HQ in NC)
| Industry | F500 HQs | Revenue |
|---|---|---|
| Financial Services | 2 | $213B |
|
||
| Retail | 2 | $95B |
|
||
| Industrial Conglomerate | 1 | $38B |
|
||
| Metals / Steel | 1 | $35B |
|
||
| Utilities | 1 | $30B |
|
||
| Industrial Machinery | 1 | $19B |
|
||
Price history
+38.7% since first listed6 events — show timeline
- 2026-04-17 Price Changed $215,000 CANOPYMLS as Distributed by MLS Grid
- 2026-03-18 Price Changed $230,000 CANOPYMLS as Distributed by MLS Grid
- 2026-03-02 Price Changed $240,000 CANOPYMLS as Distributed by MLS Grid
- 2026-02-01 Listed $250,000 CANOPYMLS as Distributed by MLS Grid
- 2026-01-26 Coming Soon $250,000 CANOPYMLS as Distributed by MLS Grid
- 2024-02-12 Sold (Public Records) $155,000 Public Records
Property tax history
+11.1%/yrLatest (2024): $1,246 · +2.1% YoY. Source: county tax records.
Cash-flow waterfall
monthlySold comps — $/sqft
last 12 mo · ≤1 miLoading sold comps…