 Multi-family
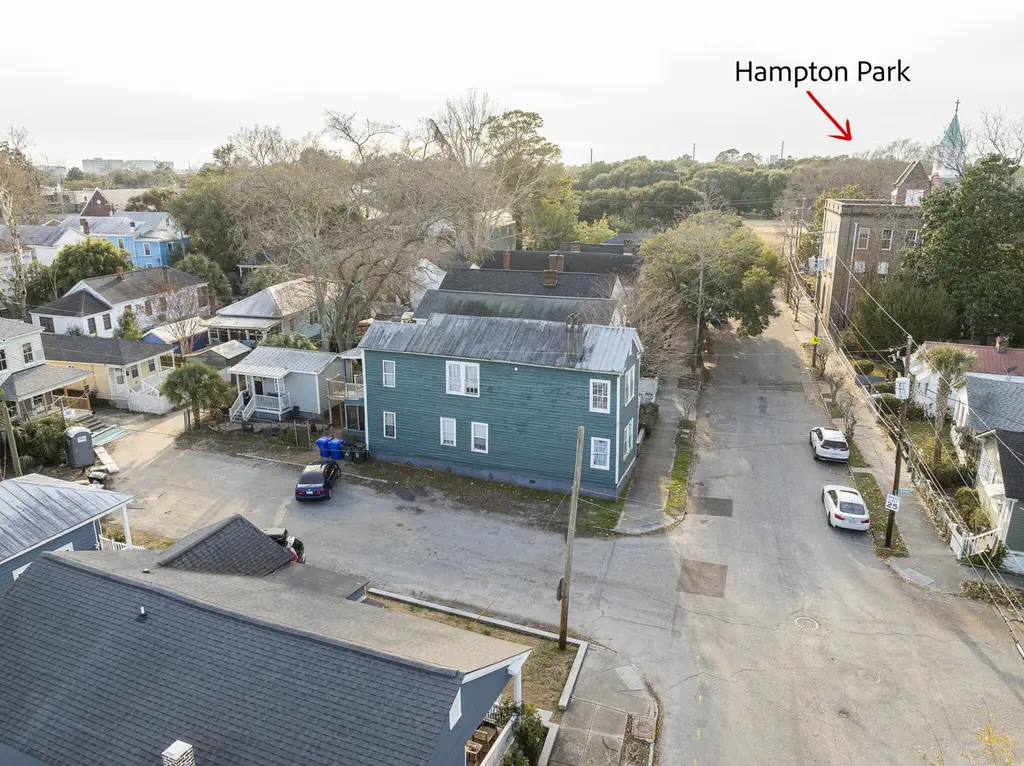
17 Maverick St · Charleston, SC
Flood risk 7/10 · Major
- FEMA flood zone
- X (shaded)
- Chance of flooding over 30 yrs
- 0.92%
- Est. flood insurance / yr
- $507 – $1,088
Fire risk 3/10 · Minor
- Est. fire insurance / yr
- $783 – $1,453
Heat risk 10/10 · Severe
- Hot days now (above 105°F)
- 7 days/yr
- Hot days in 30 yrs
- 18 days/yr
Wind risk 9/10 · Severe
- Chance of severe wind over 30 yrs
- 99.0%
Air-quality risk 3/10 · Minor
- Unhealthy air days now
- 3 days/yr
- Unhealthy air days in 30 yrs
- 3 days/yr
Risk factors via First Street. Map © Google.
Why this score? — see what drove the D+ grade
The composite is a weighted blend of 9 inputs, each scored 0–100. Each bar is that input's sub-score; the figure is the points it added to the 100-point composite (weight × sub-score).
- Cash flow +15.8/30.0
- ARV discount +7.5/15.0
- DSCR +4.9/10.0
- Schools +4.3/10.0
- Livability +3.8/5.0
- Rent growth +3.6/5.0
- 1% rule +3.1/10.0
- Condition / age +2.5/5.0
- Appreciation +0.0/10.0
$1,130,000
🖨 Deal sheet (PDF) 📄 Offer letter ✓ Due diligence
Multi-family units
County records classify this as Multi-Family (2-4 Unit). Listing-text estimate: 1 unit. estimate disagrees with records
Listing remarks MLS
Looking at all reasonable offers! 3 units, tenant occupied. Interior photos available upon request. Welcome to 17 Maverick st. This Charleston Single is awaiting renovations to restore its' original charm. Conveniently situated near Hampton Park and local restaurants. Minutes away from MUSC, College of Charleston and the Citadel. This home is rich with character, reflecting the enduring architectural heritage of the city while presenting a canvas for customization. Don't miss your opportunity to reimagine this historic property.
Key facts
- Historic property
- Near hampton park
- 3,049 sq ft lot
Tags
Property features AI
Finance
- HOA & community: Community amenities include bus line access, dog park, public park, and tennis courts
Exterior
- Parking: Off-street parking; Other parking features
- Utilities: Public sewer
- Home design: Single family detached residential; Two levels; Located on a lot under 0.5 acre
- Construction: Metal roof
- Exterior features: Stoop; Chain link and partial fencing; Metal roof; Other outbuildings/structures
Interior
- Kitchen: Gas range; Refrigerator
- Bedrooms: 7 bedrooms; Primary bedroom(s) on lower and upper levels; Primary bedroom with ceiling fan(s)
- Flooring: Ceramic tile; Vinyl
- Bathrooms: 3 bathrooms
- Heating & cooling: Central heating; Central air conditioning
- Interior features: Blown ceilings; Smooth ceilings; Eat-in kitchen; Family room; In-law floorplan; Fireplace (other type)
- Laundry & utility: Laundry room; Washer hookup; Electric dryer hookup
Neighborhood map
What this means for you Summary
Snapshot
- This is a 4-bed/2.0-bath multifamily listed at $1.13M.
Deal economics
- At list price, monthly cash flow is $458 ($5k/yr) — positive.
- The deal already cash-flows at list — no discount required.
- To meet the 1% rule (rent ≥ 1% of price), the offer needs to be $911k (19.4% below list).
- Recommended offer: $911k (19.4% below list) — sets the bar for 1% rule.
- Cap rate 6.8% vs local median 2.4% in Charleston — top-decile yield for the area; either an underpriced asset or a hidden risk that comps aren't pricing in. Stress-test before assuming the spread holds.
Location & tenants
- Location reads 76/100 on livability (#22 in SC, #3,336 nationally) — a middle-class / working-renter tenant base. Strengths: amenities A+, housing A+, health & safety A+; Watch: crime D+, commute F, cost of living D-.
- Charleston 01 (urban): math 48% / reading 53% proficiency, ranked #7 of 80 in SC (top 9%) — acceptable for families but not a draw, mixed tenant base, ~2y average lease.
- Zoned schools: James Simons Montessori (math 27% / reading 37%, grade F, #369 of 597 statewide, top 64%, 360 students, 100% FRL); Simmons Pinckney Middle (math 3% / reading 13%, grade F, #226 of 229 statewide, top 99%, 219 students, 100% FRL); Burke High (math 32% / reading 67%, grade D, #151 of 196 statewide, top 79%, 352 students, 100% FRL) — zoned schools average 100% FRL vs 44% district-wide (56 pts higher); higher-poverty schools than district average — tighter screening recommended.
- Zoned-school proficiency averages 30% at this address vs 50% district-wide (-21 pts) — the specific schools serving this property underperform the Charleston 01 average; the district grade overstates school quality for this exact location.
- Market conditions: Rents rising fast (+4.6%/yr); 151 active listings in the ZIP; 13 comparable units currently listed for rent nearby; rentals at typical pace (median 24d on market — plan ~3-4 weeks tenant-placement turnaround); 4,156 units permitted in Charleston County in 2024 (857 in 5+ unit buildings).
Forward outlook
- Local home prices are declining (-3.0%/yr); year-one equity from $8k of loan paydown is wiped out by about $34k of value loss. Plan a longer hold.
- Charleston County population projected at +44% by 2050 — long-run rental-demand tailwind backs the buy-and-hold thesis.
Negotiation context
- It's been on market 61 days — a 6% lower offer ($1.06M) is reasonable based on typical stale-listing flexibility.
- 3 sale attempts with the ask held roughly flat each time — persistent listings suggest the price (not the market) is what's stuck; bring a comps-based counter.
- Current owner paid $18k; list at $1.13M implies a 6178% gain — meaningful room to come down on a strong offer.
Risks & watch-outs
- Watch-outs: flood insurance adds $66/mo; built in 1916 — expect roof / HVAC / electrical / plumbing capex.
- Climate carrying-cost: major flood risk; severe wind risk, 99% chance of damaging wind over 30y; extreme-heat days projected 7→18/yr by 2055 (HVAC capex compounding) — expect insurance premiums to compound above CPI over the hold.
Questions for the listing agent
- It's been on market 61 days. Have you received any prior offers? Is the seller open to a 19% concession, seller financing, or rate buy-down credit?
- Built in 1916 — when were the roof, HVAC, electrical panel, plumbing, and water heater last replaced?
- What's the actual annual flood-insurance premium (NFIP or private), and is the property in a SFHA with mandatory coverage?
- Why hasn't it sold? Are there any deal-killer items the seller is aware of (foundation, flood, title, zoning, code violations)?
- Is there a deadline driving the sale (1031 exchange, divorce, estate, relocation)? That informs how much negotiation room exists.
- Schools are A-rated — typically a magnet for longer-tenancy family renters. What's the average tenant stay here, and is there a school-zone premium baked into asking?
- Crime grade is D in this area — have there been break-ins, vandalism, or insurance claims at this property in the last 3 years? What carrier currently insures it and at what premium?
- The area grade is low — what's the realistic commute time and amenity access for the typical tenant pool here? Any planned neighborhood developments (good or bad) we should know about?
- What's the average days-on-market for RENTAL listings here right now (not sales)? A rising rental-DOM trend means longer vacancies and softer asking-rent achievability than the comps imply.
- What's the recent tenant-quality profile in this submarket — average credit score on applications, eviction rate, late-payment / NSF rate, and stable-employment percentage? A property-management company in the area should have these aggregated.
- How much new apartment / multifamily construction is in the pipeline within 1–3 miles? Heavy new supply (>2% of stock underway) typically softens rents 12–24 months out; light construction supports rent growth.
Investment metrics
- 1% rule
- 0.81% ✗
- Cap rate
- 6.85%
- Cash-on-cash
- 1.99%
- DSCR
- 1.09
- GRM
- 10.3
CMA / ARV
- ARV (on-the-fly)
- $1,129,232
- Comps found
- 4
Show comp detail 4 sales within ~0.75 mi
| Address | Dist | Beds/Ba | Sqft | Sold | Price | $/sf | Match |
|---|---|---|---|---|---|---|---|
| 117 Peachtree St | 0.64mi | 4/2.0 | 2,320 (+0%) | 8mo | $1,132,500 | $488 | 63 |
| 45 Bogard St Unit A&B | 0.69mi | 4/2.0 | 2,414 (+4%) | 13mo | $828,750 | $343 | 49 |
| 314 Ashley Ave Unit A & B | 0.45mi | 4/4.0 | 2,652 (+15%) | 8mo | $1,000,000 | $377 | 40 |
| 203 Romney St | 0.31mi | 4/5.0 | 2,000 (-14%) | 21mo | $1,000,000 | $500 | 34 |
Match score weights: distance 35% · size 25% · config 20% · recency 20%. Top-matched comps best support the ARV.
Projected returns pro-forma
-3.0% appreciation · 4.58% rent growth · sell at horizon
- IRR
- -12.1%
- Equity multiple
- 0.56×
- Total profit
- $-139,757
- Equity at exit
- $168,487
- IRR
- -1.0%
- Equity multiple
- 0.92×
- Total profit
- $-23,925
- Equity at exit
- $97,702
Cash invested: $316,400 (down + closing). Projections, not guarantees.
Landlord ↔ Tenant lean methodology
- Overall (STATE)
- 90 Strongly Landlord-Friendly
- State South Carolina
- 90 Strongly Landlord-Friendly · R+6
- County
- — inherits STATE
- City
- — inherits STATE
ZIP-level market 29403
- Rents YoY
- 4.6%
- Active inventory
- 151
- Price-to-rent
- 31.0×
Monthly cashflow live
- Estimated rent
- $9,109 high interval (Pro) →
- Mortgage (P&I)
- −$5,926
- Tax from tax record
- −$275 /mo · $3,301/yr
- Insurance
- −$471
- Flood insurance flood zone
- −$66 /mo · $798/yr
- HOA
- −$0
- Vacancy / Maint / Mgmt
- −$1,913
- Net cashflow
- $458
Break-even live
Sensitivity live
| Price | -10% $1,098 | -5% $778 | +0% $458 | +5% $138 | +10% $-182 |
|---|---|---|---|---|---|
| Rent | -10% $-262 | -5% $98 | +0% $458 | +5% $818 | +10% $1,178 |
| Rate | -1.0pp $1,027 | -0.5pp $745 | base $458 | +0.5pp $165 | +1.0pp $-133 |
3-unit breakdown (identical units grouped — click to expand)
| Units | Beds | Baths | Est. rent |
|---|---|---|---|
| 3× units | 3 | 1 | $9,108 |
| #1 | 3 | 1 | $3,036 |
| #2 | 3 | 1 | $3,036 |
| #3 | 3 | 1 | $3,036 |
| Total (3 units) | $9,109 | ||
UW: 25.0% down · 7.5% · 30yr · 1.5% tax · 5.0% vac · 8.0% maint · 8.0% mgmt
Financing live
Cash to close
- Down payment
- $282,500
- Closing costs
- $33,900
- Reserves months
- —
- Total cash needed
- —
Loan-product check · same deal, 3 products live
Conventional
25% down · 7.5% · 30yr
- Down + closing
- —
- Monthly P&I
- —
- Monthly cashflow
- —
- DSCR
- —
- Eligible?
- —
Personal DTI + credit; lowest rate.
DSCR
20% down · 8.5% · 30yr
- Down + closing
- —
- Monthly P&I
- —
- Monthly cashflow
- —
- DSCR
- —
- Eligible?
- —
No personal income docs; deal must DSCR.
Hard money
10% down · 12.0% · 12mo
- Down + closing
- —
- Monthly P&I
- —
- Monthly cashflow
- —
- DSCR
- —
- Eligible?
- —
Short-term bridge; refi at stabilization.
Rent comps 13 comps
| Address | Beds | Baths | Sqft | Rent | $/sqft | DOM | Units | Dist |
|---|---|---|---|---|---|---|---|---|
| 87 Romney St Charleston, SC | 3.0 | 2.5 | 2038 | $3,695 | $1.81 | 25d | 1 | 0.43mi |
| 1 Piedmont Ave Charleston, SC | 3.0 | 3.0 | 1810 | $6,500 | $3.59 | 25d | 1 | 0.47mi |
| 35 Cypress St Charleston, SC | 4.0 | 3.5 | 2064 | $5,900 | $2.86 | 25d | 1 | 0.56mi |
| 931 Ashley Ave Charleston, SC | 3.0 | 3.0 | 1794 | $4,049 | $2.26 | 5d | 1 | 0.61mi |
| 94 Bogard St Charleston, SC | 3.0 | 3.5 | 2772 | $5,999 | $2.16 | 25d | 1 | 0.67mi |
| 1195 King St Charleston, SC | 3.0 | 2.0 | 1700 | $3,700 | $2.18 | 23d | 1 | 0.70mi |
| 61 Reid St Unit C Charleston, SC | 4.0 | 2.5 | 1654 | $6,000 | $3.63 | 23d | 1 | 0.99mi |
| 49 America St Charleston, SC | 4.0 | 2.0 | 2180 | $6,000 | $2.75 | 23d | 1 | 1.03mi |
| 655 E Bay St Charleston, SC | 3.0 | 1.0–2.0 | 1353 | $5,004 | $3.70 | 5d | 5 | 1.08mi |
| 118 Rutledge Ave Charleston, SC | 3.0 | 3.5 | 2800 | $7,000 | $2.50 | 5d | 1 | 1.32mi |
| 13 Elizabeth St Apt B Charleston, SC | 3.0 | 1.5 | 1600 | $4,800 | $3.00 | 12d | 1 | 1.36mi |
| 75 Smith St Charleston, SC | 4.0 | 3.5 | 1836 | $11,000 | $5.99 | 5d | 1 | 1.38mi |
| 65 Alexander St Charleston, SC | 3.0 | 2.0 | 1860 | $6,400 | $3.44 | 16d | 1 | 1.45mi |
Listing history 20 events
-
2026-06-22days on market $1,130,000 Active 61 DOM
-
2026-06-18days on market $1,130,000 Active 58 DOM
-
2026-06-17days on market $1,130,000 Active 57 DOM
-
2026-06-16days on market $1,130,000 Active 56 DOM
-
2026-06-15days on market $1,130,000 Active 55 DOM
-
2026-06-10days on market $1,130,000 Active 50 DOM
-
2026-06-09days on market $1,130,000 Active 49 DOM
-
2026-06-08days on market $1,130,000 Active 48 DOM
-
2026-06-07days on market $1,130,000 Active 47 DOM
-
2026-06-05days on market $1,130,000 Active 44 DOM
-
2026-06-03days on market $1,130,000 Active 43 DOM
-
2026-06-01days on market $1,130,000 Active 41 DOM
-
2026-05-31days on market $1,130,000 Active 40 DOM
-
2026-04-21$1,130,000 Active
Show marketing remark (534 chars)
Looking at all reasonable offers! 3 units, tenant occupied. Interior photos available upon request. Welcome to 17 Maverick st. This Charleston Single is awaiting renovations to restore its' original charm. Conveniently situated near Hampton Park and local restaurants. Minutes away from MUSC, College of Charleston and the Citadel. This home is rich with character, reflecting the enduring architectural heritage of the city while presenting a canvas for customization. Don't miss your opportunity to reimagine this historic property.
-
2026-04-21$1,130,000 Active 534-char remark
Show marketing remark (534 chars)
Looking at all reasonable offers! 3 units, tenant occupied. Interior photos available upon request. Welcome to 17 Maverick st. This Charleston Single is awaiting renovations to restore its' original charm. Conveniently situated near Hampton Park and local restaurants. Minutes away from MUSC, College of Charleston and the Citadel. This home is rich with character, reflecting the enduring architectural heritage of the city while presenting a canvas for customization. Don't miss your opportunity to reimagine this historic property.
-
2026-03-01price $1,130,000
-
2026-01-23price $1,240,000
-
2026-01-17price $1,430,500
-
2026-01-05$1,500,000 Active
-
1993-07-15soldstatus $18,000
ⓘ Source: listings_history table (triggers on properties + properties_extension) + one-shot
backfill from property_details.listing_events for pre-trigger history.
Tax reassessment forecast SC · Resets to sale price
- Current annual tax
- $3,301 · $275/mo
- Projected year-2 tax
- $6,441 · $537/mo
- Expected delta
- +$3,140/yr (+$262/mo · 95.1%)
ⓘ Screening estimate from a state-policy table — verify with the county assessor before closing.
Climate risk First Street
- Flood 7/10 Severe FEMA zone X (shaded) · 92% chance over 30 yrs
- Wildfire 3/10 Moderate
- Heat 10/10 Extreme 7 d/yr ≥105°F today · 18 d/yr by 30 yrs out
- Wind 9/10 Extreme 99% chance of damaging wind over 30 yrs
- Air quality 3/10 Moderate 3 unhealthy d/yr today · 3 by 30 yrs out
Nearby sold comps map
Loading sold comps map…
Walkable amenities ~0.75 mi
Loading nearby amenities…
Taxation est. · year 1
- Rental income
- $109,308
- − Mortgage interest
- −$63,298
- − Property taxes
- −$3,301
- − Insurance
- −$6,448
- − Repairs & maintenance
- −$8,745
- − Management
- −$8,745
- − Depreciation
- −$32,873
- Taxable loss
- −$14,100
- Est. tax savings @ 24.0%
- +$3,384
- After-tax cash flow
- $8,879/yr
For passive investors: Depreciation is non-cash, so a rental often shows a tax loss while cash-flowing — sheltering income. Rental losses are passive: they offset passive income freely, and up to $25,000/yr can offset ordinary (W-2) income if you actively participate and your MAGI is under $100k (phasing out to $0 by $150k); unused losses carry forward. On sale, claimed depreciation is recaptured at up to 25%, and gains may owe capital-gains tax (a 1031 exchange can defer both). Figures are a year-1 estimate at your 24.0% rate — not tax advice; consult a CPA.
Schools (NCES district)
- District
- Charleston 01
- NCES district ID
- 4501440
- Math proficiency
- 48% ▼ -2.00%
- Reading proficiency
- 53% ▬ 0.00%
- Median HH income
- $52,376
- Composite
- 43.41/100
- National rank
- #3018
- State rank
- #7 of 80 in SC
Livability — Charleston
- Score
- 76/100
- State rank
- #22
- US rank
- #3336
Category grades
Schools grade is shown separately in the Schools card above.
Census & demographics
- Census place
- Charleston, SC
- County
- Charleston County · 366,793 people
- City population
- 200,573
- Metro
- Charleston-North Charleston, SC
- Population (ZIP)
- 22,533
- Household income
- $66,944
- Rent vs Own
- Severe rent burden
- 2319.0
Population outlook (Charleston County) Hauer SSP2
- Today (2025)
- 480,562 people
- By 2030
- 525,921 · +9.4%
- By 2040
- 612,189 · +27.4%
- By 2050
- 691,627 · +43.9%
- By 2075
- 847,979 · +76.5%
- By 2100
- 926,482 · +92.8%
Race, ethnicity, and origin ACS 2023
- Neighborhood character
- Majority White (58%)
- Race & ethnicity
- White 58% Black 34% Hispanic / Latino 4% Two or more races 3% Asian 1%
- Common ancestry
- Slovak 2% Italian 2% Romanian 1%
- Foreign-born
- 3% · Canada, Dominican Republic, China
- Languages at home
- 96% English-only · Spanish 1% French/Haitian/Cajun 1% Other Indo-European 1%
Political lean MEDSL · Charleston
- 2024 margin
- Lean D (+5.7) · D 51.9% · R 46.3% · Other 1.8%
- 2008→2024 swing
- -2.7pp toward R · 2008: 8.3pp · 2024: 5.7pp
- All cycles
- 2024: D+5.7 2020: D+12.9 2016: D+7.9 2012: D+2.4 2008: D+8.3
Not yet ingested
- Civics
- —
Market trends
- HPI YoY
- ▼ -471.75%
- Current HPI
- 585.4871
- Rent YoY
- ▲ 4.58%
- Metro
- Charleston-North Charleston, SC
- State GDP YoY
- ▲ 4.51%
- F500 in state
- 2
Industry mix (Fortune 500 HQ in SC)
| Industry | F500 HQs | Revenue |
|---|---|---|
| Packaging | 1 | $7B |
|
||
Price history
+6177.8% since first listed7 events — show timeline
- 2026-04-21 Listed $1,130,000 Charleston Trident MLS
- 2026-04-21 Listed $1,130,000 Charleston Trident MLS
- 2026-03-01 Price Changed $1,130,000 Charleston Trident MLS
- 2026-01-23 Price Changed $1,240,000 Charleston Trident MLS
- 2026-01-17 Price Changed $1,430,500 Charleston Trident MLS
- 2026-01-05 Listed $1,500,000 Charleston Trident MLS
- 1993-07-15 Sold (Public Records) $18,000 Public Records
Property tax history
+3.6%/yrLatest (2022): $3,301 · +1.2% YoY. Source: county tax records.
Cash-flow waterfall
monthlySold comps — $/sqft
last 12 mo · ≤1 miLoading sold comps…