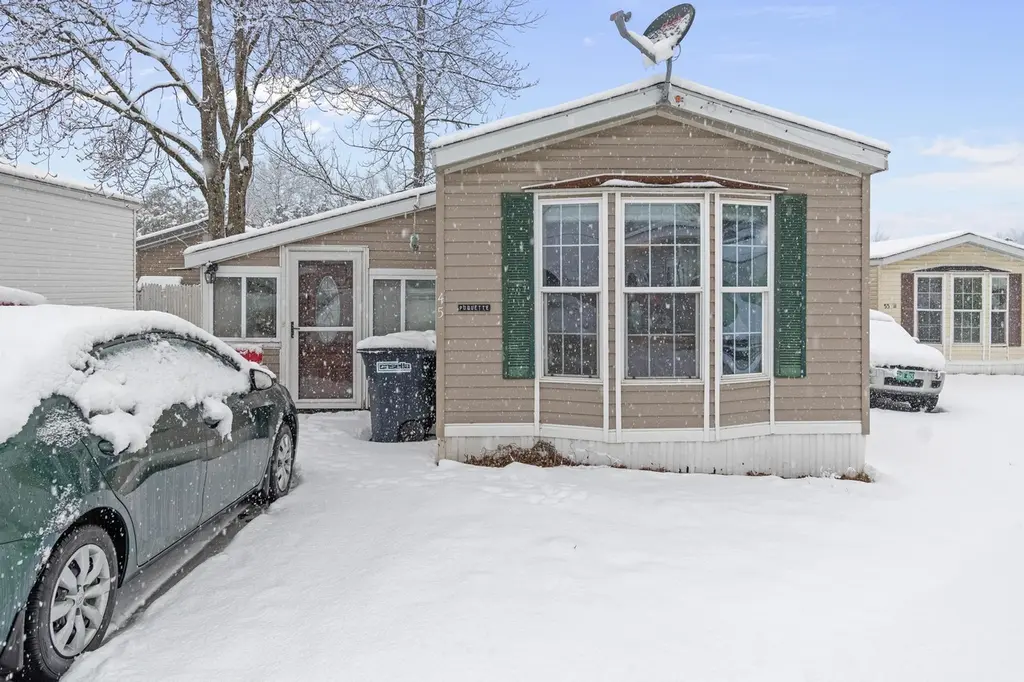
45 Fourth St · Winooski, VT
Flood risk No data
- FEMA flood zone
- —
- Chance of flooding over 30 yrs
- —
- Est. flood insurance / yr
- —
Fire risk No data
- Est. fire insurance / yr
- —
Heat risk 2/10 · Minimal
- Hot days now (above threshold)
- 7 days/yr
- Hot days in 30 yrs
- 15 days/yr
Wind risk No data
- Chance of severe wind over 30 yrs
- —
Air-quality risk 3/10 · Minor
- Unhealthy air days now
- 3 days/yr
- Unhealthy air days in 30 yrs
- 3 days/yr
Risk factors via First Street. Map © Google.
Why this score? — see what drove the C+ grade
The composite is a weighted blend of 9 inputs, each scored 0–100. Each bar is that input's sub-score; the figure is the points it added to the 100-point composite (weight × sub-score).
- Cash flow +30.0/30.0
- 1% rule +10.0/10.0
- DSCR +10.0/10.0
- Schools +5.0/10.0
- Livability +4.2/5.0
- Rent growth +2.5/5.0
- Condition / age +2.5/5.0
- ARV discount +0.0/15.0
- Appreciation +0.0/10.0
$115,000
🖨 Deal sheet 📄 Offer letter ✓ Due diligence
Listing remarks
Charming and affordable, this 2-bedroom, 1-bath manufactured home in Colchester offers 964 square feet of comfortable living space. Inside, you’ll find a functional layout with bright living areas and cozy bedrooms, perfect for easy, low-maintenance living. An enclosed porch adds valuable extra space and features a finished room—ideal for a home office, hobby area, or guest overflow. Whether you’re looking for your first home, downsizing, or seeking an investment opportunity, this property delivers great potential in a convenient Colchester location close to local amenities, Lake Champlain, and Burlington. Don’t miss this opportunity to own a move-in ready home with
Key facts
- Guest overflow
- Finished room
- Enclosed porch
Tags
Neighborhood map
What this means for you Summary
Snapshot
- This is a 2-bed/2.0-bath manufactured listed at $115k.
Deal economics
- At list price, monthly cash flow is $482 ($6k/yr) — positive.
- The deal already cash-flows at list — no discount required.
- Meets the 1% rule at list price ($2k rent vs $115k).
- Cap rate 11.3% vs local median 4.0% in Winooski — top-decile yield for the area; either an underpriced asset or a hidden risk that comps aren't pricing in. Stress-test before assuming the spread holds.
Location & tenants
- Location reads 84/100 on livability (#5 in VT, #831 nationally) — a professional / high-income tenant draw. Strengths: amenities A+, commute A+, health & safety A+; Watch: crime D.
- Zoned schools: Union Memorial School (231 students, 27% FRL).
- Market conditions: 89 active listings in the ZIP; solid renter incomes; 898 units permitted in Chittenden County in 2024 (554 in 5+ unit buildings).
Forward outlook
- Local home prices are declining (-3.0%/yr); year-one equity from $795 of loan paydown is wiped out by about $3k of value loss. Plan a longer hold.
- Chittenden County population projected at +8% by 2050 — modest demand growth; plan on rents tracking national, not racing it.
- At projected returns (-3.0% appreciation + 3.0% rent growth), your $32k cash investment doubles in ~7 years — after that, you're playing with house money.
Negotiation context
- Only 2 days on market — expect competitive offers; lowballing is unlikely to land.
- Current owner paid $47k; list at $115k implies a 146% gain — meaningful room to come down on a strong offer.
Risks & watch-outs
- Watch-outs: HOA is 24% of rent.
Questions for the listing agent
- What does the HOA fee cover, when was the last increase, and are there any pending special assessments or reserve-fund shortfalls?
- Is there a deadline driving the sale (1031 exchange, divorce, estate, relocation)? That informs how much negotiation room exists.
- Schools are B-rated — typically a magnet for longer-tenancy family renters. What's the average tenant stay here, and is there a school-zone premium baked into asking?
- Crime grade is D in this area — have there been break-ins, vandalism, or insurance claims at this property in the last 3 years? What carrier currently insures it and at what premium?
- What's the average days-on-market for RENTAL listings here right now (not sales)? A rising rental-DOM trend means longer vacancies and softer asking-rent achievability than the comps imply.
- What's the recent tenant-quality profile in this submarket — average credit score on applications, eviction rate, late-payment / NSF rate, and stable-employment percentage? A property-management company in the area should have these aggregated.
- How much new for-sale + rental construction is in the pipeline within 1–3 miles? Heavy new supply typically softens prices + rents 12–24 months out; constrained supply supports both.
Investment metrics
- 1% rule
- 1.91% ✓
- Cap rate
- 11.32%
- Cash-on-cash
- 17.96%
- DSCR
- 1.80
- GRM
- 4.4
CMA / ARV
- ARV (on-the-fly)
- $86,856
- Comps found
- 12
Show comp detail 12 sales within ~0.75 mi
| Address | Dist | Beds/Ba | Sqft | Sold | Price | $/sf | Match |
|---|---|---|---|---|---|---|---|
| 19 Third St | 0.03mi | 2/1.5 | 924 (0%) | 8mo | $60,000 | $65 | 90 |
| 70 Fifth St | 0.05mi | 2/2.0 | 924 (0%) | 13mo | $95,000 | $103 | 87 |
| 21 Second St | 0.06mi | 2/2.0 | 960 (+4%) | 5mo | $90,000 | $94 | 87 |
| 78 South St | 0.17mi | 2/2.0 | 952 (+3%) | 2mo | $124,500 | $131 | 85 |
| 64 Seventh St | 0.10mi | 2/1.0 | 924 (0%) | 11mo | $80,000 | $87 | 83 |
| 44 Second St | 0.06mi | 3/1.0 (+1) | 938 (+2%) | 7mo | $111,000 | $118 | 80 |
| 101 6th St | 0.09mi | 2/1.0 | 924 (0%) | 18mo | $85,000 | $92 | 77 |
| 116 Seventh St | 0.12mi | 2/2.0 | 1,000 (+8%) | 6mo | $75,000 | $75 | 76 |
| 43 First St | 0.12mi | 2/1.0 | 924 (0%) | 19mo | $72,000 | $78 | 74 |
| 58 Fifth St | 0.05mi | 2/2.0 | 1,056 (+14%) | 2mo | $107,000 | $101 | 73 |
| 69 East Ave | 0.23mi | 2/1.0 | 972 (+5%) | 17mo | $68,500 | $70 | 63 |
| 62 First St | 0.12mi | 2/1.0 | 840 (-9%) | 15mo | $85,000 | $101 | 62 |
Match score weights: distance 35% · size 25% · config 20% · recency 20%. Top-matched comps best support the ARV.
Projected returns pro-forma
-3.0% appreciation · 3.0% rent growth · sell at horizon
- IRR
- 9.7%
- Equity multiple
- 1.38×
- Total profit
- $12,373
- Equity at exit
- $17,147
- IRR
- 19.0%
- Equity multiple
- 2.60×
- Total profit
- $51,571
- Equity at exit
- $9,943
Cash invested: $32,200 (down + closing). Projections, not guarantees.
Landlord ↔ Tenant lean methodology
- Overall (STATE)
- 41 Moderately Tenant-Leaning
- State Vermont
- 41 Moderately Tenant-Leaning · D+15
- County
- — inherits STATE
- City
- — inherits STATE
ZIP-level market 05446
- Home prices YoY
- -24.4%
- Active inventory
- 89
- Price-to-rent
- 4.4×
Monthly cashflow live
- Estimated rent
- $2,194 medium interval (Pro) →
- Mortgage (P&I)
- −$603
- Tax from tax record
- −$81 /mo · $972/yr
- Insurance
- −$48
- HOA
- −$519
- Vacancy / Maint / Mgmt
- −$461
- Net cashflow
- $482
Break-even live
UW: 25.0% down · 7.5% · 30yr · 1.5% tax · 5.0% vac · 8.0% maint · 8.0% mgmt
Financing live
Cash to close
- Down payment
- $28,750
- Closing costs
- $3,450
- Reserves months
- —
- Total cash needed
- —
Loan-product check · same deal, 3 products live
Conventional
25% down · 7.5% · 30yr
- Down + closing
- —
- Monthly P&I
- —
- Monthly cashflow
- —
- DSCR
- —
- Eligible?
- —
Personal DTI + credit; lowest rate.
DSCR
20% down · 8.5% · 30yr
- Down + closing
- —
- Monthly P&I
- —
- Monthly cashflow
- —
- DSCR
- —
- Eligible?
- —
No personal income docs; deal must DSCR.
Hard money
10% down · 12.0% · 12mo
- Down + closing
- —
- Monthly P&I
- —
- Monthly cashflow
- —
- DSCR
- —
- Eligible?
- —
Short-term bridge; refi at stabilization.
HOA detail
- Monthly dues
- $519 · $6,228/yr
Listing history 5 events
-
2026-03-24status Pending
-
2026-03-22$115,000 Active
-
2023-05-02soldstatus $46,700
-
2010-08-24soldstatus $45,500
-
2009-04-06soldstatus $53,000
ⓘ Source: listings_history table (triggers on properties + properties_extension) + one-shot
backfill from property_details.listing_events for pre-trigger history.
Tax reassessment forecast VT · Partial reset (capped growth)
- Current annual tax
- $972 · $81/mo
- Projected year-2 tax
- $1,579 · $132/mo
- Expected delta
- +$606/yr (+$51/mo · 62.3%)
ⓘ Screening estimate from a state-policy table — verify with the county assessor before closing.
Climate risk First Street
- Heat 2/10 Low
- Air quality 3/10 Moderate 3 unhealthy d/yr today · 3 by 30 yrs out
Nearby sold comps map
Loading sold comps map…
Walkable amenities ~0.75 mi
Loading nearby amenities…
Taxation est. · year 1
- Rental income
- $26,323
- − Mortgage interest
- −$6,442
- − Property taxes
- −$972
- − Insurance
- −$575
- − Repairs & maintenance
- −$2,106
- − Management
- −$2,106
- − HOA
- −$6,228
- − Depreciation
- −$3,345
- Taxable income
- $4,549
- Est. tax owed @ 24.0%
- −$1,092
- After-tax cash flow
- $4,691/yr
For passive investors: Depreciation is non-cash, so a rental often shows a tax loss while cash-flowing — sheltering income. Rental losses are passive: they offset passive income freely, and up to $25,000/yr can offset ordinary (W-2) income if you actively participate and your MAGI is under $100k (phasing out to $0 by $150k); unused losses carry forward. On sale, claimed depreciation is recaptured at up to 25%, and gains may owe capital-gains tax (a 1031 exchange can defer both). Figures are a year-1 estimate at your 24.0% rate — not tax advice; consult a CPA.
Schools (NCES district)
No district data.
Livability — Winooski
- Score
- 84/100
- State rank
- #5
- US rank
- #831
Category grades
Schools grade is shown separately in the Schools card above.
Census & demographics
- County
- Chittenden County · 110,603 people
- City population
- 8,293
- Metro
- Burlington-South Burlington, VT
- Population (ZIP)
- 16,452
- Household income
- $97,475
- Rent vs Own
- Severe rent burden
- 259.0
Population outlook (Chittenden County) Hauer SSP2
- Today (2025)
- 170,769 people
- By 2030
- 174,716 · +2.3%
- By 2040
- 180,337 · +5.6%
- By 2050
- 183,768 · +7.6%
- By 2075
- 194,646 · +14.0%
- By 2100
- 194,933 · +14.2%
Race, ethnicity, and origin ACS 2023
- Neighborhood character
- Predominantly White (86%)
- Race & ethnicity
- White 86% Two or more races 6% Hispanic / Latino 4% Black 2% Asian 2%
- Common ancestry
- Lithuanian 14% Italian 4% Slovak 3%
- Foreign-born
- 9% · Canada, India, China
- Languages at home
- 91% English-only · French/Haitian/Cajun 2% Other Indo-European 2% Russian/Polish/Slavic 2%
Political lean MEDSL · Chittenden
- 2024 margin
- Solid D (+53.6) · D 75.4% · R 21.7% · Other 2.9%
- 2008→2024 swing
- +8.9pp toward D · 2008: 44.8pp · 2024: 53.6pp
- All cycles
- 2024: D+53.6 2020: D+54.5 2016: D+46.8 2012: D+41.9 2008: D+44.8
Not yet ingested
- Civics
- —
Market trends
- HPI YoY
- ▼ -131.02%
- Current HPI
- 406.7675
- Rent YoY
- —
- Metro
- Burlington-South Burlington, VT
- State GDP YoY
- —
- F500 in state
- 0
Price history
+117.0% since first listed5 events — show timeline
- 2026-03-24 Pending — PrimeMLS
- 2026-03-22 Listed $115,000 PrimeMLS
- 2023-05-02 Sold (Public Records) $46,700 Public Records
- 2010-08-24 Sold (Public Records) $45,500 Public Records
- 2009-04-06 Sold (Public Records) $53,000 Public Records
Property tax history
-0.3%/yrLatest (2024): $972 · +9.9% YoY. Source: county tax records.
Cash-flow waterfall
monthlySold comps — $/sqft
last 12 mo · ≤1 miLoading sold comps…