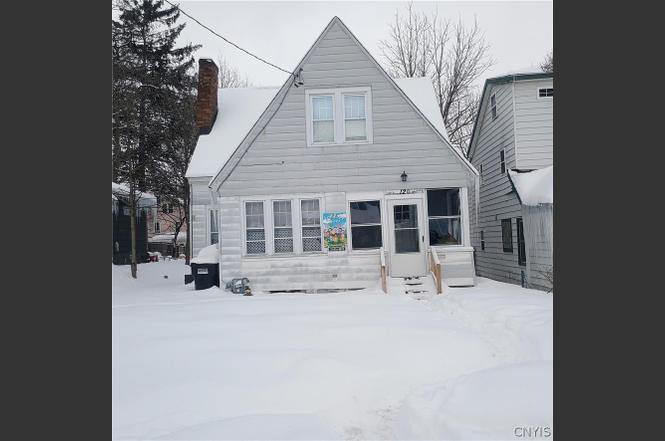
120 Marvin Rd · Syracuse, NY
Flood risk 1/10 · Minimal
- FEMA flood zone
- X (unshaded)
- Chance of flooding over 30 yrs
- 0.0%
- Est. flood insurance / yr
- $473 – $860
Fire risk 1/10 · Minimal
- Est. fire insurance / yr
- $691 – $1,283
Heat risk 3/10 · Minor
- Hot days now (above 95°F)
- 7 days/yr
- Hot days in 30 yrs
- 16 days/yr
Wind risk 1/10 · Minimal
- Chance of severe wind over 30 yrs
- 0.0%
Air-quality risk 2/10 · Minimal
- Unhealthy air days now
- 0 days/yr
- Unhealthy air days in 30 yrs
- 1 days/yr
Risk factors via First Street. Map © Google.
Why this score? — see what drove the B+ grade
The composite is a weighted blend of 9 inputs, each scored 0–100. Each bar is that input's sub-score; the figure is the points it added to the 100-point composite (weight × sub-score).
- Cash flow +30.0/30.0
- ARV discount +15.0/15.0
- 1% rule +10.0/10.0
- DSCR +10.0/10.0
- Livability +3.9/5.0
- Rent growth +2.5/5.0
- Condition / age +2.5/5.0
- Schools +1.8/10.0
- Appreciation +0.0/10.0
$90,000
🖨 Deal sheet 📄 Offer letter ✓ Due diligence
Listing remarks MLS
Valley area 2 story needs your tlc. spacious rooms, deep yard
Key facts
- Newer roof
- Cape cod layout
- 5,522 sq ft lot
Tags
Neighborhood map
What this means for you Summary
Snapshot
- This is a 3-bed/1.0-bath single-family listed at $90k.
Deal economics
- At list price, monthly cash flow is $640 ($8k/yr) — positive.
- The deal already cash-flows at list — no discount required.
- Meets the 1% rule at list price ($2k rent vs $90k).
- Recommended offer: $87k (3.0% below list) — sets the bar for market timing.
- Cap rate 14.8% vs local median 8.2% in Syracuse — top-decile yield for the area; either an underpriced asset or a hidden risk that comps aren't pricing in. Stress-test before assuming the spread holds.
Location & tenants
- Location reads 77/100 on livability (#187 in NY, #2,869 nationally) — a middle-class / working-renter tenant base. Strengths: amenities A+, commute A+, cost of living A+; Watch: schools D+, crime F, employment D-.
- Syracuse City School District (urban): math 18% / reading 26% proficiency, ranked #590 of 590 in NY (top 100%) — low school quality limits family demand, transient renter base, plan for 1-2y turnover; 74% free/reduced lunch — lower-income household profile, screen leases tightly.
- Market conditions: 63 active listings in the ZIP; 10 comparable units currently listed for rent nearby; rentals leasing fast (median 14d on market — plan ~1-2 weeks tenant-placement turnaround); 616 units permitted in Onondaga County in 2024 (256 in 5+ unit buildings).
Forward outlook
- Local home prices are declining (-3.0%/yr); year-one equity from $622 of loan paydown is wiped out by about $3k of value loss. Plan a longer hold.
- Onondaga County population projected to shrink 9% by 2050 — rents likely to lag national; underwrite the cash flow, not the appreciation.
- At projected returns (-3.0% appreciation + 3.0% rent growth), your $25k cash investment doubles in ~4 years — after that, you're playing with house money.
Negotiation context
- It's been on market 34 days — a 3% lower offer ($87k) is reasonable based on typical stale-listing flexibility.
- 2 sale attempts since 11y ago with the ask held roughly flat each time — persistent listings suggest the price (not the market) is what's stuck; bring a comps-based counter.
- Current owner paid $60k; list at $90k implies a 50% gain — meaningful room to come down on a strong offer.
Risks & watch-outs
- Watch-outs: built in 1935 — expect roof / HVAC / electrical / plumbing capex.
Questions for the listing agent
- It's been on market 34 days. Have you received any prior offers? Is the seller open to a 3% concession, seller financing, or rate buy-down credit?
- Built in 1935 — when were the roof, HVAC, electrical panel, plumbing, and water heater last replaced?
- Is there a deadline driving the sale (1031 exchange, divorce, estate, relocation)? That informs how much negotiation room exists.
- Schools are D-rated, which usually means shorter tenancies and higher turnover. Who's the typical renter profile here, and what's been the actual vacancy rate?
- Crime grade is F in this area — have there been break-ins, vandalism, or insurance claims at this property in the last 3 years? What carrier currently insures it and at what premium?
- What's the average days-on-market for RENTAL listings here right now (not sales)? A rising rental-DOM trend means longer vacancies and softer asking-rent achievability than the comps imply.
- What's the recent tenant-quality profile in this submarket — average credit score on applications, eviction rate, late-payment / NSF rate, and stable-employment percentage? A property-management company in the area should have these aggregated.
- How much new for-sale + rental construction is in the pipeline within 1–3 miles? Heavy new supply typically softens prices + rents 12–24 months out; constrained supply supports both.
Investment metrics
- 1% rule
- 1.75% ✓
- Cap rate
- 14.83%
- Cash-on-cash
- 30.48%
- DSCR
- 2.36
- GRM
- 4.8
CMA / ARV
- ARV (on-the-fly)
- $138,764
- Comps found
- 12
Show comp detail 12 sales within ~0.75 mi
| Address | Dist | Beds/Ba | Sqft | Sold | Price | $/sf | Match |
|---|---|---|---|---|---|---|---|
| 160 Berger Ave | 0.32mi | 3/1.0 | 1,162 (-5%) | 0mo | $35,000 | $30 | 76 |
| 109 Smith Rd | 0.56mi | 2/1.0 (-1) | 1,244 (+1%) | 2mo | $155,500 | $125 | 66 |
| 144 Oakdale Dr | 0.35mi | 3/1.5 | 1,344 (+9%) | 1mo | $72,000 | $54 | 65 |
| 160 Baldwin Ave | 0.28mi | 2/1.0 (-1) | 1,104 (-10%) | 4mo | $75,000 | $68 | 62 |
| 604 W Ostrander Ave | 0.33mi | 2/2.5 (-1) | 1,320 (+8%) | 1mo | $201,000 | $152 | 60 |
| 141 Charmouth Dr | 0.68mi | 3/1.5 | 1,248 (+2%) | 4mo | $65,000 | $52 | 60 |
| 122 Charmouth Dr | 0.69mi | 3/1.0 | 1,286 (+5%) | 1mo | $187,500 | $146 | 59 |
| 403 Pacific Ave | 0.45mi | 2/1.0 (-1) | 1,331 (+8%) | 3mo | $130,000 | $98 | 57 |
| 218 Girard Ave | 0.38mi | 2/1.0 (-1) | 1,080 (-12%) | 3mo | $123,750 | $115 | 55 |
| 721 Ballantyne Rd | 0.39mi | 2/1.5 (-1) | 1,047 (-15%) | 1mo | $130,000 | $124 | 50 |
| 122 Maxwell Ave | 0.41mi | 3/2.0 | 1,410 (+15%) | 4mo | $160,000 | $113 | 49 |
| 142 Maxwell Ave | 0.41mi | 4/2.0 (+1) | 1,392 (+13%) | 4mo | $122,500 | $88 | 47 |
Match score weights: distance 35% · size 25% · config 20% · recency 20%. Top-matched comps best support the ARV.
Projected returns pro-forma
-3.0% appreciation · 3.0% rent growth · sell at horizon
- IRR
- 25.2%
- Equity multiple
- 2.04×
- Total profit
- $26,201
- Equity at exit
- $13,419
- IRR
- 32.9%
- Equity multiple
- 3.99×
- Total profit
- $75,368
- Equity at exit
- $7,782
Cash invested: $25,200 (down + closing). Projections, not guarantees.
Landlord ↔ Tenant lean methodology
- Overall (STATE)
- 15 Strongly Tenant-Friendly
- State New York
- 15 Strongly Tenant-Friendly · D+10
- County
- — inherits STATE
- City
- — inherits STATE
ZIP-level market 13207
- Home prices YoY
- -23.0%
- Active inventory
- 63
- Price-to-rent
- 4.8×
Monthly cashflow live
- Estimated rent
- $1,574 high interval (Pro) →
- Mortgage (P&I)
- −$472
- Tax from tax record
- −$94 /mo · $1,128/yr
- Insurance
- −$38
- HOA
- −$0
- Vacancy / Maint / Mgmt
- −$331
- Net cashflow
- $640
Break-even live
UW: 25.0% down · 7.5% · 30yr · 1.5% tax · 5.0% vac · 8.0% maint · 8.0% mgmt
Financing live
Cash to close
- Down payment
- $22,500
- Closing costs
- $2,700
- Reserves months
- —
- Total cash needed
- —
Loan-product check · same deal, 3 products live
Conventional
25% down · 7.5% · 30yr
- Down + closing
- —
- Monthly P&I
- —
- Monthly cashflow
- —
- DSCR
- —
- Eligible?
- —
Personal DTI + credit; lowest rate.
DSCR
20% down · 8.5% · 30yr
- Down + closing
- —
- Monthly P&I
- —
- Monthly cashflow
- —
- DSCR
- —
- Eligible?
- —
No personal income docs; deal must DSCR.
Hard money
10% down · 12.0% · 12mo
- Down + closing
- —
- Monthly P&I
- —
- Monthly cashflow
- —
- DSCR
- —
- Eligible?
- —
Short-term bridge; refi at stabilization.
Rent comps 10 comps
| Address | Beds | Baths | Sqft | Rent | $/sqft | DOM | Units | Dist |
|---|---|---|---|---|---|---|---|---|
| 300 Mains Ave Unit Bradford-7 Syracuse, NY | 2.0 | 1.0 | 1200 | $1,100 | $0.92 | 13d | 1 | 0.41mi |
| 213 Fletcher Ave Unit 2 Syracuse, NY | 3.0 | 1.0 | 1200 | $1,700 | $1.42 | 13d | 1 | 0.44mi |
| 508-10 W Brighton Ave Syracuse, NY | 2.0 | 1.0 | 735 | $1,350 | $1.84 | 13d | 13 | 0.63mi |
| 158 Parkway Dr Syracuse, NY | 4.0 | 3.0 | 1029 | $2,250 | $2.19 | 21d | 1 | 0.88mi |
| 147 E Matson Ave Syracuse, NY | 3.0 | 2.5 | 1421 | $2,000 | $1.41 | 21d | 1 | 0.98mi |
| 154 Seeley Ave Syracuse, NY | 4.0 | 1.0 | 1312 | $2,100 | $1.60 | 13d | 1 | 0.98mi |
| 2859 S Salina St Unit 2 Syracuse, NY | 2.0 | 1.0 | 1000 | $1,200 | $1.20 | 43d | 1 | 1.00mi |
| 102 Newbury Hollow Ln Syracuse, NY | 2.0 | 1.5 | 1200 | $1,550 | $1.29 | 13d | 1 | 1.24mi |
| 116 Newbury Hollow Ln Syracuse, NY | 1.0–2.0 | 1.0 | 825 | $1,295 | $1.57 | 13d | 7 | 1.37mi |
| 409 Stolp Ave Syracuse, NY | 1.0–3.0 | 1.0 | 849 | $1,575 | $1.86 | 13d | 5 | 1.37mi |
Listing history 11 events
-
2026-04-01status Pending
-
2026-03-20historical Active Under Contract
-
2026-02-25$90,000 Active
-
2021-07-29soldstatus $60,000
-
2016-02-12soldstatus $22,000 Closed Sale or Rented 61-char remark
Show marketing remark (61 chars)
Valley area 2 story needs your tlc. spacious rooms, deep yard
-
2016-01-26historical Under Contract- Do Not Show 61-char remark
Show marketing remark (61 chars)
Valley area 2 story needs your tlc. spacious rooms, deep yard
-
2016-01-09price $28,900 61-char remark
Show marketing remark (61 chars)
Valley area 2 story needs your tlc. spacious rooms, deep yard
-
2015-12-18price $31,900 61-char remark
Show marketing remark (61 chars)
Valley area 2 story needs your tlc. spacious rooms, deep yard
-
2015-11-18$35,000 Active 61-char remark
Show marketing remark (61 chars)
Valley area 2 story needs your tlc. spacious rooms, deep yard
-
2005-01-31soldstatus $30,000
-
2002-09-17soldstatus $59,000
ⓘ Source: listings_history table (triggers on properties + properties_extension) + one-shot
backfill from property_details.listing_events for pre-trigger history.
Tax reassessment forecast NY · Partial reset (capped growth)
- Current annual tax
- $1,128 · $94/mo
- Projected year-2 tax
- $1,325 · $110/mo
- Expected delta
- +$196/yr (+$16/mo · 17.4%)
ⓘ Screening estimate from a state-policy table — verify with the county assessor before closing.
Climate risk First Street
- Flood 1/10 Low FEMA zone X (unshaded) · 0% chance over 30 yrs
- Wildfire 1/10 Low
- Heat 3/10 Moderate 7 d/yr ≥95°F today · 16 d/yr by 30 yrs out
- Wind 1/10 Low 0% chance of damaging wind over 30 yrs
- Air quality 2/10 Low 0 unhealthy d/yr today · 1 by 30 yrs out
Nearby sold comps map
Loading sold comps map…
Walkable amenities ~0.75 mi
Loading nearby amenities…
Taxation est. · year 1
- Rental income
- $18,891
- − Mortgage interest
- −$5,041
- − Property taxes
- −$1,128
- − Insurance
- −$450
- − Repairs & maintenance
- −$1,511
- − Management
- −$1,511
- − Depreciation
- −$2,618
- Taxable income
- $6,631
- Est. tax owed @ 24.0%
- −$1,591
- After-tax cash flow
- $6,091/yr
For passive investors: Depreciation is non-cash, so a rental often shows a tax loss while cash-flowing — sheltering income. Rental losses are passive: they offset passive income freely, and up to $25,000/yr can offset ordinary (W-2) income if you actively participate and your MAGI is under $100k (phasing out to $0 by $150k); unused losses carry forward. On sale, claimed depreciation is recaptured at up to 25%, and gains may owe capital-gains tax (a 1031 exchange can defer both). Figures are a year-1 estimate at your 24.0% rate — not tax advice; consult a CPA.
Schools (NCES district)
- District
- Syracuse City School District
- NCES district ID
- 3628590
- Math proficiency
- 18% ▼ -5.00%
- Reading proficiency
- 26% ▬ 0.00%
- Median HH income
- $32,097
- Composite
- 17.83/100
- National rank
- #9007
- State rank
- #590 of 590 in NY
Livability — Syracuse
- Score
- 77/100
- State rank
- #187
- US rank
- #2869
Category grades
Schools grade is shown separately in the Schools card above.
Census & demographics
- Census place
- Syracuse, NY
- City population
- 152,627
- Population (ZIP)
- 12,383
Population outlook (Onondaga County) Hauer SSP2
- Today (2025)
- 467,894 people
- By 2030
- 463,381 · -1.0%
- By 2040
- 447,697 · -4.3%
- By 2050
- 426,399 · -8.9%
- By 2075
- 373,661 · -20.1%
- By 2100
- 307,967 · -34.2%
Race, ethnicity, and origin ACS 2023
- Neighborhood character
- Diverse neighborhood (Simpson 0.68)
- Race & ethnicity
- White 43% Black 33% Hispanic / Latino 17% Two or more races 11% Native American 1% Asian 1%
- Hispanic origin (detail)
- Puerto Rican 13% Cuban 1%
- Common ancestry
- Romanian 3% Lithuanian 1% Slovak 1%
- Foreign-born
- 4% · Canada, South Korea
- Languages at home
- 89% English-only · Spanish 9% French/Haitian/Cajun 1%
Political lean MEDSL · Onondaga
- 2024 margin
- D (+17.3) · D 58.6% · R 41.4%
- 2008→2024 swing
- -3.0pp toward R · 2008: 20.3pp · 2024: 17.3pp
- All cycles
- 2024: D+17.3 2020: D+20.6 2016: D+12.8 2012: D+21.1 2008: D+20.3
Not yet ingested
- Civics
- —
Market trends
- HPI YoY
- ▼ -95.17%
- Current HPI
- 318.9257
- Rent YoY
- —
- Metro
- —
- State GDP YoY
- ▲ 2.60%
- F500 in state
- 92
Industry mix (Fortune 500 HQ in NY)
| Industry | F500 HQs | Revenue |
|---|---|---|
| Financial Services | 10 | $950B |
|
||
| Consumer Goods | 9 | $162B |
|
||
| Insurance | 4 | $225B |
|
||
| Telecommunications | 2 | $144B |
|
||
| Pharmaceuticals | 2 | $112B |
|
||
| Media / Entertainment | 2 | $69B |
|
||
Price history
+52.5% since first listed11 events — show timeline
- 2026-04-01 Pending — CNYIS
- 2026-03-20 Contingent — CNYIS
- 2026-02-25 Listed $90,000 CNYIS
- 2021-07-29 Sold (Public Records) $60,000 Public Records
- 2016-02-12 Sold (MLS) $22,000 CNYIS
- 2016-01-26 Contingent — CNYIS
- 2016-01-09 Price Changed $28,900 CNYIS
- 2015-12-18 Price Changed $31,900 CNYIS
- 2015-11-18 Listed $35,000 CNYIS
- 2005-01-31 Sold (Public Records) $30,000 Public Records
- 2002-09-17 Sold (Public Records) $59,000 Public Records
Property tax history
-0.5%/yrLatest (2025): $1,128 · +0.0% YoY. Source: county tax records.
Cash-flow waterfall
monthlySold comps — $/sqft
last 12 mo · ≤1 miLoading sold comps…