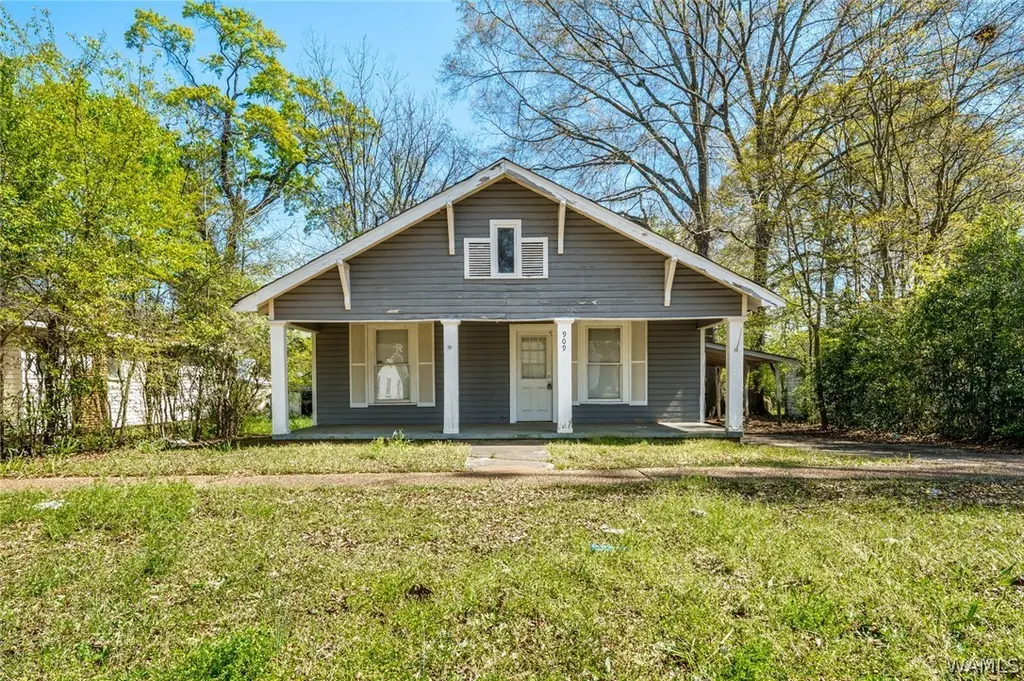
909 35th Ave · Tuscaloosa, AL
Flood risk 1/10 · Minimal
- FEMA flood zone
- X (unshaded)
- Chance of flooding over 30 yrs
- 0.0%
- Est. flood insurance / yr
- $507 – $1,088
Fire risk 1/10 · Minimal
- Est. fire insurance / yr
- $916 – $1,700
Heat risk 8/10 · Major
- Hot days now (above 108°F)
- 7 days/yr
- Hot days in 30 yrs
- 21 days/yr
Wind risk 6/10 · Moderate
- Chance of severe wind over 30 yrs
- 56.0%
Air-quality risk 1/10 · Minimal
- Unhealthy air days now
- 0 days/yr
- Unhealthy air days in 30 yrs
- 0 days/yr
Risk factors via First Street. Map © Google.
Why this score? — see what drove the B+ grade
The composite is a weighted blend of 9 inputs, each scored 0–100. Each bar is that input's sub-score; the figure is the points it added to the 100-point composite (weight × sub-score).
- Cash flow +30.0/30.0
- ARV discount +12.5/15.0
- 1% rule +10.0/10.0
- DSCR +10.0/10.0
- Rent growth +4.1/5.0
- Livability +3.9/5.0
- Schools +2.5/10.0
- Condition / age +2.5/5.0
- Appreciation +0.0/10.0
$78,000
🖨 Deal sheet 📄 Offer letter ✓ Due diligence
Listing remarks
Great investment opportunity! Home being sold as-is! Needs improvement. Priced to sell! Call your favorite realtor today to schedule showing! All information deemed reliable, but not guaranteed. Buyer(s) and/or Buyer's Agent responsible for verifying all information on property.
Key facts
- 8,276 sq ft lot
- Built 1910
- Listed 6 days
Property features AI
Exterior
- Parking: Concrete driveway
- Utilities: Sewer connected
- Home design: Single-family home; One level; Located in the Prospect Park subdivision
- Construction: Vinyl siding; Composition/shingle roof; Built as a residential single-family structure
- Exterior features: Paved road access
Interior
- Bathrooms: 2 full bathrooms
- Heating & cooling: Central heating; Central air conditioning
- Interior features: Water heater; No fireplace
- Laundry & utility: Laundry closet
Neighborhood map
What this means for you Summary
Snapshot
- This is a 3-bed/2.0-bath single-family listed at $78k.
Deal economics
- At list price, monthly cash flow is $563 ($7k/yr) — positive.
- The deal already cash-flows at list — no discount required.
- Meets the 1% rule at list price ($1k rent vs $78k).
- Cap rate 14.9% vs local median 3.4% in Tuscaloosa — top-decile yield for the area; either an underpriced asset or a hidden risk that comps aren't pricing in. Stress-test before assuming the spread holds.
Location & tenants
- Location reads 77/100 on livability (#9 in AL, #2,909 nationally) — a middle-class / working-renter tenant base. Strengths: amenities A+, health & safety A+, cost of living A; Watch: crime F, employment D-.
- Tuscaloosa City (urban): math 19% / reading 40% proficiency, ranked #74 of 129 in AL (top 57%) — low school quality limits family demand, transient renter base, plan for 1-2y turnover.
- Zoned schools: Central Elementary School (math 2% / reading 22%, grade F, #536 of 627 statewide, top 88%, 297 students, 85% FRL); Westlawn Middle School (math 0% / reading 18%, grade F, #235 of 257 statewide, top 93%, 534 students, 93% FRL); Central High School (math 12% / reading 17%, grade F, #220 of 305 statewide, top 77%, 783 students, 84% FRL) — zoned schools average 87% FRL vs 59% district-wide (28 pts higher); higher-poverty schools than district average — tighter screening recommended.
- Zoned-school proficiency averages 12% at this address vs 30% district-wide (-18 pts) — the specific schools serving this property underperform the Tuscaloosa City average; the district grade overstates school quality for this exact location.
- Market conditions: Rents rising fast (+6.3%/yr); 306 active listings in the ZIP; 17 comparable units currently listed for rent nearby; rentals at typical pace (median 21d on market — plan ~3-4 weeks tenant-placement turnaround); 47% of comp listings sitting > 30 days — soft ceiling on asking rent; lower-income renter base — watch delinquency; 622 units permitted in Tuscaloosa County in 2024 (69 in 5+ unit buildings).
- At $1,322/mo this rent would consume 54% of the median local household income ($29k/yr) (locally 3997% of renters already pay >50% of income on rent) — very limited rent-growth headroom before tenants either downsize or default.
Forward outlook
- Local home prices are declining (-3.0%/yr); year-one equity from $539 of loan paydown is wiped out by about $2k of value loss. Plan a longer hold.
- Tuscaloosa County population projected at +26% by 2050 — long-run rental-demand tailwind backs the buy-and-hold thesis.
- At projected returns (-3.0% appreciation + 6.3% rent growth), your $22k cash investment doubles in ~4 years — after that, you're playing with house money.
Negotiation context
- Only 6 days on market — expect competitive offers; lowballing is unlikely to land.
- Current owner paid $65k; 20% above their basis — modest negotiation headroom, anchor on the comps not their cost.
Risks & watch-outs
- Watch-outs: built in 1910 — expect roof / HVAC / electrical / plumbing capex.
- Climate carrying-cost: major wind risk, 56% chance of damaging wind over 30y; extreme-heat days projected 7→21/yr by 2055 (HVAC capex compounding) — expect insurance premiums to compound above CPI over the hold.
Questions for the listing agent
- Built in 1910 — when were the roof, HVAC, electrical panel, plumbing, and water heater last replaced?
- Is there a deadline driving the sale (1031 exchange, divorce, estate, relocation)? That informs how much negotiation room exists.
- Crime grade is F in this area — have there been break-ins, vandalism, or insurance claims at this property in the last 3 years? What carrier currently insures it and at what premium?
- What's the average days-on-market for RENTAL listings here right now (not sales)? A rising rental-DOM trend means longer vacancies and softer asking-rent achievability than the comps imply.
- What's the recent tenant-quality profile in this submarket — average credit score on applications, eviction rate, late-payment / NSF rate, and stable-employment percentage? A property-management company in the area should have these aggregated.
- How much new for-sale + rental construction is in the pipeline within 1–3 miles? Heavy new supply typically softens prices + rents 12–24 months out; constrained supply supports both.
Investment metrics
- 1% rule
- 1.69% ✓
- Cap rate
- 14.95%
- Cash-on-cash
- 30.92%
- DSCR
- 2.38
- GRM
- 4.9
CMA / ARV
- ARV (median comp)
- $87,695
- List price
- $78,000
- Delta
- -11.06%
- Verdict
- UNDERPRICED
- Comps
- 20 within 1.0 mi
Show comp detail 12 sales within ~0.75 mi
| Address | Dist | Beds/Ba | Sqft | Sold | Price | $/sf | Match |
|---|---|---|---|---|---|---|---|
| 909 35th Ave | 0.00mi | 3/2.0 | 1,176 (0%) | 1mo | $65,000 | $55 | 100 |
| 3009 Short 19th | 0.61mi | 3/1.5 | 1,145 (-3%) | 8mo | $66,122 | $58 | 59 |
| 3204 5th St | 0.42mi | 2/2.0 (-1) | 1,231 (+5%) | 12mo | $145,000 | $118 | 58 |
| 4B Country Club Hills Hls | 0.42mi | 3/1.5 | 1,302 (+11%) | 7mo | $225,000 | $173 | 55 |
| 3207 16th St | 0.27mi | 3/2.0 | 1,316 (+12%) | 16mo | $120,000 | $91 | 54 |
| 2317 Herman Ave | 0.72mi | 3/2.0 | 1,196 (+2%) | 14mo | $170,000 | $142 | 52 |
| 3580 21st St | 0.55mi | 3/2.0 | 1,274 (+8%) | 13mo | $178,900 | $140 | 49 |
| 3202 5th St | 0.42mi | 3/1.0 | 1,025 (-13%) | 11mo | $165,000 | $161 | 46 |
| 1707 28th Ave | 0.69mi | 4/2.0 (+1) | 1,260 (+7%) | 9mo | $189,900 | $151 | 43 |
| 1211 Ty Rogers Jr Ave Ave | 0.70mi | 3/2.5 | 1,326 (+13%) | 4mo | $112,300 | $85 | 41 |
| 3018 20th St | 0.62mi | 2/1.0 (-1) | 1,062 (-10%) | 10mo | $60,000 | $56 | 37 |
| 4120 19th St | 0.65mi | 4/2.0 (+1) | 1,288 (+10%) | 15mo | $130,000 | $101 | 36 |
Match score weights: distance 35% · size 25% · config 20% · recency 20%. Top-matched comps best support the ARV.
Projected returns pro-forma
-3.0% appreciation · 6.29% rent growth · sell at horizon
- IRR
- 29.2%
- Equity multiple
- 2.27×
- Total profit
- $27,704
- Equity at exit
- $11,630
- IRR
- 38.3%
- Equity multiple
- 5.12×
- Total profit
- $90,055
- Equity at exit
- $6,744
Cash invested: $21,840 (down + closing). Projections, not guarantees.
Landlord ↔ Tenant lean methodology
- Overall (STATE)
- 90 Strongly Landlord-Friendly
- State Alabama
- 90 Strongly Landlord-Friendly · R+15
- County
- — inherits STATE
- City
- — inherits STATE
ZIP-level market 35401
- Rents YoY
- 6.3%
- Active inventory
- 306
- Price-to-rent
- 4.9×
Monthly cashflow live
- Estimated rent
- $1,322 high interval (Pro) →
- Mortgage (P&I)
- −$409
- Tax from tax record
- −$40 /mo · $480/yr
- Insurance
- −$32
- HOA
- −$0
- Vacancy / Maint / Mgmt
- −$278
- Net cashflow
- $563
Break-even live
UW: 25.0% down · 7.5% · 30yr · 1.5% tax · 5.0% vac · 8.0% maint · 8.0% mgmt
Financing live
Cash to close
- Down payment
- $19,500
- Closing costs
- $2,340
- Reserves months
- —
- Total cash needed
- —
Loan-product check · same deal, 3 products live
Conventional
25% down · 7.5% · 30yr
- Down + closing
- —
- Monthly P&I
- —
- Monthly cashflow
- —
- DSCR
- —
- Eligible?
- —
Personal DTI + credit; lowest rate.
DSCR
20% down · 8.5% · 30yr
- Down + closing
- —
- Monthly P&I
- —
- Monthly cashflow
- —
- DSCR
- —
- Eligible?
- —
No personal income docs; deal must DSCR.
Hard money
10% down · 12.0% · 12mo
- Down + closing
- —
- Monthly P&I
- —
- Monthly cashflow
- —
- DSCR
- —
- Eligible?
- —
Short-term bridge; refi at stabilization.
Rent comps 17 comps
| Address | Beds | Baths | Sqft | Rent | $/sqft | DOM | Units | Dist |
|---|---|---|---|---|---|---|---|---|
| 3316 16th St Tuscaloosa, AL | 3.0 | 1.0 | 1120 | $1,100 | $0.98 | 13d | 1 | 0.16mi |
| 711 36th Ave Tuscaloosa, AL | 2.0 | 1.0 | 920 | $900 | $0.98 | 13d | 1 | 0.19mi |
| 3008 7th St Tuscaloosa, AL | 2.0 | 1.0 | 840 | $900 | $1.07 | 43d | 1 | 0.37mi |
| 3524 20th St Tuscaloosa, AL | 3.0 | 1.0 | 1050 | $1,100 | $1.05 | 43d | 1 | 0.52mi |
| 3560 21st St Tuscaloosa, AL | 3.0 | 2.0 | 1230 | $1,570 | $1.28 | 20d | 1 | 0.57mi |
| 2405 Herman Ave Tuscaloosa, AL | 4.0 | 1.0 | 971 | $1,100 | $1.13 | 43d | 1 | 0.78mi |
| 1018 42nd Ave Tuscaloosa, AL | 3.0 | 1.0 | 1080 | $1,375 | $1.27 | 13d | 1 | 0.78mi |
| 2712 22nd St Tuscaloosa, AL | 4.0 | 2.0 | 1008 | $1,000 | $0.99 | 43d | 1 | 0.90mi |
| 2720 21st St Tuscaloosa, AL | 4.0 | 1.0 | 1148 | $1,100 | $0.96 | 20d | 1 | 0.95mi |
| 2683 21st St Tuscaloosa, AL | 3.0 | 1.0 | 1324 | $895 | $0.68 | 20d | 1 | 0.96mi |
| 2825 25th St Tuscaloosa, AL | 2.0 | 1.0 | 708 | $835 | $1.18 | 43d | 1 | 0.97mi |
| 2209 9th St #401 Tuscaloosa, AL | 2.0 | 2.0 | 1304 | $1,650 | $1.27 | 43d | 1 | 1.00mi |
| 1920 5th St Northport, AL | 1.0–2.0 | 1.0 | 892 | $1,125 | $1.26 | 20d | 3 | 1.23mi |
| 301 19th Ave Tuscaloosa, AL | 2.0 | 2.5 | 1200 | $2,200 | $1.83 | 20d | 1 | 1.36mi |
| 1505 18th St Tuscaloosa, AL | 2.0 | 2.0 | 700 | $1,000 | $1.43 | 43d | 1 | 1.42mi |
| 1510 9th St #113 Tuscaloosa, AL | 2.0 | 2.0 | 1025 | $1,625 | $1.59 | 20d | 1 | 1.43mi |
| 3416 36th Ct Tuscaloosa, AL | 3.0 | 2.0 | 1206 | $1,395 | $1.16 | 43d | 1 | 1.43mi |
Listing history 2 events
-
2026-05-18status Pending 279-char remark
-
2026-05-11$78,000 Active 279-char remark
ⓘ Source: listings_history table (triggers on properties + properties_extension) + one-shot
backfill from property_details.listing_events for pre-trigger history.
Tax reassessment forecast AL · Resets to sale price
- Current annual tax
- $480 · $40/mo
- Projected year-2 tax
- $480 · $40/mo
- Expected delta
- $0/yr ($0/mo · 0.0%)
ⓘ Screening estimate from a state-policy table — verify with the county assessor before closing.
Climate risk First Street
- Flood 1/10 Low FEMA zone X (unshaded) · 0% chance over 30 yrs
- Wildfire 1/10 Low
- Heat 8/10 Severe 7 d/yr ≥108°F today · 21 d/yr by 30 yrs out
- Wind 6/10 Major 56% chance of damaging wind over 30 yrs
- Air quality 1/10 Low 0 unhealthy d/yr today · 0 by 30 yrs out
Nearby sold comps map
Loading sold comps map…
Walkable amenities ~0.75 mi
Loading nearby amenities…
Taxation est. · year 1
- Rental income
- $15,862
- − Mortgage interest
- −$4,369
- − Property taxes
- −$480
- − Insurance
- −$390
- − Repairs & maintenance
- −$1,269
- − Management
- −$1,269
- − Depreciation
- −$2,269
- Taxable income
- $5,816
- Est. tax owed @ 24.0%
- −$1,396
- After-tax cash flow
- $5,357/yr
For passive investors: Depreciation is non-cash, so a rental often shows a tax loss while cash-flowing — sheltering income. Rental losses are passive: they offset passive income freely, and up to $25,000/yr can offset ordinary (W-2) income if you actively participate and your MAGI is under $100k (phasing out to $0 by $150k); unused losses carry forward. On sale, claimed depreciation is recaptured at up to 25%, and gains may owe capital-gains tax (a 1031 exchange can defer both). Figures are a year-1 estimate at your 24.0% rate — not tax advice; consult a CPA.
Schools (NCES district)
- District
- Tuscaloosa City
- NCES district ID
- 0103360
- Math proficiency
- 19% ▼ -24.00%
- Reading proficiency
- 40% ▼ -1.00%
- Median HH income
- $37,474
- Composite
- 24.51/100
- National rank
- #7647
- State rank
- #74 of 129 in AL
Livability — Tuscaloosa
- Score
- 77/100
- State rank
- #9
- US rank
- #2909
Category grades
Schools grade is shown separately in the Schools card above.
Census & demographics
- Census place
- Tuscaloosa, AL
- County
- Tuscaloosa County · 206,491 people
- City population
- 134,228
- Metro
- Tuscaloosa, AL
- Population (ZIP)
- 43,459
- Household income
- $29,152
- Rent vs Own
- Severe rent burden
- 3997.0
Population outlook (Tuscaloosa County) Hauer SSP2
- Today (2025)
- 228,293 people
- By 2030
- 240,551 · +5.4%
- By 2040
- 263,856 · +15.6%
- By 2050
- 286,491 · +25.5%
- By 2075
- 335,783 · +47.1%
- By 2100
- 370,520 · +62.3%
Race, ethnicity, and origin ACS 2023
- Neighborhood character
- Diverse neighborhood (Simpson 0.58)
- Race & ethnicity
- Black 47% White 44% Hispanic / Latino 5% Two or more races 4% Asian 2%
- Common ancestry
- Slovak 2% Italian 1% Romanian 1%
- Foreign-born
- 3% · Canada, China
- Languages at home
- 96% English-only · Spanish 2% Other Indo-European 1% Chinese 1%
Political lean MEDSL · Tuscaloosa
- 2024 margin
- Strong R (+20.4) · D 39.4% · R 59.8%
- 2008→2024 swing
- -4.4pp toward R · 2008: -16.0pp · 2024: -20.4pp
- All cycles
- 2024: R+20.4 2020: R+14.8 2016: R+19.5 2012: R+17.4 2008: R+16.0
Not yet ingested
- Civics
- —
Market trends
- HPI YoY
- ▼ -191.40%
- Current HPI
- 179.8335
- Rent YoY
- ▲ 6.29%
- Metro
- Tuscaloosa, AL
- State GDP YoY
- ▲ 2.94%
- F500 in state
- 4
Industry mix (Fortune 500 HQ in AL)
| Industry | F500 HQs | Revenue |
|---|---|---|
| Financial Services | 1 | $8B |
|
||
| Healthcare | 1 | $5B |
|
||
Price history
-16.7% since first listed4 events — show timeline
- 2026-06-04 Sold (Public Records) $65,000 Public Records
- 2026-06-01 Sold (MLS) $65,000 WAMLS
- 2026-05-18 Pending — WAMLS
- 2026-05-11 Listed $78,000 WAMLS
Property tax history
+2.2%/yrLatest (2025): $480 · +6.9% YoY. Source: county tax records.
Cash-flow waterfall
monthlySold comps — $/sqft
last 12 mo · ≤1 miLoading sold comps…