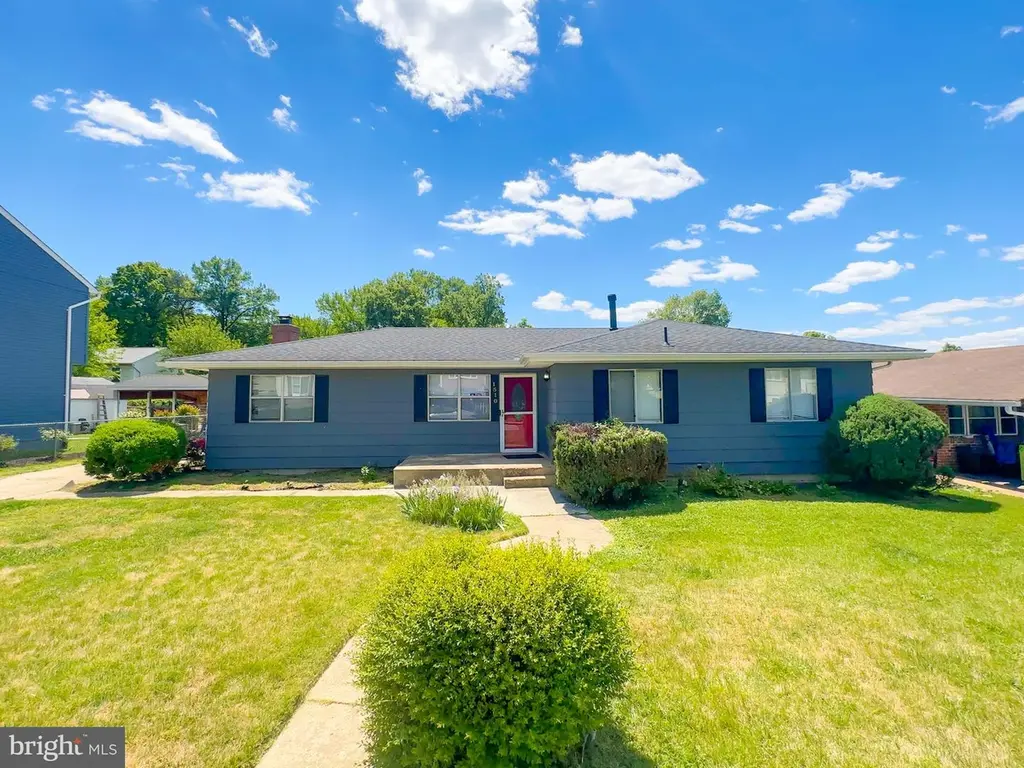
1510 Warren Ave · Landover, MD
Flood risk 1/10 · Minimal
- FEMA flood zone
- X (unshaded)
- Chance of flooding over 30 yrs
- 0.0%
- Est. flood insurance / yr
- $473 – $860
Fire risk 1/10 · Minimal
- Est. fire insurance / yr
- $755 – $1,403
Heat risk 8/10 · Major
- Hot days now (above 104°F)
- 7 days/yr
- Hot days in 30 yrs
- 15 days/yr
Wind risk 4/10 · Minor
- Chance of severe wind over 30 yrs
- 19.0%
Air-quality risk 4/10 · Minor
- Unhealthy air days now
- 4 days/yr
- Unhealthy air days in 30 yrs
- 5 days/yr
Risk factors via First Street. Map © Google.
Why this score? — see what drove the D grade
The composite is a weighted blend of 9 inputs, each scored 0–100. Each bar is that input's sub-score; the figure is the points it added to the 100-point composite (weight × sub-score).
- ARV discount +15.0/15.0
- Cash flow +9.1/30.0
- Rent growth +3.6/5.0
- Livability +3.5/5.0
- 1% rule +2.6/10.0
- DSCR +2.5/10.0
- Condition / age +2.5/5.0
- Schools +1.7/10.0
- Appreciation +0.0/10.0
$340,000
🖨 Deal sheet 📄 Offer letter ✓ Due diligence
Key facts
- 7,841 sq ft lot
- Built 1985
- Listed 3 days
Property features AI
Finance
- Other: Fee simple ownership
Exterior
- Parking: Driveway
- Utilities: Public water; Public sewer
- Home design: Detached structure; Above-grade and below-grade finished living areas
- Construction: Frame construction; Block and concrete perimeter foundation; Estimated year built
- Exterior features: No tidal water
Interior
- Bedrooms: Three bedrooms on the main level; One bedroom on the lower level
- Bathrooms: Two full bathrooms on the main level; One full bathroom on the lower level (total 3 full bathrooms)
- Heating & cooling: Heat pump(s); Electric heating fuel; Cooling (other) with natural gas as cooling fuel; Natural gas hot water
- Interior features: Fireplace (1); Fully finished basement; Other interior features
Neighborhood map
What this means for you Summary
Snapshot
- This is a 4-bed/2.0-bath single-family listed at $340k.
Deal economics
- At list price, monthly cash flow is $-261 ($-3k/yr) — negative.
- To cash-flow at today's rent, offer at most $294k (13.6% below list).
- To meet the 1% rule (rent ≥ 1% of price), the offer needs to be $257k (24.5% below list).
- Recommended offer: $257k (24.5% below list) — sets the bar for 1% rule.
Location & tenants
- Location reads 69/100 on livability (#194 in MD) — a middle-class / working-renter tenant base. Strengths: commute A+, housing A+; Watch: health & safety C-, schools F, crime F.
- Prince George'S County Public Schools (suburban): math 8% / reading 24% proficiency, ranked #21 of 24 in MD (top 88%) — low school quality limits family demand, transient renter base, plan for 1-2y turnover.
- Market conditions: Rents rising fast (+4.3%/yr); 133 active listings in the ZIP; 25 comparable units currently listed for rent nearby; rentals at typical pace (median 19d on market — plan ~3-4 weeks tenant-placement turnaround); solid renter incomes; 1,481 units permitted in Prince George's County in 2024 (0 in 5+ unit buildings).
- This rent runs 36% of the median local income ($86k/yr) — at the standard rent-burdened threshold; future hikes will face affordability resistance.
Forward outlook
- Local home prices are declining (-3.0%/yr); year-one equity from $2k of loan paydown is wiped out by about $10k of value loss. Plan a longer hold.
- Prince George's County population projected at +18% by 2050 — long-run rental-demand tailwind backs the buy-and-hold thesis.
Negotiation context
- Only 3 days on market — expect competitive offers; lowballing is unlikely to land.
Risks & watch-outs
- Climate carrying-cost: extreme-heat days projected 7→15/yr by 2055 (HVAC capex compounding) — expect insurance premiums to compound above CPI over the hold.
Questions for the listing agent
- What do current leases actually rent for vs. the listed asking? Can we see a recent rent roll and the last 12 months of T-12 income?
- Is there a deadline driving the sale (1031 exchange, divorce, estate, relocation)? That informs how much negotiation room exists.
- Schools are F-rated, which usually means shorter tenancies and higher turnover. Who's the typical renter profile here, and what's been the actual vacancy rate?
- Crime grade is F in this area — have there been break-ins, vandalism, or insurance claims at this property in the last 3 years? What carrier currently insures it and at what premium?
- The area grade is low — what's the realistic commute time and amenity access for the typical tenant pool here? Any planned neighborhood developments (good or bad) we should know about?
- What's the average days-on-market for RENTAL listings here right now (not sales)? A rising rental-DOM trend means longer vacancies and softer asking-rent achievability than the comps imply.
- What's the recent tenant-quality profile in this submarket — average credit score on applications, eviction rate, late-payment / NSF rate, and stable-employment percentage? A property-management company in the area should have these aggregated.
- How much new for-sale + rental construction is in the pipeline within 1–3 miles? Heavy new supply typically softens prices + rents 12–24 months out; constrained supply supports both.
Investment metrics
- 1% rule
- 0.76% ✗
- Cap rate
- 5.37%
- Cash-on-cash
- -3.29%
- DSCR
- 0.85
- GRM
- 11.0
CMA / ARV
- ARV (median comp)
- $482,063
- List price
- $340,000
- Delta
- -29.47%
- Verdict
- UNDERPRICED
- Comps
- 20 within 1.0 mi
Show comp detail 7 sales within ~0.75 mi
| Address | Dist | Beds/Ba | Sqft | Sold | Price | $/sf | Match |
|---|---|---|---|---|---|---|---|
| 1009 Consideration Ln | 0.50mi | 4/3.5 | 1,480 (+6%) | 1mo | $460,500 | $311 | 59 |
| 1529 Hunt Ave | 0.03mi | 4/3.0 | 1,600 (+15%) | 13mo | $450,000 | $281 | 58 |
| 1607 Warren Ave | 0.07mi | 3/2.0 (-1) | 1,242 (-11%) | 22mo | $380,000 | $306 | 55 |
| 6800 Camden St | 0.35mi | 4/2.0 | 1,200 (-14%) | 12mo | $420,000 | $350 | 51 |
| 1203 Gondar Ave | 0.38mi | 4/2.0 | 1,248 (-10%) | 23mo | $435,000 | $349 | 46 |
| 1101 Consideration | 0.47mi | 3/4.0 (-1) | 1,500 (+8%) | 12mo | $510,000 | $340 | 42 |
| 2109 Ohio Ave | 0.62mi | 4/2.0 | 1,225 (-12%) | 15mo | $197,500 | $161 | 39 |
Match score weights: distance 35% · size 25% · config 20% · recency 20%. Top-matched comps best support the ARV.
Projected returns pro-forma
-3.0% appreciation · 4.3% rent growth · sell at horizon
- IRR
- -20.4%
- Equity multiple
- 0.28×
- Total profit
- $-68,324
- Equity at exit
- $50,695
- IRR
- -11.0%
- Equity multiple
- 0.30×
- Total profit
- $-66,567
- Equity at exit
- $29,397
Cash invested: $95,200 (down + closing). Projections, not guarantees.
Landlord ↔ Tenant lean methodology
- Overall (STATE)
- 27 Tenant-Leaning
- State Maryland
- 27 Tenant-Leaning · D+14
- County
- — inherits STATE
- City
- — inherits STATE
ZIP-level market 20785
- Home prices YoY
- -30.4%
- Rents YoY
- 4.3%
- Active inventory
- 133
- Price-to-rent
- 11.0×
Monthly cashflow live
- Estimated rent
- $2,568 high interval (Pro) →
- Mortgage (P&I)
- −$1,783
- Tax from tax record
- −$366 /mo · $4,387/yr
- Insurance
- −$142
- HOA
- −$0
- Vacancy / Maint / Mgmt
- −$539
- Net cashflow
- $-261
Break-even live
UW: 25.0% down · 7.5% · 30yr · 1.5% tax · 5.0% vac · 8.0% maint · 8.0% mgmt
Financing live
Cash to close
- Down payment
- $85,000
- Closing costs
- $10,200
- Reserves months
- —
- Total cash needed
- —
Loan-product check · same deal, 3 products live
Conventional
25% down · 7.5% · 30yr
- Down + closing
- —
- Monthly P&I
- —
- Monthly cashflow
- —
- DSCR
- —
- Eligible?
- —
Personal DTI + credit; lowest rate.
DSCR
20% down · 8.5% · 30yr
- Down + closing
- —
- Monthly P&I
- —
- Monthly cashflow
- —
- DSCR
- —
- Eligible?
- —
No personal income docs; deal must DSCR.
Hard money
10% down · 12.0% · 12mo
- Down + closing
- —
- Monthly P&I
- —
- Monthly cashflow
- —
- DSCR
- —
- Eligible?
- —
Short-term bridge; refi at stabilization.
Rent comps 25 comps
| Address | Beds | Baths | Sqft | Rent | $/sqft | DOM | Units | Dist |
|---|---|---|---|---|---|---|---|---|
| 1842 Ryderwood Ct Hyattsville, MD | 4.0 | 3.5 | 1680 | $3,199 | $1.90 | 18d | 1 | 0.24mi |
| 1746 Countrywood Ct Hyattsville, MD | 3.0 | 2.5 | 1296 | $2,450 | $1.89 | 11d | 1 | 0.35mi |
| 1741 Countrywood Ct Hyattsville, MD | 3.0 | 2.0 | 1312 | $2,295 | $1.75 | 24d | 1 | 0.35mi |
| 6706 Central Hills Ter Hyattsville, MD | 3.0 | 2.5 | 1212 | $2,500 | $2.06 | 44d | 1 | 0.48mi |
| 1105 Carrington Ave Capitol Heights, MD | 3.0 | 1.5 | 1152 | $2,395 | $2.08 | 2d | 1 | 0.53mi |
| 1105 Carrington Ave Capitol Heights, MD | 3.0 | 1.5 | 1152 | $2,400 | $2.08 | 44d | 1 | 0.53mi |
| 1846 Cedarwood Ct Hyattsville, MD | 3.0 | 2.5 | 1120 | $2,150 | $1.92 | 44d | 1 | 0.54mi |
| 2014 E Marlboro Ave Hyattsville, MD | 1.0–3.0 | 1.0–2.0 | 987 | $1,874 | $1.90 | 2d | 2 | 0.56mi |
| 903 Glen Willow Dr Capitol Heights, MD | 2.0–3.0 | 1.0 | 885 | $2,115 | $2.39 | 2d | 4 | 0.70mi |
| 7290 Mahogany Dr Hyattsville, MD | 3.0 | 2.5 | 1300 | $2,400 | $1.85 | 4d | 1 | 0.93mi |
| 7607 Burnside Rd Hyattsville, MD | 3.0 | 1.5 | 1280 | $2,200 | $1.72 | 44d | 1 | 0.97mi |
| 7714 Greymont St Hyattsville, MD | 3.0 | 1.5 | 1320 | $2,200 | $1.67 | 17d | 1 | 1.03mi |
| 7711 Burnside Rd Hyattsville, MD | 3.0 | 1.5 | 1320 | $2,200 | $1.67 | 18d | 1 | 1.04mi |
| 818 Balsamtree Pl Capitol Heights, MD | 4.0 | 1.5 | 1102 | $2,275 | $2.06 | 5d | 1 | 1.17mi |
| 1105 61st Ave Fairmount Heights, MD | 4.0 | 3.5 | 1352 | $2,500 | $1.85 | 18d | 1 | 1.18mi |
| 916 Portia Ct Hyattsville, MD | 3.0 | 2.5 | 1029 | $2,800 | $2.72 | 44d | 1 | 1.18mi |
| 522 70th St Capitol Heights, MD | 4.0 | 1.5 | 1820 | $3,000 | $1.65 | 44d | 1 | 1.21mi |
| 522 70th St Capitol Heights, MD | 4.0 | 1.5 | 1840 | $3,000 | $1.63 | 3d | 1 | 1.21mi |
| 6812 Pepper St Capitol Heights, MD | 4.0 | 2.0 | 1095 | $2,750 | $2.51 | 44d | 1 | 1.24mi |
| 7626 Green Willow Ct Hyattsville, MD | 4.0 | 3.0 | 1220 | $2,850 | $2.34 | 18d | 1 | 1.25mi |
| 7720 Penbrook Pl Hyattsville, MD | 5.0 | 2.0 | 1098 | $2,200 | $2.00 | 44d | 1 | 1.26mi |
| 7727 Swan Ter Hyattsville, MD | 3.0 | 2.5 | 1700 | $2,200 | $1.29 | 17d | 1 | 1.35mi |
| 505 69th St Capitol Heights, MD | 3.0 | 2.0 | 1000 | $2,500 | $2.50 | 18d | 1 | 1.35mi |
| 6313 Field St Capitol Heights, MD | 3.0 | 2.0 | 1700 | $2,250 | $1.32 | 18d | 1 | 1.36mi |
| 6801 James Farmer Way Capitol Heights, MD | 3.0 | 1.5 | 1512 | $2,150 | $1.42 | 18d | 1 | 1.40mi |
Listing history 2 events
-
2026-05-08status Pending 540-char remark
-
2026-05-04$340,000 Active 540-char remark
ⓘ Source: listings_history table (triggers on properties + properties_extension) + one-shot
backfill from property_details.listing_events for pre-trigger history.
Tax reassessment forecast MD · Partial reset (capped growth)
- Current annual tax
- $4,387 · $366/mo
- Projected year-2 tax
- $4,387 · $366/mo
- Expected delta
- $0/yr ($0/mo · 0.0%)
ⓘ Screening estimate from a state-policy table — verify with the county assessor before closing.
Climate risk First Street
- Flood 1/10 Low FEMA zone X (unshaded) · 0% chance over 30 yrs
- Wildfire 1/10 Low
- Heat 8/10 Severe 7 d/yr ≥104°F today · 15 d/yr by 30 yrs out
- Wind 4/10 Moderate 19% chance of damaging wind over 30 yrs
- Air quality 4/10 Moderate 4 unhealthy d/yr today · 5 by 30 yrs out
Nearby sold comps map
Loading sold comps map…
Walkable amenities ~0.75 mi
Loading nearby amenities…
Taxation est. · year 1
- Rental income
- $30,821
- − Mortgage interest
- −$19,045
- − Property taxes
- −$4,387
- − Insurance
- −$1,700
- − Repairs & maintenance
- −$2,466
- − Management
- −$2,466
- − Depreciation
- −$9,891
- Taxable loss
- −$9,133
- Est. tax savings @ 24.0%
- +$2,192
- After-tax cash flow
- $-942/yr
For passive investors: Depreciation is non-cash, so a rental often shows a tax loss while cash-flowing — sheltering income. Rental losses are passive: they offset passive income freely, and up to $25,000/yr can offset ordinary (W-2) income if you actively participate and your MAGI is under $100k (phasing out to $0 by $150k); unused losses carry forward. On sale, claimed depreciation is recaptured at up to 25%, and gains may owe capital-gains tax (a 1031 exchange can defer both). Figures are a year-1 estimate at your 24.0% rate — not tax advice; consult a CPA.
Schools (NCES district)
- District
- Prince George'S County Public Schools
- NCES district ID
- 2400510
- Math proficiency
- 8% ▼ -11.00%
- Reading proficiency
- 24% ▼ -9.00%
- Median HH income
- $73,967
- Composite
- 16.82/100
- National rank
- #9151
- State rank
- #21 of 24 in MD
Livability — Landover
- Score
- 69/100
- State rank
- #194
- US rank
- #8942
Category grades
Schools grade is shown separately in the Schools card above.
Census & demographics
- Census place
- Landover, MD
- County
- Prince Georges County · 919,866 people
- City population
- 40,946
- Metro
- Washington-Arlington-Alexandria, DC-VA-MD-WV
- Population (ZIP)
- 40,066
- Household income
- $85,994
- Rent vs Own
- Severe rent burden
- 1927.0
Population outlook (Prince George's County) Hauer SSP2
- Today (2025)
- 1,005,426 people
- By 2030
- 1,048,416 · +4.3%
- By 2040
- 1,123,425 · +11.7%
- By 2050
- 1,183,220 · +17.7%
- By 2075
- 1,306,202 · +29.9%
- By 2100
- 1,408,179 · +40.1%
Race, ethnicity, and origin ACS 2023
- Neighborhood character
- Predominantly Black (70%)
- Race & ethnicity
- Black 70% Hispanic / Latino 16% White 6% Two or more races 6% Asian 3%
- Hispanic origin (detail)
- Mexican 3% Dominican 1%
- Common ancestry
- Hispanic 2% Swiss 0%
- Foreign-born
- 21% · Canada, United Kingdom, China
- Languages at home
- 74% English-only · Spanish 13% French/Haitian/Cajun 4% Other Indo-European 1%
Political lean MEDSL · Prince George's
- 2024 margin
- Solid D (+75.2) · D 86.3% · R 11.2% · Other 2.5%
- 2008→2024 swing
- -3.3pp toward R · 2008: 78.5pp · 2024: 75.2pp
- All cycles
- 2024: D+75.2 2020: D+80.5 2016: D+81.0 2012: D+80.9 2008: D+78.5
Not yet ingested
- Civics
- —
Market trends
- HPI YoY
- ▼ -137.48%
- Current HPI
- 314.7413
- Rent YoY
- ▲ 4.30%
- Metro
- Washington-Arlington-Alexandria, DC-VA-MD-WV
- State GDP YoY
- ▲ 2.97%
- F500 in state
- 12
Industry mix (Fortune 500 HQ in MD)
| Industry | F500 HQs | Revenue |
|---|---|---|
| Aerospace / Defense | 1 | $71B |
|
||
| Utilities | 1 | $25B |
|
||
| Hotels | 1 | $24B |
|
||
| Consumer Goods | 1 | $7B |
|
||
| Real Estate | 1 | $6B |
|
||
| Chemicals | 1 | $2B |
|
||
Price history
+4.4% since first listed3 events — show timeline
- 2026-06-17 Sold (MLS) $355,000 BRIGHT MLS
- 2026-05-08 Pending — BRIGHT MLS
- 2026-05-04 Listed $340,000 BRIGHT MLS
Property tax history
+5.8%/yrLatest (2025): $4,387 · +3.7% YoY. Source: county tax records.
Cash-flow waterfall
monthlySold comps — $/sqft
last 12 mo · ≤1 miLoading sold comps…