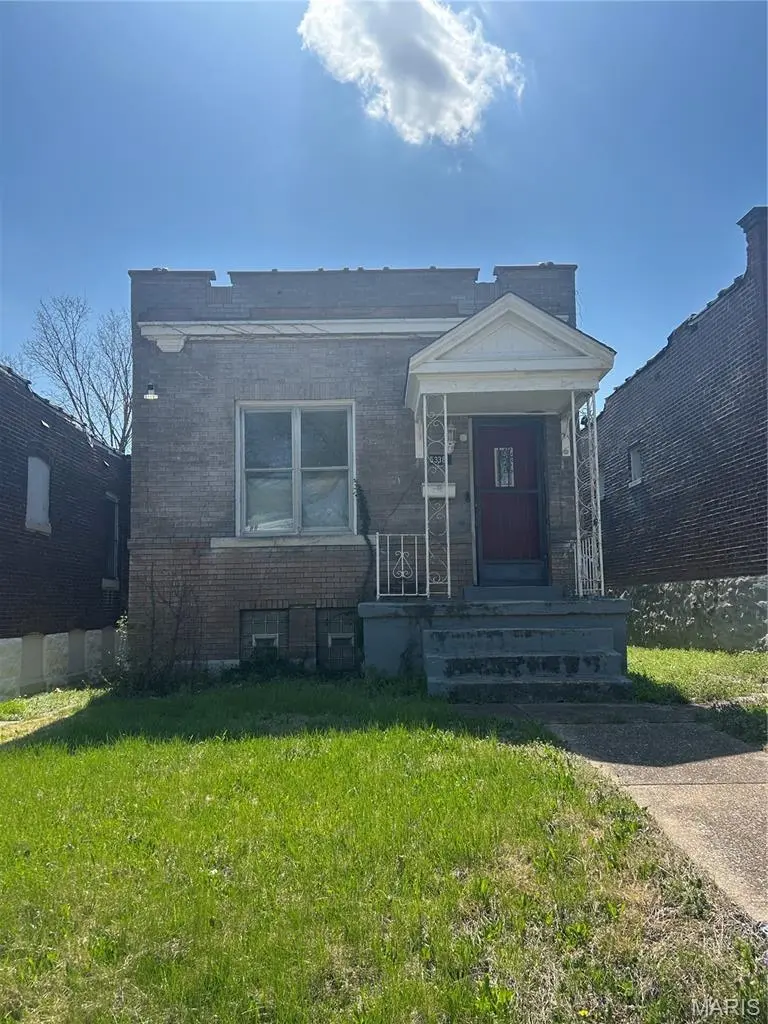
5338 Wabada Ave · St. Louis, MO
Flood risk 1/10 · Minimal
- FEMA flood zone
- X (unshaded)
- Chance of flooding over 30 yrs
- 0.0%
- Est. flood insurance / yr
- $473 – $860
Fire risk 1/10 · Minimal
- Est. fire insurance / yr
- $1,054 – $1,958
Heat risk 5/10 · Moderate
- Hot days now (above 107°F)
- 7 days/yr
- Hot days in 30 yrs
- 21 days/yr
Wind risk 2/10 · Minimal
- Chance of severe wind over 30 yrs
- 1.0%
Air-quality risk 4/10 · Minor
- Unhealthy air days now
- 4 days/yr
- Unhealthy air days in 30 yrs
- 5 days/yr
Risk factors via First Street. Map © Google.
Why this score? — see what drove the D grade
The composite is a weighted blend of 9 inputs, each scored 0–100. Each bar is that input's sub-score; the figure is the points it added to the 100-point composite (weight × sub-score).
- Cash flow +15.0/30.0
- ARV discount +8.2/15.0
- 1% rule +5.0/10.0
- DSCR +5.0/10.0
- Rent growth +3.1/5.0
- Livability +2.5/5.0
- Condition / age +2.5/5.0
- Schools +1.2/10.0
- Appreciation +0.0/10.0
$26,000
🖨 Deal sheet 📄 Offer letter ✓ Due diligence
Listing remarks MLS
SELLER WILL NOT ACCEPT ANY OFFER WITHOUT PRIOR WALKTHROUGH. All brick bungalow with 2 bedrooms, level fenced yard and detached garage. This property needs major TLC. This property could be ideal for an investor wanting to add a rental to their portfolio. Property to be sold As-is and seller will not provide any inspections or warranties.
Key facts
- 3,641 sq ft lot
- Garage
- Built 1908
Neighborhood map
What this means for you Summary
Snapshot
- This is a 2-bed/1.0-bath single-family listed at $26k.
Deal economics
- At list price, monthly cash flow is $761 ($9k/yr) — positive.
- The deal already cash-flows at list — no discount required.
- Meets the 1% rule at list price ($1k rent vs $26k).
- Recommended offer: $24k (6.0% below list) — sets the bar for market timing.
- Cap rate 41.4% vs local median 5.0% in St. Louis — top-decile yield for the area; either an underpriced asset or a hidden risk that comps aren't pricing in. Stress-test before assuming the spread holds.
Location & tenants
- Location reads: area grade D — affects rentability + tenant quality, not the cash-flow math above.
- St. Louis City (urban): math 10% / reading 18% proficiency, ranked #312 of 324 in MO (top 96%) — low school quality limits family demand, transient renter base, plan for 1-2y turnover; 80% free/reduced lunch — lower-income household profile, screen leases tightly.
- Market conditions: Rents rising (+2.4%/yr); 118 active listings in the ZIP; 36 comparable units currently listed for rent nearby; rentals at typical pace (median 24d on market — plan ~3-4 weeks tenant-placement turnaround); 47% of comp listings sitting > 30 days — soft ceiling on asking rent; 294 units permitted in St. Louis city in 2024 (227 in 5+ unit buildings).
- This rent runs 31% of the median local income ($46k/yr) — at the standard rent-burdened threshold; future hikes will face affordability resistance.
Forward outlook
- Local home prices are declining (-3.0%/yr); year-one equity from $180 of loan paydown is wiped out by about $780 of value loss. Plan a longer hold.
- St. Louis County population projected to shrink 6% by 2050 — rents likely to lag national; underwrite the cash flow, not the appreciation.
- At projected returns (-3.0% appreciation + 2.4% rent growth), your $7k cash investment doubles in ~1 year — after that, you're playing with house money.
Negotiation context
- It's been on market 73 days — a 6% lower offer ($24k) is reasonable based on typical stale-listing flexibility.
- 3 sale attempts with the ask held roughly flat each time — persistent listings suggest the price (not the market) is what's stuck; bring a comps-based counter.
- Current owner paid $11k; list at $26k implies a 136% gain — meaningful room to come down on a strong offer.
Risks & watch-outs
- Watch-outs: built in 1908 — expect roof / HVAC / electrical / plumbing capex.
- Climate carrying-cost: extreme-heat days projected 7→21/yr by 2055 (HVAC capex compounding) — expect insurance premiums to compound above CPI over the hold.
Questions for the listing agent
- It's been on market 73 days. Have you received any prior offers? Is the seller open to a 6% concession, seller financing, or rate buy-down credit?
- Built in 1908 — when were the roof, HVAC, electrical panel, plumbing, and water heater last replaced?
- Why hasn't it sold? Are there any deal-killer items the seller is aware of (foundation, flood, title, zoning, code violations)?
- Is there a deadline driving the sale (1031 exchange, divorce, estate, relocation)? That informs how much negotiation room exists.
- The area grade is low — what's the realistic commute time and amenity access for the typical tenant pool here? Any planned neighborhood developments (good or bad) we should know about?
- What's the average days-on-market for RENTAL listings here right now (not sales)? A rising rental-DOM trend means longer vacancies and softer asking-rent achievability than the comps imply.
- What's the recent tenant-quality profile in this submarket — average credit score on applications, eviction rate, late-payment / NSF rate, and stable-employment percentage? A property-management company in the area should have these aggregated.
- How much new for-sale + rental construction is in the pipeline within 1–3 miles? Heavy new supply typically softens prices + rents 12–24 months out; constrained supply supports both.
Investment metrics
- 1% rule
- 4.49% ✓
- Cap rate
- 41.39%
- Cash-on-cash
- 125.36%
- DSCR
- 6.58
- GRM
- 1.9
CMA / ARV
- ARV (median comp)
- $26,429
- List price
- $26,000
- Delta
- -1.62%
- Verdict
- FAIR
- Comps
- 20 within 1.0 mi
Show comp detail 12 sales within ~0.75 mi
| Address | Dist | Beds/Ba | Sqft | Sold | Price | $/sf | Match |
|---|---|---|---|---|---|---|---|
| 2810 Arlington Ave | 0.25mi | 2/1.0 | 968 (+4%) | 5mo | $25,000 | $26 | 78 |
| 5114 Maffitt Ave | 0.37mi | 2/1.0 | 930 (-0%) | 17mo | $22,900 | $25 | 68 |
| 5219 Maffitt Ave | 0.30mi | 2/1.0 | 960 (+3%) | 17mo | $25,000 | $26 | 67 |
| 1636 Belt Ave | 0.30mi | 2/1.0 | 1,003 (+7%) | 9mo | $19,900 | $20 | 67 |
| 2806 Union Blvd | 0.25mi | 2/1.0 | 858 (-8%) | 10mo | $15,000 | $17 | 66 |
| 5124 Lotus Ave | 0.29mi | 3/1.0 (+1) | 960 (+3%) | 15mo | $30,000 | $31 | 65 |
| 1632 Belt Ave | 0.30mi | 2/1.0 | 1,003 (+7%) | 12mo | $37,900 | $38 | 64 |
| 5232 Highland Ave | 0.18mi | 3/1.5 (+1) | 1,030 (+10%) | 6mo | $65,000 | $63 | 63 |
| 5658 Maffitt Ave | 0.57mi | 2/1.0 | 850 (-9%) | 4mo | $25,000 | $29 | 55 |
| 5226 Saint Louis Ave | 0.38mi | 2/1.0 | 1,050 (+12%) | 11mo | $65,000 | $62 | 53 |
| 5710 Saint Louis Ave | 0.68mi | 2/1.0 | 1,000 (+7%) | 7mo | $25,000 | $25 | 51 |
| 4837 Leduc St | 0.72mi | 2/1.0 | 1,008 (+8%) | 17mo | $10,000 | $10 | 39 |
Match score weights: distance 35% · size 25% · config 20% · recency 20%. Top-matched comps best support the ARV.
Projected returns pro-forma
-3.0% appreciation · 2.39% rent growth · sell at horizon
- IRR
- —
- Equity multiple
- 6.98×
- Total profit
- $43,521
- Equity at exit
- $3,877
- IRR
- —
- Equity multiple
- 14.38×
- Total profit
- $97,410
- Equity at exit
- $2,248
Cash invested: $7,280 (down + closing). Projections, not guarantees.
Landlord ↔ Tenant lean methodology
- Overall (STATE)
- 81 Strongly Landlord-Friendly
- State Missouri
- 81 Strongly Landlord-Friendly · R+10
- County
- — inherits STATE
- City
- — inherits STATE
ZIP-level market 63112
- Rents YoY
- 2.4%
- Active inventory
- 118
- Price-to-rent
- 1.9×
Monthly cashflow live
- Estimated rent
- $1,168 high interval (Pro) →
- Mortgage (P&I)
- −$136
- Tax from tax record
- −$15 /mo · $180/yr
- Insurance
- −$11
- HOA
- −$0
- Vacancy / Maint / Mgmt
- −$245
- Net cashflow
- $761
Break-even live
UW: 25.0% down · 7.5% · 30yr · 1.5% tax · 5.0% vac · 8.0% maint · 8.0% mgmt
Financing live
Cash to close
- Down payment
- $6,500
- Closing costs
- $780
- Reserves months
- —
- Total cash needed
- —
Loan-product check · same deal, 3 products live
Conventional
25% down · 7.5% · 30yr
- Down + closing
- —
- Monthly P&I
- —
- Monthly cashflow
- —
- DSCR
- —
- Eligible?
- —
Personal DTI + credit; lowest rate.
DSCR
20% down · 8.5% · 30yr
- Down + closing
- —
- Monthly P&I
- —
- Monthly cashflow
- —
- DSCR
- —
- Eligible?
- —
No personal income docs; deal must DSCR.
Hard money
10% down · 12.0% · 12mo
- Down + closing
- —
- Monthly P&I
- —
- Monthly cashflow
- —
- DSCR
- —
- Eligible?
- —
Short-term bridge; refi at stabilization.
Rent comps 36 comps
| Address | Beds | Baths | Sqft | Rent | $/sqft | DOM | Units | Dist |
|---|---|---|---|---|---|---|---|---|
| 1965 Arlington Ave Saint Louis, MO | 3.0 | 1.0 | 980 | $1,300 | $1.33 | 4d | 1 | 0.15mi |
| 2831 Abner Pl Unit 7 St. Louis, MO | 2.0 | 1.0 | 968 | $1,250 | $1.29 | 23d | 1 | 0.30mi |
| 1420 Union Blvd Unit 2F St. Louis, MO | 2.0 | 1.0 | 1096 | $995 | $0.91 | 43d | 1 | 0.46mi |
| 5608 Wabada Ave Saint Louis, MO | 2.0 | 1.0 | 910 | $1,300 | $1.43 | 16d | 1 | 0.48mi |
| 1610 Kingshighway Blvd St. Louis, MO | 1.0 | 1.0 | 525 | $779 | $1.48 | 2d | 6 | 0.50mi |
| 5662 Maffitt Ave Saint Louis, MO | 2.0 | 1.0 | 850 | $895 | $1.05 | 7d | 1 | 0.61mi |
| 1324 Academy Ave Unit C St. Louis, MO | 1.0 | 1.0 | 1000 | $890 | $0.89 | 43d | 1 | 0.62mi |
| 5203 Page Blvd Unit 5201 1st Floor St. Louis, MO | 2.0 | 1.0 | 1000 | $750 | $0.75 | 14d | 1 | 0.65mi |
| 1232 N Euclid Ave Saint Louis, MO | 3.0 | 1.5 | 982 | $1,395 | $1.42 | 43d | 1 | 0.89mi |
| 5345 Cabanne Ave Unit 5345 Cabanne 3N St. Louis, MO | 1.0 | 1.0 | 630 | $800 | $1.27 | 43d | 1 | 0.94mi |
| 5345 Cabanne Ave Unit 5345 Cabanne 1S St. Louis, MO | 2.0 | 1.0 | 800 | $950 | $1.19 | 43d | 1 | 0.94mi |
| 4627 Maffitt Ave Saint Louis, MO | 2.0 | 1.0 | 704 | $795 | $1.13 | 43d | 1 | 1.05mi |
| 5818 Ferris Ave Saint Louis, MO | 3.0 | 1.0 | 1014 | $1,500 | $1.48 | 43d | 1 | 1.23mi |
| 1266 Amherst Pl Unit 2nd floor St. Louis, MO | 2.0 | 1.0 | 1050 | $1,000 | $0.95 | 43d | 1 | 1.23mi |
| 5989 Julian Ave Unit 37 St. Louis, MO | 2.0 | 1.0 | 780 | $1,200 | $1.54 | 17d | 1 | 1.26mi |
| 763 Walton Ave Unit 763 St. Louis, MO | 2.0 | 1.0 | 1100 | $1,100 | $1.00 | 43d | 1 | 1.27mi |
| 807 Clara Ave Unit 34 St. Louis, MO | 1.0 | 1.0 | 650 | $799 | $1.23 | 17d | 1 | 1.27mi |
| 807 Clara Ave Apt 33 St. Louis, MO | 1.0 | 1.0 | 650 | $799 | $1.23 | 43d | 1 | 1.27mi |
| 807 Clara Ave Unit 7 St. Louis, MO | 1.0 | 1.0 | 650 | $699 | $1.08 | 17d | 1 | 1.27mi |
| 807 Clara Ave Unit 2 St. Louis, MO | 1.0 | 1.0 | 650 | $699 | $1.08 | 43d | 1 | 1.27mi |
| 807 Clara Ave Unit 3 St. Louis, MO | 1.0 | 1.0 | 650 | $699 | $1.08 | 7d | 1 | 1.27mi |
| 5572 Clemens Ave Unit 1W St. Louis, MO | 3.0 | 1.0 | 900 | $1,025 | $1.14 | 14d | 1 | 1.29mi |
| 5457 Delmar Blvd St. Louis, MO | 1.0 | 1.0 | 481 | $806 | $1.67 | 1d | 7 | 1.32mi |
| 5803 Cabanne Ave Saint Louis, MO | 2.0 | 1.0 | 600 | $1,200 | $2.00 | 4d | 1 | 1.33mi |
| 625 N Euclid Ave St. Louis, MO | 2.0 | 1.0–2.0 | 984 | $3,120 | $3.17 | 1d | 16 | 1.33mi |
| 5740 Cabanne Ave Saint Louis, MO | 1.0 | 1.0 | 650 | $625 | $0.96 | 43d | 1 | 1.34mi |
| 5811 Cabanne Ave St. Louis, MO | 2.0 | 1.0 | 800 | $1,250 | $1.56 | 43d | 1 | 1.34mi |
| 5500 Delmar Blvd Unit 5540-Apt 202 St. Louis, MO | 2.0 | 2.0 | 875 | $1,395 | $1.59 | 7d | 1 | 1.36mi |
| 5535 Delmar Blvd St. Louis, MO | 1.0–2.0 | 1.0–2.0 | 911 | $1,970 | $2.16 | 1d | 14 | 1.36mi |
| 3720 Darby St Saint Louis, MO | 2.0 | 1.0 | 960 | $1,123 | $1.17 | 43d | 1 | 1.38mi |
| 4961 McPherson Ave St. Louis, MO | 1.0 | 1.0 | 950 | $1,175 | $1.24 | 43d | 1 | 1.41mi |
| 4642 Farlin Ave Unit 1F St. Louis, MO | 2.0 | 1.0 | 1056 | $800 | $0.76 | 43d | 1 | 1.42mi |
| 5560 Delmar Blvd Saint Louis, MO | 1.0–2.0 | 1.0–2.0 | 752 | $1,395 | $1.85 | 16d | 1 | 1.42mi |
| 4953 McPherson Ave Saint Louis, MO | 1.0 | 1.0 | 1048 | $1,325 | $1.26 | 43d | 1 | 1.43mi |
| 5621 Delmar Blvd Saint Louis, MO | 1.0 | 1.0 | 612 | $1,087 | $1.77 | 2d | 4 | 1.44mi |
| 401 N Euclid Ave St. Louis, MO | 3.0 | 1.0 | 1025 | $1,615 | $1.58 | 1d | 4 | 1.49mi |
Listing history 26 events
-
2026-06-18days on market $26,000 Active 73 DOM
-
2026-06-17days on market $26,000 Active 72 DOM
-
2026-06-16days on market $26,000 Active 71 DOM
-
2026-06-15days on market $26,000 Active 70 DOM
-
2026-06-13days on market $26,000 Active 68 DOM
-
2026-06-09days on market $26,000 Active 64 DOM
-
2026-06-08days on market $26,000 Active 63 DOM
-
2026-06-08days on market $26,000 Active 62 DOM
-
2026-06-05days on market $26,000 Active 59 DOM
-
2026-06-03days on market $26,000 Active 58 DOM
-
2026-06-02days on market $26,000 Active 57 DOM
-
2026-06-01days on market $26,000 Active 56 DOM
-
2026-05-31days on market $26,000 Active 55 DOM
-
2026-04-20status Active 339-char remark
Show marketing remark (339 chars)
SELLER WILL NOT ACCEPT ANY OFFER WITHOUT PRIOR WALKTHROUGH. All brick bungalow with 2 bedrooms, level fenced yard and detached garage. This property needs major TLC. This property could be ideal for an investor wanting to add a rental to their portfolio. Property to be sold As-is and seller will not provide any inspections or warranties.
-
2026-04-14status Pending 339-char remark
Show marketing remark (339 chars)
SELLER WILL NOT ACCEPT ANY OFFER WITHOUT PRIOR WALKTHROUGH. All brick bungalow with 2 bedrooms, level fenced yard and detached garage. This property needs major TLC. This property could be ideal for an investor wanting to add a rental to their portfolio. Property to be sold As-is and seller will not provide any inspections or warranties.
-
2026-04-01$26,000 Active 339-char remark
Show marketing remark (339 chars)
SELLER WILL NOT ACCEPT ANY OFFER WITHOUT PRIOR WALKTHROUGH. All brick bungalow with 2 bedrooms, level fenced yard and detached garage. This property needs major TLC. This property could be ideal for an investor wanting to add a rental to their portfolio. Property to be sold As-is and seller will not provide any inspections or warranties.
-
2026-03-31historical $26,000 339-char remark
Show marketing remark (339 chars)
SELLER WILL NOT ACCEPT ANY OFFER WITHOUT PRIOR WALKTHROUGH. All brick bungalow with 2 bedrooms, level fenced yard and detached garage. This property needs major TLC. This property could be ideal for an investor wanting to add a rental to their portfolio. Property to be sold As-is and seller will not provide any inspections or warranties.
-
2025-02-28soldstatus $11,000
-
2025-02-26soldstatus Closed 355-char remark
Show marketing remark (355 chars)
SELLER WILL NOT ACCEPT ANY OFFER WITHOUT PRIOR WALKTHROUGH. No sign in yard. All brick bungalow with 2 bedrooms, level fenced yard and detached garage. This property needs major TLC. This property could be ideal for a investor wanting to add a rental to their portfolio. Property to be sold As-is and seller will not provide any inspections or warranties.
-
2025-02-12status Pending 355-char remark
Show marketing remark (355 chars)
SELLER WILL NOT ACCEPT ANY OFFER WITHOUT PRIOR WALKTHROUGH. No sign in yard. All brick bungalow with 2 bedrooms, level fenced yard and detached garage. This property needs major TLC. This property could be ideal for a investor wanting to add a rental to their portfolio. Property to be sold As-is and seller will not provide any inspections or warranties.
-
2025-01-31$20,000 Active 355-char remark
Show marketing remark (355 chars)
SELLER WILL NOT ACCEPT ANY OFFER WITHOUT PRIOR WALKTHROUGH. No sign in yard. All brick bungalow with 2 bedrooms, level fenced yard and detached garage. This property needs major TLC. This property could be ideal for a investor wanting to add a rental to their portfolio. Property to be sold As-is and seller will not provide any inspections or warranties.
-
2025-01-29historical $20,000 355-char remark
Show marketing remark (355 chars)
SELLER WILL NOT ACCEPT ANY OFFER WITHOUT PRIOR WALKTHROUGH. No sign in yard. All brick bungalow with 2 bedrooms, level fenced yard and detached garage. This property needs major TLC. This property could be ideal for a investor wanting to add a rental to their portfolio. Property to be sold As-is and seller will not provide any inspections or warranties.
-
2021-11-18soldstatus $6,000
-
2021-11-18soldstatus $16,000
-
2004-07-16soldstatus
-
2004-07-16soldstatus $15,000
ⓘ Source: listings_history table (triggers on properties + properties_extension) + one-shot
backfill from property_details.listing_events for pre-trigger history.
Tax reassessment forecast MO · Resets to sale price
- Current annual tax
- $180 · $15/mo
- Projected year-2 tax
- $252 · $21/mo
- Expected delta
- +$72/yr (+$6/mo · 39.8%)
ⓘ Screening estimate from a state-policy table — verify with the county assessor before closing.
Climate risk First Street
- Flood 1/10 Low FEMA zone X (unshaded) · 0% chance over 30 yrs
- Wildfire 1/10 Low
- Heat 5/10 Major 7 d/yr ≥107°F today · 21 d/yr by 30 yrs out
- Wind 2/10 Low 100% chance of damaging wind over 30 yrs
- Air quality 4/10 Moderate 4 unhealthy d/yr today · 5 by 30 yrs out
Nearby sold comps map
Loading sold comps map…
Walkable amenities ~0.75 mi
Loading nearby amenities…
Taxation est. · year 1
- Rental income
- $14,016
- − Mortgage interest
- −$1,456
- − Property taxes
- −$180
- − Insurance
- −$130
- − Repairs & maintenance
- −$1,121
- − Management
- −$1,121
- − Depreciation
- −$756
- Taxable income
- $9,251
- Est. tax owed @ 24.0%
- −$2,220
- After-tax cash flow
- $6,906/yr
For passive investors: Depreciation is non-cash, so a rental often shows a tax loss while cash-flowing — sheltering income. Rental losses are passive: they offset passive income freely, and up to $25,000/yr can offset ordinary (W-2) income if you actively participate and your MAGI is under $100k (phasing out to $0 by $150k); unused losses carry forward. On sale, claimed depreciation is recaptured at up to 25%, and gains may owe capital-gains tax (a 1031 exchange can defer both). Figures are a year-1 estimate at your 24.0% rate — not tax advice; consult a CPA.
Schools (NCES district)
- District
- St. Louis City
- NCES district ID
- 2929280
- Math proficiency
- 10% ▼ -6.00%
- Reading proficiency
- 18% ▼ -3.00%
- Median HH income
- $35,685
- Composite
- 11.54/100
- National rank
- #9699
- State rank
- #312 of 324 in MO
Livability — St. Louis
No livability data for this city. (Only ~50 U.S. cities are tracked.)
Census & demographics
- Census place
- St. Louis, MO
- County
- Saint Louis City · 254,015 people
- City population
- 283,259
- Metro
- St. Louis, MO-IL
- Population (ZIP)
- 17,985
- Household income
- $45,542
- Rent vs Own
- Severe rent burden
- 1457.0
Population outlook (St. Louis County) Hauer SSP2
- Today (2025)
- 315,737 people
- By 2030
- 313,865 · -0.6%
- By 2040
- 305,439 · -3.3%
- By 2050
- 296,529 · -6.1%
- By 2075
- 271,028 · -14.2%
- By 2100
- 255,359 · -19.1%
Race, ethnicity, and origin ACS 2023
- Neighborhood character
- Majority Black (63%)
- Race & ethnicity
- Black 63% White 24% Asian 6% Two or more races 5% Hispanic / Latino 4%
- Common ancestry
- Lithuanian 1% Scotch-Irish 1% Romanian 1%
- Foreign-born
- 9% · China, South Korea, Canada
- Languages at home
- 88% English-only · Spanish 3% Chinese 2% Korean 2%
Political lean MEDSL · St. Louis
- 2024 margin
- Solid D (+64.7) · D 81.4% · R 16.7% · Other 2.0%
- 2008→2024 swing
- -3.5pp toward R · 2008: 68.2pp · 2024: 64.7pp
- All cycles
- 2024: D+64.7 2020: D+66.2 2016: D+63.7 2012: D+66.6 2008: D+68.2
Not yet ingested
- Civics
- —
Market trends
- HPI YoY
- ▼ -158.94%
- Current HPI
- 115.1863
- Rent YoY
- ▲ 2.39%
- Metro
- St. Louis, MO-IL
- State GDP YoY
- ▲ 1.84%
- F500 in state
- 20
Industry mix (Fortune 500 HQ in MO)
| Industry | F500 HQs | Revenue |
|---|---|---|
| Healthcare | 1 | $163B |
|
||
| Insurance | 1 | $21B |
|
||
| Industrial Technology | 1 | $17B |
|
||
| Retail | 1 | $16B |
|
||
| Industrial Distribution | 1 | $10B |
|
||
| Utilities | 1 | $9B |
|
||
Price history
+73.3% since first listed13 events — show timeline
- 2026-04-20 Relisted — MARIS as Distributed by MLS Grid
- 2026-04-14 Pending — MARIS as Distributed by MLS Grid
- 2026-04-01 Listed $26,000 MARIS as Distributed by MLS Grid
- 2026-03-31 Coming Soon $26,000 MARIS as Distributed by MLS Grid
- 2025-02-28 Sold (Public Records) $11,000 Public Records
- 2025-02-26 Sold (MLS) — MARIS as Distributed by MLS Grid
- 2025-02-12 Pending — MARIS as Distributed by MLS Grid
- 2025-01-31 Listed $20,000 MARIS as Distributed by MLS Grid
- 2025-01-29 Coming Soon $20,000 MARIS as Distributed by MLS Grid
- 2021-11-18 Sold (Public Records) $16,000 Public Records
- 2021-11-18 Sold (Public Records) $6,000 Public Records
- 2004-07-16 Sold (Public Records) $15,000 Public Records
- 2004-07-16 Sold (Public Records) — Public Records
Property tax history
-0.6%/yrLatest (2024): $180 · +4.3% YoY. Source: county tax records.
Cash-flow waterfall
monthlySold comps — $/sqft
last 12 mo · ≤1 miLoading sold comps…