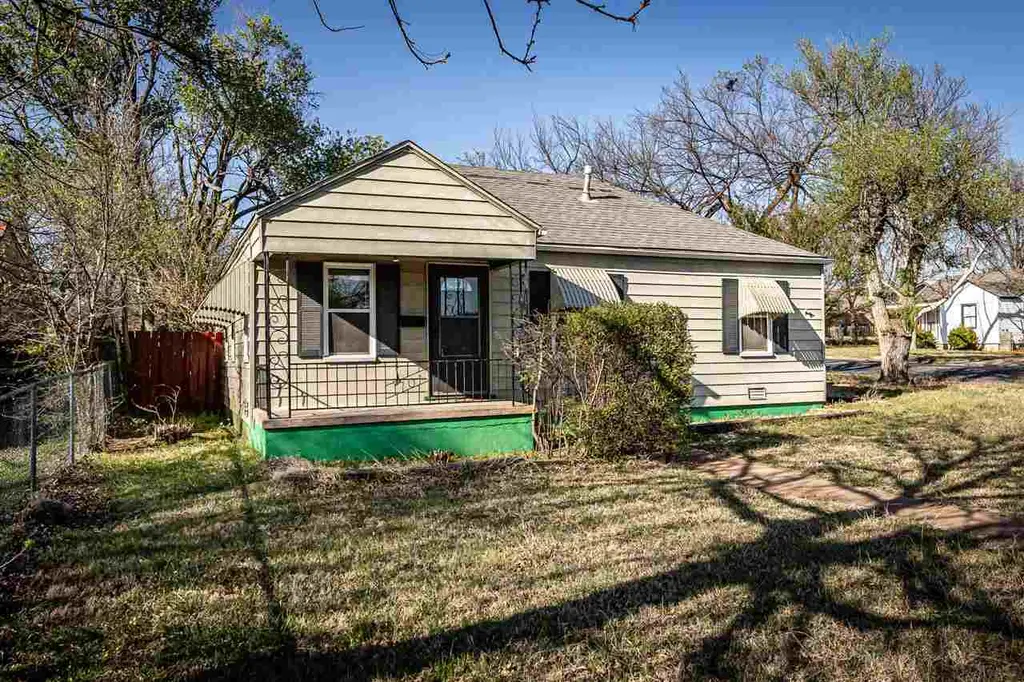
1701 NW Dearborn Ave · Lawton, OK
Flood risk 1/10 · Minimal
- FEMA flood zone
- X (unshaded)
- Chance of flooding over 30 yrs
- 0.0%
- Est. flood insurance / yr
- $507 – $1,088
Fire risk 1/10 · Minimal
- Est. fire insurance / yr
- $2,463 – $4,575
Heat risk 7/10 · Major
- Hot days now (above 108°F)
- 7 days/yr
- Hot days in 30 yrs
- 19 days/yr
Wind risk 3/10 · Minor
- Chance of severe wind over 30 yrs
- 5.0%
Air-quality risk 1/10 · Minimal
- Unhealthy air days now
- 0 days/yr
- Unhealthy air days in 30 yrs
- 0 days/yr
Risk factors via First Street. Map © Google.
Why this score? — see what drove the B+ grade
The composite is a weighted blend of 9 inputs, each scored 0–100. Each bar is that input's sub-score; the figure is the points it added to the 100-point composite (weight × sub-score).
- Cash flow +30.0/30.0
- ARV discount +15.0/15.0
- 1% rule +10.0/10.0
- DSCR +10.0/10.0
- Livability +3.2/5.0
- Rent growth +2.6/5.0
- Condition / age +2.5/5.0
- Schools +2.0/10.0
- Appreciation +0.0/10.0
$74,000
🖨 Deal sheet 📄 Offer letter ✓ Due diligence
Listing remarks
For more information about this home call Real Estate Experts, LLC at 580 248 2600 or visit staceandreedy.com. This home offers 3 bedrooms, 1 bath, detached single car garage, and is situated on a fenced corner lot. The home has been well cared for and has been freshly painted, new carpet, updated electrical, double pane windows, spacious dining room that opens to the kitchen and utility room. The home is priced below market and will be a fantastic home once you put your modern touches on it. The home is being sold AS-IS however it is in a great, livable state. Call for your private tour.
Key facts
- Updated electrical
- Utility room
- Spacious dining room
Tags
Property features AI
Exterior
- Parking: Driveway; 1 covered parking space; 1 garage space (detached or attached not specified); Total 1 parking space
- Utilities: Public water; Public sewer; Natural gas available
- Home design: Single-family residence; One story; Updated / remodeled
- Construction: Metal siding; Composition roof; Built on crawl space
- Exterior features: Covered porch; Wood fencing; Corner lot; Public maintained road; City street frontage
Interior
- Kitchen: Cooktop; Microwave; Dishwasher; Range hood
- Flooring: Ceramic tile; Carpet
- Bathrooms: 1 full bathroom
- Heating & cooling: Central heating (natural gas); Ceiling fan(s)
- Interior features: Double pane windows; Window coverings; Storm door(s); Crawl space
- Laundry & utility: Washer hookup; Gas water heater
Neighborhood map
What this means for you Summary
Snapshot
- This is a 3-bed/1.0-bath single-family listed at $74k.
Deal economics
- At list price, monthly cash flow is $416 ($5k/yr) — positive.
- The deal already cash-flows at list — no discount required.
- Meets the 1% rule at list price ($1k rent vs $74k).
- Recommended offer: $70k (6.0% below list) — sets the bar for market timing.
- Cap rate 13.0% vs local median 6.1% in Lawton — top-decile yield for the area; either an underpriced asset or a hidden risk that comps aren't pricing in. Stress-test before assuming the spread holds.
Location & tenants
- Location reads 63/100 on livability (#206 in OK) — a middle-class / working-renter tenant base. Strengths: cost of living A+, housing A+; Watch: employment D, crime F, commute F.
- Lawton (urban): math 20% / reading 26% proficiency, ranked #137 of 270 in OK (top 51%) — low school quality limits family demand, transient renter base, plan for 1-2y turnover.
- Zoned schools: Whittier Es (math 22% / reading 17%, grade F, #479 of 845 statewide, top 63%, 351 students, 0% FRL); Central Ms (math 17% / reading 24%, grade F, #153 of 345 statewide, top 45%, 994 students, 0% FRL); Lawton Hs (math 16% / reading 21%, grade F, #302 of 447 statewide, top 68%, 1,417 students, 0% FRL) — zoned schools average 0% FRL vs 54% district-wide (54 pts lower); this property's tenant base skews higher-income than the district average.
- Market conditions: Rents flat; 208 active listings in the ZIP; 133 units permitted in Comanche County in 2024 (0 in 5+ unit buildings).
Forward outlook
- Local home prices are declining (-3.0%/yr); year-one equity from $512 of loan paydown is wiped out by about $2k of value loss. Plan a longer hold.
- Comanche County population projected to shrink 3% by 2050 — rents likely to lag national; underwrite the cash flow, not the appreciation.
- At projected returns (-3.0% appreciation + 0.2% rent growth), your $21k cash investment doubles in ~6 years — after that, you're playing with house money.
Negotiation context
- It's been on market 72 days — a 6% lower offer ($70k) is reasonable based on typical stale-listing flexibility.
- 2 sale attempts; this cycle's ask is 6% above the opening price — seller raised mid-cycle; expect resistance to lowballs.
Risks & watch-outs
- Watch-outs: built in 1944 — expect roof / HVAC / electrical / plumbing capex.
- Climate carrying-cost: extreme-heat days projected 7→19/yr by 2055 (HVAC capex compounding) — expect insurance premiums to compound above CPI over the hold.
Questions for the listing agent
- It's been on market 72 days. Have you received any prior offers? Is the seller open to a 6% concession, seller financing, or rate buy-down credit?
- Built in 1944 — when were the roof, HVAC, electrical panel, plumbing, and water heater last replaced?
- Why hasn't it sold? Are there any deal-killer items the seller is aware of (foundation, flood, title, zoning, code violations)?
- Is there a deadline driving the sale (1031 exchange, divorce, estate, relocation)? That informs how much negotiation room exists.
- Schools are D-rated, which usually means shorter tenancies and higher turnover. Who's the typical renter profile here, and what's been the actual vacancy rate?
- Crime grade is F in this area — have there been break-ins, vandalism, or insurance claims at this property in the last 3 years? What carrier currently insures it and at what premium?
- What's the average days-on-market for RENTAL listings here right now (not sales)? A rising rental-DOM trend means longer vacancies and softer asking-rent achievability than the comps imply.
- What's the recent tenant-quality profile in this submarket — average credit score on applications, eviction rate, late-payment / NSF rate, and stable-employment percentage? A property-management company in the area should have these aggregated.
- How much new for-sale + rental construction is in the pipeline within 1–3 miles? Heavy new supply typically softens prices + rents 12–24 months out; constrained supply supports both.
Investment metrics
- 1% rule
- 1.59% ✓
- Cap rate
- 13.04%
- Cash-on-cash
- 24.09%
- DSCR
- 2.07
- GRM
- 5.3
CMA / ARV
- ARV (on-the-fly)
- $107,010
- Comps found
- 12
Show comp detail 12 sales within ~0.75 mi
| Address | Dist | Beds/Ba | Sqft | Sold | Price | $/sf | Match |
|---|---|---|---|---|---|---|---|
| 1416 NW Bell Ave | 0.24mi | 3/2.0 | 1,200 (+1%) | 3mo | $119,900 | $100 | 81 |
| 1410 NW Columbia Ave | 0.22mi | 3/2.0 | 1,200 (+1%) | 5mo | $108,000 | $90 | 80 |
| 1742 NW Ash Ave | 0.31mi | 3/1.0 | 1,200 (+1%) | 6mo | $100,000 | $83 | 79 |
| 1605 NW Columbia Ave | 0.08mi | 2/1.0 (-1) | 1,100 (-8%) | 1mo | $73,800 | $67 | 78 |
| 732 NW 16th St | 0.33mi | 2/1.0 (-1) | 1,200 (+1%) | 3mo | $99,000 | $83 | 76 |
| 1703 NW Euclid Ave | 0.07mi | 3/2.0 | 1,300 (+9%) | 2mo | $42,000 | $32 | 75 |
| 1702 NW Euclid Ave | 0.04mi | 3/1.5 | 1,300 (+9%) | 7mo | $42,000 | $32 | 75 |
| 1722 NW Liberty Ave | 0.39mi | 3/3.0 | 1,200 (+1%) | 3mo | $135,000 | $113 | 70 |
| 1703 NW Lake Ave | 0.21mi | 3/2.0 | 1,100 (-8%) | 6mo | $135,000 | $123 | 68 |
| 1004 NW Columbia Ave | 0.60mi | 2/1.0 (-1) | 1,200 (+1%) | 6mo | $135,000 | $113 | 60 |
| 911 NW Columbia Ave | 0.64mi | 3/1.0 | 1,300 (+9%) | 2mo | $120,000 | $92 | 53 |
| 909 NW Bell Ave | 0.67mi | 2/1.0 (-1) | 1,100 (-8%) | 3mo | $77,000 | $70 | 49 |
Match score weights: distance 35% · size 25% · config 20% · recency 20%. Top-matched comps best support the ARV.
Projected returns pro-forma
-3.0% appreciation · 0.25% rent growth · sell at horizon
- IRR
- 14.2%
- Equity multiple
- 1.55×
- Total profit
- $11,356
- Equity at exit
- $11,034
- IRR
- 20.8%
- Equity multiple
- 2.53×
- Total profit
- $31,794
- Equity at exit
- $6,398
Cash invested: $20,720 (down + closing). Projections, not guarantees.
Landlord ↔ Tenant lean methodology
- Overall (STATE)
- 83 Strongly Landlord-Friendly
- State Oklahoma
- 83 Strongly Landlord-Friendly · R+20
- County
- — inherits STATE
- City
- — inherits STATE
ZIP-level market 73507
- Home prices YoY
- -23.2%
- Rents YoY
- 0.2%
- Active inventory
- 208
- Price-to-rent
- 5.3×
Monthly cashflow live
- Estimated rent
- $1,174 medium interval (Pro) →
- Mortgage (P&I)
- −$388
- Tax est. 1.5%
- −$92 /mo · $1,110/yr
- Insurance
- −$31
- HOA
- −$0
- Vacancy / Maint / Mgmt
- −$247
- Net cashflow
- $416
Break-even live
UW: 25.0% down · 7.5% · 30yr · 1.5% tax · 5.0% vac · 8.0% maint · 8.0% mgmt
Financing live
Cash to close
- Down payment
- $18,500
- Closing costs
- $2,220
- Reserves months
- —
- Total cash needed
- —
Loan-product check · same deal, 3 products live
Conventional
25% down · 7.5% · 30yr
- Down + closing
- —
- Monthly P&I
- —
- Monthly cashflow
- —
- DSCR
- —
- Eligible?
- —
Personal DTI + credit; lowest rate.
DSCR
20% down · 8.5% · 30yr
- Down + closing
- —
- Monthly P&I
- —
- Monthly cashflow
- —
- DSCR
- —
- Eligible?
- —
No personal income docs; deal must DSCR.
Hard money
10% down · 12.0% · 12mo
- Down + closing
- —
- Monthly P&I
- —
- Monthly cashflow
- —
- DSCR
- —
- Eligible?
- —
Short-term bridge; refi at stabilization.
Listing history 13 events
-
2026-06-05statusdays on market $74,000 Pending 72 DOM
-
2026-06-03days on market $74,000 Active 71 DOM
-
2026-06-02days on market $74,000 Active 70 DOM
-
2026-06-01days on market $74,000 Active 69 DOM
-
2026-05-31days on market $74,000 Active 68 DOM
-
2026-05-30days on market $74,000 Active 67 DOM
-
2026-05-21price $74,000
-
2026-03-19$69,900 Active
-
2026-03-09historical Active Under Contract
-
2026-02-09price $65,000
-
2025-12-18$75,000 Active
-
2005-11-15soldstatus $79,000
-
2003-12-11soldstatus $28,500
ⓘ Source: listings_history table (triggers on properties + properties_extension) + one-shot
backfill from property_details.listing_events for pre-trigger history.
Climate risk First Street
- Flood 1/10 Low FEMA zone X (unshaded) · 0% chance over 30 yrs
- Wildfire 1/10 Low
- Heat 7/10 Severe 7 d/yr ≥108°F today · 19 d/yr by 30 yrs out
- Wind 3/10 Moderate 5% chance of damaging wind over 30 yrs
- Air quality 1/10 Low 0 unhealthy d/yr today · 0 by 30 yrs out
Nearby sold comps map
Loading sold comps map…
Walkable amenities ~0.75 mi
Loading nearby amenities…
Taxation est. · year 1
- Rental income
- $14,086
- − Mortgage interest
- −$4,145
- − Property taxes
- −$1,110
- − Insurance
- −$370
- − Repairs & maintenance
- −$1,127
- − Management
- −$1,127
- − Depreciation
- −$2,153
- Taxable income
- $4,054
- Est. tax owed @ 24.0%
- −$973
- After-tax cash flow
- $4,018/yr
For passive investors: Depreciation is non-cash, so a rental often shows a tax loss while cash-flowing — sheltering income. Rental losses are passive: they offset passive income freely, and up to $25,000/yr can offset ordinary (W-2) income if you actively participate and your MAGI is under $100k (phasing out to $0 by $150k); unused losses carry forward. On sale, claimed depreciation is recaptured at up to 25%, and gains may owe capital-gains tax (a 1031 exchange can defer both). Figures are a year-1 estimate at your 24.0% rate — not tax advice; consult a CPA.
Schools (NCES district)
- District
- Lawton
- NCES district ID
- 4017250
- Math proficiency
- 20% ▼ -12.00%
- Reading proficiency
- 26% ▼ -9.00%
- Median HH income
- $42,618
- Composite
- 19.68/100
- National rank
- #8732
- State rank
- #137 of 270 in OK
Livability — Lawton
- Score
- 63/100
- State rank
- #206
- US rank
- #15131
Category grades
Schools grade is shown separately in the Schools card above.
Census & demographics
- Census place
- Lawton, OK
- County
- Comanche County · 96,361 people
- City population
- 89,233
- Metro
- Lawton, OK
- Population (ZIP)
- 21,046
- Household income
- $62,132
- Rent vs Own
- Severe rent burden
- 979.0
Population outlook (Comanche County) Hauer SSP2
- Today (2025)
- 124,518 people
- By 2030
- 124,231 · -0.2%
- By 2040
- 122,193 · -1.9%
- By 2050
- 120,368 · -3.3%
- By 2075
- 120,492 · -3.2%
- By 2100
- 123,113 · -1.1%
Race, ethnicity, and origin ACS 2023
- Neighborhood character
- Diverse neighborhood (Simpson 0.65)
- Race & ethnicity
- White 56% Hispanic / Latino 14% Two or more races 13% Black 13% Native American 7% Asian 2%
- Hispanic origin (detail)
- Mexican 7% Puerto Rican 4%
- Common ancestry
- Lithuanian 2% Slovak 2% Italian 1%
- Foreign-born
- 5% · Canada, South Korea
- Languages at home
- 89% English-only · Spanish 6% German/W. Germanic 1% Other Asian/Pacific 1%
Political lean MEDSL · Comanche
- 2024 margin
- Strong R (+23.3) · D 37.4% · R 60.7% · Other 1.9%
- 2008→2024 swing
- -5.8pp toward R · 2008: -17.5pp · 2024: -23.3pp
- All cycles
- 2024: R+23.3 2020: R+20.1 2016: R+23.7 2012: R+17.0 2008: R+17.5
Not yet ingested
- Civics
- —
Market trends
- HPI YoY
- ▼ -38.48%
- Current HPI
- 127.057
- Rent YoY
- ▲ 0.25%
- Metro
- Lawton, OK
- State GDP YoY
- ▲ 1.55%
- F500 in state
- 6
Industry mix (Fortune 500 HQ in OK)
| Industry | F500 HQs | Revenue |
|---|---|---|
| Energy | 3 | $48B |
|
||
Price history
+159.6% since first listed7 events — show timeline
- 2026-05-21 Price Changed $74,000 LBRMLS
- 2026-03-19 Listed $69,900 LBRMLS
- 2026-03-09 Contingent — LBRMLS
- 2026-02-09 Price Changed $65,000 LBRMLS
- 2025-12-18 Listed $75,000 LBRMLS
- 2005-11-15 Sold (Public Records) $79,000 Public Records
- 2003-12-11 Sold (Public Records) $28,500 Public Records
Cash-flow waterfall
monthlySold comps — $/sqft
last 12 mo · ≤1 miLoading sold comps…