120 Grassy Key Ln #38 · Winding Cypress, FL
Flood risk 8/10 · Major
- FEMA flood zone
- AE
- Chance of flooding over 30 yrs
- 0.97%
- Est. flood insurance / yr
- $1,737 – $8,500
Fire risk 5/10 · Moderate
- Est. fire insurance / yr
- $947 – $1,759
Heat risk 10/10 · Severe
- Hot days now (above 108°F)
- 7 days/yr
- Hot days in 30 yrs
- 30 days/yr
Wind risk 10/10 · Severe
- Chance of severe wind over 30 yrs
- 99.0%
Air-quality risk 3/10 · Minor
- Unhealthy air days now
- 3 days/yr
- Unhealthy air days in 30 yrs
- 3 days/yr
Risk factors via First Street. Map © Google.
Why this score? — see what drove the B+ grade
The composite is a weighted blend of 9 inputs, each scored 0–100. Each bar is that input's sub-score; the figure is the points it added to the 100-point composite (weight × sub-score).
- Cash flow +30.0/30.0
- 1% rule +10.0/10.0
- DSCR +10.0/10.0
- ARV discount +7.5/15.0
- Schools +5.0/10.0
- Appreciation +4.3/10.0
- Rent growth +3.3/5.0
- Livability +2.5/5.0
- Condition / age +2.5/5.0
$139,000
🖨 Deal sheet 📄 Offer letter ✓ Due diligence
Listing remarks
You Own the Land! Strong Investment Opportunity or Discover a peaceful and secure retirement in this beautiful and peaceful 55+ community in the West Wind Estates, where your homeownership is truly complete. This Fully Updated Unit is a must see! Enjoy the awesome country club style living with clubhouse, community pool, community room, Pickleball, Shuttle board, Tennis courts and all for a low fee of $375 per quarter. If you enjoy boating this community is for you minutes away from a public access boat ramp off Marco Island with a quick boat ride out to the Gulf (this is invaluable). West Wind Estates is also minutes from Marco Island, Tin City, Celebration Park, Downtown Naples, Naples Be
Key facts
- Community pool
- 55 community
- Prime location
Tags
Property features AI
Finance
- Other: Unit is one of 267 units in the community; single unit in the building
- Financial info: No investor-specific income or expense details provided
- HOA & community: Mandatory HOA (mobile/manufactured community, non-gated); Quarterly master HOA fee of $375; Total annual recurring fees approximately $1,500; One-time fees approximately $200; Professional management; HOA maintenance includes recreation facilities; Community amenities: clubhouse, community pool, community room, boat storage, extra storage, internet access, tennis court, pickleball, and shuffleboard
Exterior
- Parking: Attached 2-space carport; Paved driveway
- Security: No security details provided
- Utilities: Central water; Central sewer; Cable available; Electric service for heating and cooling
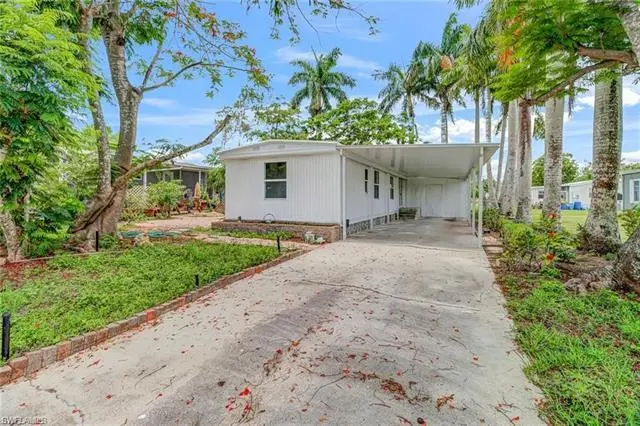
- Home design: Manufactured residential home; Florida-style description; Built in 1982; Rear exposure faces north; Single-story
- Construction: Vinyl siding exterior; Metal roof; Manufactured construction; Built in 1982
- Exterior features: Patio; Exterior storage; Single-hung windows; Vinyl siding; Metal roof; Landscaped view
Interior
- Kitchen: Electric cooktop; Self-cleaning oven; Refrigerator/freezer with icemaker
- Bedrooms: Two bedrooms (split bedroom layout)
- Flooring: No flooring details provided
- Bathrooms: One full bathroom with combined tub and shower
- Heating & cooling: Central electric heat; Central electric cooling
- Interior features: Cable prewired; high-speed internet available; Family room and great room; Unfurnished; Split bedroom floor plan
- Laundry & utility: No specific laundry details provided
Neighborhood map
What this means for you Summary
Snapshot
- This is a 2-bed/1.0-bath condo listed at $139k.
Deal economics
- At list price, monthly cash flow is $389 ($5k/yr) — positive.
- The deal already cash-flows at list — no discount required.
- Meets the 1% rule at list price ($2k rent vs $139k).
- Recommended offer: $135k (3.0% below list) — sets the bar for market timing.
Location & tenants
- Location reads: area grade B — affects rentability + tenant quality, not the cash-flow math above.
- Collier (suburban): math 60% / reading 56% proficiency, ranked #16 of 73 in FL (top 22%) — acceptable for families but not a draw, mixed tenant base, ~2y average lease.
- Market conditions: Rents rising (+3.2%/yr); 900 active listings in the ZIP; solid renter incomes; 3,520 units permitted in Collier County in 2024 (959 in 5+ unit buildings).
- This rent runs 31% of the median local income ($89k/yr) — at the standard rent-burdened threshold; future hikes will face affordability resistance.
Forward outlook
- Local home prices are declining (-1.5%/yr); year-one equity from $961 of loan paydown is wiped out by about $2k of value loss. Plan a longer hold.
- Collier County population projected at +30% by 2050 — long-run rental-demand tailwind backs the buy-and-hold thesis.
- At projected returns (-1.5% appreciation + 3.2% rent growth), your $39k cash investment doubles in ~8 years — after that, you're playing with house money.
Negotiation context
- It's been on market 34 days — a 3% lower offer ($135k) is reasonable based on typical stale-listing flexibility.
- 4 sale attempts since 2y ago; this cycle's ask is 9167% above the opening price — seller raised mid-cycle; expect resistance to lowballs.
- Current owner paid $40k; list at $139k implies a 248% gain — meaningful room to come down on a strong offer.
Risks & watch-outs
- Watch-outs: flood insurance adds $427/mo.
- Climate carrying-cost: in FEMA flood zone AE (mandatory federal flood insurance); severe wind risk, 99% chance of damaging wind over 30y; moderate wildfire risk; extreme-heat days projected 7→30/yr by 2055 (HVAC capex compounding) — expect insurance premiums to compound above CPI over the hold.
Questions for the listing agent
- It's been on market 34 days. Have you received any prior offers? Is the seller open to a 3% concession, seller financing, or rate buy-down credit?
- What's the actual annual flood-insurance premium (NFIP or private), and is the property in a SFHA with mandatory coverage?
- What does the HOA fee cover, when was the last increase, and are there any pending special assessments or reserve-fund shortfalls?
- Any open or pending special assessments — roof, HVAC, plumbing, elevator, façade? What's the per-unit balance and payoff schedule, and is the seller paying it off at close or rolling it to the buyer?
- Is there a deadline driving the sale (1031 exchange, divorce, estate, relocation)? That informs how much negotiation room exists.
- What's the average days-on-market for RENTAL listings here right now (not sales)? A rising rental-DOM trend means longer vacancies and softer asking-rent achievability than the comps imply.
- What's the recent tenant-quality profile in this submarket — average credit score on applications, eviction rate, late-payment / NSF rate, and stable-employment percentage? A property-management company in the area should have these aggregated.
- How much new apartment / multifamily construction is in the pipeline within 1–3 miles? Heavy new supply (>2% of stock underway) typically softens rents 12–24 months out; light construction supports rent growth.
Investment metrics
- 1% rule
- 1.69% ✓
- Cap rate
- 13.34%
- Cash-on-cash
- 25.16%
- DSCR
- 2.12
- GRM
- 4.9
CMA / ARV
No comps found within radius.
Projected returns pro-forma
-1.48% appreciation · 3.21% rent growth · sell at horizon
- IRR
- 7.2%
- Equity multiple
- 1.31×
- Total profit
- $12,189
- Equity at exit
- $30,373
- IRR
- 14.5%
- Equity multiple
- 2.40×
- Total profit
- $54,301
- Equity at exit
- $29,258
Cash invested: $38,920 (down + closing). Projections, not guarantees.
Landlord ↔ Tenant lean methodology
- Overall (STATE)
- 87 Strongly Landlord-Friendly
- State Florida
- 87 Strongly Landlord-Friendly · R+3
- County
- — inherits STATE
- City
- — inherits STATE
ZIP-level market 34114
- Home prices YoY
- -0.6%
- Rents YoY
- 3.2%
- Active inventory
- 900
- Price-to-rent
- 4.9×
Monthly cashflow live
- Estimated rent
- $2,343 medium interval (Pro) →
- Mortgage (P&I)
- −$729
- Tax from tax record
- −$123 /mo · $1,479/yr
- Insurance
- −$58
- Flood insurance flood zone
- −$427 /mo · $5,118/yr
- HOA
- −$125
- Vacancy / Maint / Mgmt
- −$492
- Net cashflow
- $389
Break-even live
UW: 25.0% down · 7.5% · 30yr · 1.5% tax · 5.0% vac · 8.0% maint · 8.0% mgmt
Financing live
Cash to close
- Down payment
- $34,750
- Closing costs
- $4,170
- Reserves months
- —
- Total cash needed
- —
Loan-product check · same deal, 3 products live
Conventional
25% down · 7.5% · 30yr
- Down + closing
- —
- Monthly P&I
- —
- Monthly cashflow
- —
- DSCR
- —
- Eligible?
- —
Personal DTI + credit; lowest rate.
DSCR
20% down · 8.5% · 30yr
- Down + closing
- —
- Monthly P&I
- —
- Monthly cashflow
- —
- DSCR
- —
- Eligible?
- —
No personal income docs; deal must DSCR.
Hard money
10% down · 12.0% · 12mo
- Down + closing
- —
- Monthly P&I
- —
- Monthly cashflow
- —
- DSCR
- —
- Eligible?
- —
Short-term bridge; refi at stabilization.
HOA detail condo
- Monthly dues
- $125 · $1,500/yr
- Likely covers
- pool
- Assessments
- None detected in remarks — confirm with the listing agent.
Listing history 22 events
-
2026-06-18days on market $139,000 Active 34 DOM
-
2026-06-17days on market $139,000 Active 33 DOM
-
2026-06-16days on market $139,000 Active 32 DOM
-
2026-06-15days on market $139,000 Active 31 DOM
-
2026-06-14days on market $139,000 Active 29 DOM
-
2026-06-10days on market $139,000 Active 26 DOM
-
2026-06-09days on market $139,000 Active 25 DOM
-
2026-06-08days on market $139,000 Active 24 DOM
-
2026-06-07days on market $139,000 Active 23 DOM
-
2026-06-03days on market $139,000 Active 19 DOM
-
2026-06-02days on market $139,000 Active 18 DOM
-
2026-06-01days on market $139,000 Active 17 DOM
-
2026-05-31days on market $139,000 Active 16 DOM
-
2026-05-30days on market $139,000 Active 15 DOM
-
2026-05-17$1,500
-
2026-05-15$139,000 Active
-
2026-02-28historical
-
2025-09-26$155,000 Active
-
2025-05-05historical
-
2024-06-20$189,000 Active
-
1996-10-21soldstatus $40,000
-
1988-03-01soldstatus $30,000
ⓘ Source: listings_history table (triggers on properties + properties_extension) + one-shot
backfill from property_details.listing_events for pre-trigger history.
Tax reassessment forecast FL · Resets to sale price
- Current annual tax
- $1,479 · $123/mo
- Projected year-2 tax
- $1,479 · $123/mo
- Expected delta
- $0/yr ($0/mo · 0.0%)
ⓘ Screening estimate from a state-policy table — verify with the county assessor before closing.
Climate risk First Street
- Flood 8/10 Severe FEMA zone AE · 97% chance over 30 yrs
- Wildfire 5/10 Major
- Heat 10/10 Extreme 7 d/yr ≥108°F today · 30 d/yr by 30 yrs out
- Wind 10/10 Extreme 99% chance of damaging wind over 30 yrs
- Air quality 3/10 Moderate 3 unhealthy d/yr today · 3 by 30 yrs out
Nearby sold comps map
Loading sold comps map…
Walkable amenities ~0.75 mi
Loading nearby amenities…
Taxation est. · year 1
- Rental income
- $28,118
- − Mortgage interest
- −$7,786
- − Property taxes
- −$1,479
- − Insurance
- −$5,814
- − Repairs & maintenance
- −$2,249
- − Management
- −$2,249
- − HOA
- −$1,500
- − Depreciation
- −$4,044
- Taxable income
- $2,997
- Est. tax owed @ 24.0%
- −$719
- After-tax cash flow
- $3,954/yr
For passive investors: Depreciation is non-cash, so a rental often shows a tax loss while cash-flowing — sheltering income. Rental losses are passive: they offset passive income freely, and up to $25,000/yr can offset ordinary (W-2) income if you actively participate and your MAGI is under $100k (phasing out to $0 by $150k); unused losses carry forward. On sale, claimed depreciation is recaptured at up to 25%, and gains may owe capital-gains tax (a 1031 exchange can defer both). Figures are a year-1 estimate at your 24.0% rate — not tax advice; consult a CPA.
Schools (NCES district)
- District
- Collier
- NCES district ID
- 1200330
- Math proficiency
- 60% ▼ -4.00%
- Reading proficiency
- 56% ▼ -2.00%
- Median HH income
- $58,275
- Composite
- 50.23/100
- National rank
- #1892
- State rank
- #16 of 73 in FL
Livability — Winding Cypress
No livability data for this city. (Only ~50 U.S. cities are tracked.)
Census & demographics
- County
- Collier County · 396,295 people
- Metro
- Naples-Marco Island, FL
- Population (ZIP)
- 23,559
- Household income
- $89,334
- Rent vs Own
- Severe rent burden
- 550.0
Population outlook (Collier County) Hauer SSP2
- Today (2025)
- 420,858 people
- By 2030
- 450,054 · +6.9%
- By 2040
- 502,232 · +19.3%
- By 2050
- 544,932 · +29.5%
- By 2075
- 627,203 · +49.0%
- By 2100
- 659,015 · +56.6%
Race, ethnicity, and origin ACS 2023
- Neighborhood character
- Predominantly White (72%)
- Race & ethnicity
- White 72% Hispanic / Latino 17% Two or more races 13% Black 7%
- Hispanic origin (detail)
- Mexican 7% Puerto Rican 1% Cuban 3%
- Common ancestry
- Hispanic 5% Romanian 4% Lithuanian 1%
- Foreign-born
- 21% · Canada, Jamaica
- Languages at home
- 75% English-only · Spanish 15% French/Haitian/Cajun 5% Other Indo-European 4%
Political lean MEDSL · Collier
- 2024 margin
- Solid R (+33.1) · D 33.1% · R 66.2%
- 2008→2024 swing
- -10.6pp toward R · 2008: -22.5pp · 2024: -33.1pp
- All cycles
- 2024: R+33.1 2020: R+24.7 2016: R+26.0 2012: R+30.1 2008: R+22.5
Not yet ingested
- Civics
- —
Market trends
- HPI YoY
- ▼ -1.48%
- Current HPI
- 266.5545
- Rent YoY
- ▲ 3.21%
- Metro
- Naples-Marco Island, FL
- State GDP YoY
- ▲ 3.28%
- F500 in state
- 36
Industry mix (Fortune 500 HQ in FL)
| Industry | F500 HQs | Revenue |
|---|---|---|
| Industrial Technology | 2 | $29B |
|
||
| Insurance | 2 | $17B |
|
||
| Retail | 1 | $60B |
|
||
| Technology Distribution | 1 | $58B |
|
||
| Homebuilding | 1 | $35B |
|
||
| Technology Manufacturing | 1 | $35B |
|
||
Price history
-95.0% since first listed8 events — show timeline
- 2026-05-17 Listed for Rent $1,500 FGCMLS
- 2026-05-15 Listed $139,000 NAPLESMLS
- 2026-02-28 Listing Removed — NAPLESMLS
- 2025-09-26 Listed $155,000 NAPLESMLS
- 2025-05-05 Listing Removed — NAPLESMLS
- 2024-06-20 Listed $189,000 NAPLESMLS
- 1996-10-21 Sold (Public Records) $40,000 Public Records
- 1988-03-01 Sold (Public Records) $30,000 Public Records
Property tax history
+28.1%/yrLatest (2025): $1,479 · +8.3% YoY. Source: county tax records.
Cash-flow waterfall
monthlySold comps — $/sqft
last 12 mo · ≤1 miLoading sold comps…