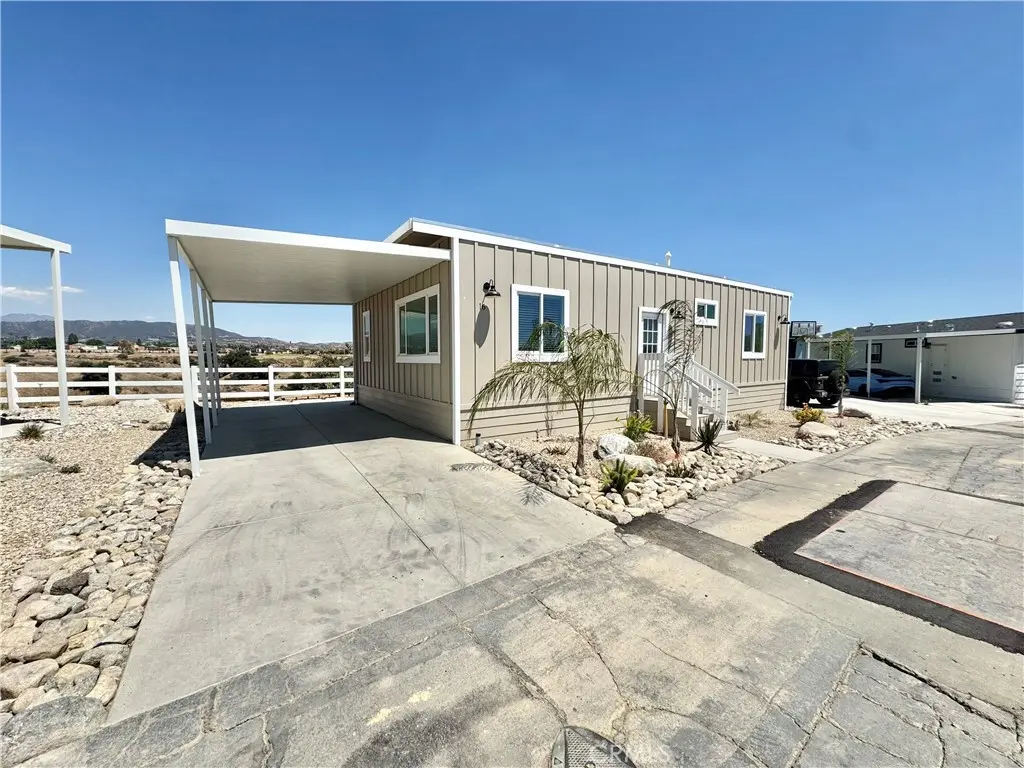
1134 Villa Calimesa #16 · Calimesa, CA
Flood risk 1/10 · Minimal
- FEMA flood zone
- D
- Chance of flooding over 30 yrs
- 0.0%
- Est. flood insurance / yr
- $544 – $1,084
Fire risk 10/10 · Severe
- Est. fire insurance / yr
- $659 – $1,223
Heat risk 6/10 · Moderate
- Hot days now (above 100°F)
- 7 days/yr
- Hot days in 30 yrs
- 20 days/yr
Wind risk 1/10 · Minimal
- Chance of severe wind over 30 yrs
- —
Air-quality risk 10/10 · Severe
- Unhealthy air days now
- 30 days/yr
- Unhealthy air days in 30 yrs
- 37 days/yr
Risk factors via First Street. Map © Google.
Why this score? — see what drove the C+ grade
The composite is a weighted blend of 9 inputs, each scored 0–100. Each bar is that input's sub-score; the figure is the points it added to the 100-point composite (weight × sub-score).
- Cash flow +28.4/30.0
- DSCR +10.0/10.0
- 1% rule +7.8/10.0
- Condition / age +4.8/5.0
- Schools +3.8/10.0
- Livability +2.8/5.0
- Rent growth +2.5/5.0
- ARV discount +0.0/15.0
- Appreciation +0.0/10.0
$130,000
🖨 Deal sheet 📄 Offer letter ✓ Due diligence
Listing remarks
BRAND NEW NEVER LIVED IN 3 bed 2 bath home with an amazing view from the backyard inside a gated community with pool, spa and clubhouse. Agent check private remarks about park financing option
Key facts
- Gated community
- Clubhouse
- Spa
Tags
Property features AI
Finance
- Other: Manager approval required for the park
- Financial info: Land lease of $2,272 per month
- HOA & community: Suburban community
Exterior
- Parking: Located in Las Palomas Estates park
- Utilities: Public sewer; District/public water
- Home design: Single-story mobile home; Mobile home dimensions approximately 24 by 40; Mobile home remains on site
- Construction: Year built as provided by builder
- Exterior features: Community pool; Sprinkler system
Interior
- Bathrooms: 2 full bathrooms
- Interior features: Entry located on the main level
- Laundry & utility: Laundry inside the home
Neighborhood map
What this means for you Summary
Snapshot
- This is a 3-bed/2.0-bath manufactured listed at $130k. Condition is rated excellent.
Deal economics
- At list price, monthly cash flow is $419 ($5k/yr) — positive.
- The deal already cash-flows at list — no discount required.
- Meets the 1% rule at list price ($2k rent vs $130k).
- Recommended offer: $128k (1.5% below list) — sets the bar for market timing.
- Cap rate 10.2% vs local median 6.7% in Calimesa — top-decile yield for the area; either an underpriced asset or a hidden risk that comps aren't pricing in. Stress-test before assuming the spread holds.
Location & tenants
- Location reads 55/100 on livability (#865 in CA) — a working-class tenant base; expect higher turnover. Strengths: housing A+, crime A-, employment B; Watch: health & safety D+, schools D, amenities F.
- Yucaipa-Calimesa Joint Unified (suburban): math 32% / reading 55% proficiency, ranked #195 of 517 in CA (top 38%) — families likely to look elsewhere, expect single-tenant / working-renter base with shorter leases.
- Market conditions: 67 active listings in the ZIP; 3 comparable units currently listed for rent nearby; rentals at typical pace (median 15d on market — plan ~3-4 weeks tenant-placement turnaround); 9,195 units permitted in Riverside County in 2024 (1,512 in 5+ unit buildings).
Forward outlook
- Local home prices are declining (-3.0%/yr); year-one equity from $899 of loan paydown is wiped out by about $4k of value loss. Plan a longer hold.
- Riverside County population projected at +22% by 2050 — long-run rental-demand tailwind backs the buy-and-hold thesis.
- At projected returns (-3.0% appreciation + 3.0% rent growth), your $36k cash investment doubles in ~9 years — after that, you're playing with house money.
Negotiation context
- It's been on market 19 days — a 2% lower offer ($128k) is reasonable based on typical stale-listing flexibility.
Risks & watch-outs
- Climate carrying-cost: severe wildfire risk; extreme-heat days projected 7→20/yr by 2055 (HVAC capex compounding) — expect insurance premiums to compound above CPI over the hold.
Questions for the listing agent
- Is there a deadline driving the sale (1031 exchange, divorce, estate, relocation)? That informs how much negotiation room exists.
- Schools are D-rated, which usually means shorter tenancies and higher turnover. Who's the typical renter profile here, and what's been the actual vacancy rate?
- What's the average days-on-market for RENTAL listings here right now (not sales)? A rising rental-DOM trend means longer vacancies and softer asking-rent achievability than the comps imply.
- What's the recent tenant-quality profile in this submarket — average credit score on applications, eviction rate, late-payment / NSF rate, and stable-employment percentage? A property-management company in the area should have these aggregated.
- How much new for-sale + rental construction is in the pipeline within 1–3 miles? Heavy new supply typically softens prices + rents 12–24 months out; constrained supply supports both.
Investment metrics
- 1% rule
- 1.28% ✓
- Cap rate
- 10.16%
- Cash-on-cash
- 13.82%
- DSCR
- 1.62
- GRM
- 6.5
CMA / ARV
- ARV (on-the-fly)
- $99,900
- Comps found
- 8
Show comp detail 8 sales within ~0.75 mi
| Address | Dist | Beds/Ba | Sqft | Sold | Price | $/sf | Match |
|---|---|---|---|---|---|---|---|
| 1134 Villa Calimesa Ln #58 | 0.01mi | 3/2.0 | 960 (+4%) | 1mo | $165,000 | $172 | 92 |
| 1134 Villa Calimesa Ln #95 | 0.01mi | 3/2.0 | 925 (0%) | 10mo | $100,000 | $108 | 91 |
| 1134 Villa Calimesa Ln #39 | 0.01mi | 3/2.0 | 960 (+4%) | 7mo | $95,000 | $99 | 88 |
| 1134 Villa Calimesa #106 | 0.01mi | 2/2.0 (-1) | 960 (+4%) | 2mo | $42,500 | $44 | 86 |
| 1134 Villa Calimesa Ln #50 | 0.01mi | 3/2.0 | 920 (-0%) | 16mo | $100,000 | $109 | 85 |
| 1134 Villa Calimesa Ln #87 | 0.01mi | 3/2.0 | 925 (0%) | 22mo | $80,000 | $86 | 81 |
| 1134 Villa Calimesa Ln #70 | 0.01mi | 2/1.0 (-1) | 840 (-9%) | 15mo | $99,000 | $118 | 63 |
| 1134 Villa Calimesa Ln #102 | 0.08mi | 2/1.0 (-1) | 840 (-9%) | 17mo | $89,000 | $106 | 58 |
Match score weights: distance 35% · size 25% · config 20% · recency 20%. Top-matched comps best support the ARV.
Projected returns pro-forma
-3.0% appreciation · 3.0% rent growth · sell at horizon
- IRR
- 4.0%
- Equity multiple
- 1.16×
- Total profit
- $5,668
- Equity at exit
- $19,383
- IRR
- 13.5%
- Equity multiple
- 2.08×
- Total profit
- $39,430
- Equity at exit
- $11,240
Cash invested: $36,400 (down + closing). Projections, not guarantees.
Landlord ↔ Tenant lean methodology
- Overall (STATE)
- 18 Strongly Tenant-Friendly
- State California
- 18 Strongly Tenant-Friendly · D+13
- County
- — inherits STATE
- City
- — inherits STATE
ZIP-level market 92320
- Home prices YoY
- -22.2%
- Active inventory
- 67
- Price-to-rent
- 6.5×
Monthly cashflow live
- Estimated rent
- $1,668 medium interval (Pro) →
- Mortgage (P&I)
- −$682
- Tax est. 1.5%
- −$162 /mo · $1,950/yr
- Insurance
- −$54
- HOA
- −$0
- Vacancy / Maint / Mgmt
- −$350
- Net cashflow
- $419
Break-even live
UW: 25.0% down · 7.5% · 30yr · 1.5% tax · 5.0% vac · 8.0% maint · 8.0% mgmt
Financing live
Cash to close
- Down payment
- $32,500
- Closing costs
- $3,900
- Reserves months
- —
- Total cash needed
- —
Loan-product check · same deal, 3 products live
Conventional
25% down · 7.5% · 30yr
- Down + closing
- —
- Monthly P&I
- —
- Monthly cashflow
- —
- DSCR
- —
- Eligible?
- —
Personal DTI + credit; lowest rate.
DSCR
20% down · 8.5% · 30yr
- Down + closing
- —
- Monthly P&I
- —
- Monthly cashflow
- —
- DSCR
- —
- Eligible?
- —
No personal income docs; deal must DSCR.
Hard money
10% down · 12.0% · 12mo
- Down + closing
- —
- Monthly P&I
- —
- Monthly cashflow
- —
- DSCR
- —
- Eligible?
- —
Short-term bridge; refi at stabilization.
Rent comps 3 comps
| Address | Beds | Baths | Sqft | Rent | $/sqft | DOM | Units | Dist |
|---|---|---|---|---|---|---|---|---|
| 947 Park Ave Calimesa, CA | 2.0 | 1.0 | 800 | $1,600 | $2.00 | 14d | 1 | 0.67mi |
| 13645 5th St #75 Yucaipa, CA | 2.0 | 2.0 | 890 | $1,700 | $1.91 | 43d | 1 | 0.95mi |
| 213 W County Line Rd #5 Calimesa, CA | 2.0 | 2.0 | 950 | $1,750 | $1.84 | 11d | 1 | 1.44mi |
Listing history 15 events
-
2026-06-18days on market $130,000 Active 19 DOM
-
2026-06-17days on market $130,000 Active 18 DOM
-
2026-06-16days on market $130,000 Active 17 DOM
-
2026-06-15days on market $130,000 Active 16 DOM
-
2026-06-13days on market $130,000 Active 14 DOM
-
2026-06-13days on market $130,000 Active 13 DOM
-
2026-06-09days on market $130,000 Active 10 DOM
-
2026-06-08days on market $130,000 Active 9 DOM
-
2026-06-07days on market $130,000 Active 8 DOM
-
2026-06-04days on market $130,000 Active 5 DOM
-
2026-06-03days on market $130,000 Active 4 DOM
-
2026-06-02days on market $130,000 Active 3 DOM
-
2026-06-01days on market $130,000 Active 2 DOM
-
2026-05-31remarks 192-char remark
-
2026-05-31$130,000 Active 1 DOM
ⓘ Source: listings_history table (triggers on properties + properties_extension) + one-shot
backfill from property_details.listing_events for pre-trigger history.
Climate risk First Street
- Flood 1/10 Low FEMA zone D · 0% chance over 30 yrs
- Wildfire 10/10 Extreme
- Heat 6/10 Major 7 d/yr ≥100°F today · 20 d/yr by 30 yrs out
- Wind 1/10 Low
- Air quality 10/10 Extreme 30 unhealthy d/yr today · 37 by 30 yrs out
Nearby sold comps map
Loading sold comps map…
Walkable amenities ~0.75 mi
Loading nearby amenities…
Taxation est. · year 1
- Rental income
- $20,016
- − Mortgage interest
- −$7,282
- − Property taxes
- −$1,950
- − Insurance
- −$650
- − Repairs & maintenance
- −$1,601
- − Management
- −$1,601
- − Depreciation
- −$3,782
- Taxable income
- $3,150
- Est. tax owed @ 24.0%
- −$756
- After-tax cash flow
- $4,276/yr
For passive investors: Depreciation is non-cash, so a rental often shows a tax loss while cash-flowing — sheltering income. Rental losses are passive: they offset passive income freely, and up to $25,000/yr can offset ordinary (W-2) income if you actively participate and your MAGI is under $100k (phasing out to $0 by $150k); unused losses carry forward. On sale, claimed depreciation is recaptured at up to 25%, and gains may owe capital-gains tax (a 1031 exchange can defer both). Figures are a year-1 estimate at your 24.0% rate — not tax advice; consult a CPA.
Condition & rehab AI · 6 photos
This brand new, never-lived-in manufactured home is in excellent condition with modern features and a great view. It's ready for immediate occupancy and can be enhanced with minor updates to further increase its value.
Value-add opportunities
- Both Landscaping improvements — Enhances curb appeal and adds value.
- Both Painting interior walls — Fresh paint can make the home more appealing and increase its value.
- Both Add smart home features — Modernizes the home and adds value for both resale and rental.
- Both Install smart thermostat — Saves on energy costs and adds value for both resale and rental.
- Both Add smart lighting system — Enhances the home's curb appeal and adds value for both resale and rental.
Renovation cost estimate screening
Value-add ROI direction
- Both Landscaping improvements — Enhances curb appeal and adds value. ↑
- Both Painting interior walls — Fresh paint can make the home more appealing and increase its value. ↑
- Both Add smart home features — Modernizes the home and adds value for both resale and rental. ↑
- Both Install smart thermostat — Saves on energy costs and adds value for both resale and rental. ↑
- Both Add smart lighting system — Enhances the home's curb appeal and adds value for both resale and rental. ↑
ⓘ Cost ranges are severity-bucket heuristics (US national rule-of-thumb). Get contractor quotes + a written scope before underwriting a rehab budget.
Schools (NCES district)
- District
- Yucaipa-Calimesa Joint Unified
- NCES district ID
- 0643560
- Math proficiency
- 32% ▼ -4.00%
- Reading proficiency
- 55% ▲ 6.00%
- Median HH income
- $58,243
- Composite
- 38.09/100
- National rank
- #4277
- State rank
- #195 of 517 in CA
Livability — Calimesa
- Score
- 55/100
- State rank
- #865
- US rank
- #23579
Category grades
Schools grade is shown separately in the Schools card above.
Census & demographics
- Census place
- Calimesa, CA
- City population
- 10,680
- Population (ZIP)
- 10,680
Population outlook (Riverside County) Hauer SSP2
- Today (2025)
- 2,664,475 people
- By 2030
- 2,802,692 · +5.2%
- By 2040
- 3,050,904 · +14.5%
- By 2050
- 3,256,783 · +22.2%
- By 2075
- 3,655,058 · +37.2%
- By 2100
- 3,766,594 · +41.4%
Race, ethnicity, and origin ACS 2023
- Neighborhood character
- Diverse neighborhood (Simpson 0.57)
- Race & ethnicity
- White 57% Hispanic / Latino 31% Two or more races 12% Asian 3% Black 3% Native American 1%
- Hispanic origin (detail)
- Mexican 27%
- Common ancestry
- Italian 2% Slovak 1% Lithuanian 1%
- Foreign-born
- 7% · Canada
- Languages at home
- 85% English-only · Spanish 12% Tagalog/Filipino 2%
Political lean MEDSL · Riverside
- 2024 margin
- Toss-up / Even · D 48.0% · R 49.3% · Other 2.6%
- 2008→2024 swing
- -3.6pp toward R · 2008: 2.3pp · 2024: -1.3pp
- All cycles
- 2024: R+1.3 2020: D+8.0 2016: D+4.3 2012: R+0.4 2008: D+2.3
Not yet ingested
- Civics
- —
Market trends
- HPI YoY
- ▼ -104.13%
- Current HPI
- 364.3627
- Rent YoY
- —
- Metro
- —
- State GDP YoY
- ▲ 3.21%
- F500 in state
- 116
Industry mix (Fortune 500 HQ in CA)
| Industry | F500 HQs | Revenue |
|---|---|---|
| Technology | 27 | $1,492B |
|
||
| Financial Services | 3 | $174B |
|
||
| Retail | 3 | $44B |
|
||
| Insurance | 3 | $26B |
|
||
| Media / Entertainment | 2 | $115B |
|
||
| Pharmaceuticals / Biotech | 2 | $62B |
|
||
Price history
1 event — show timeline
- 2026-05-30 Listed $130,000 CRMLS
Cash-flow waterfall
monthlySold comps — $/sqft
last 12 mo · ≤1 miLoading sold comps…