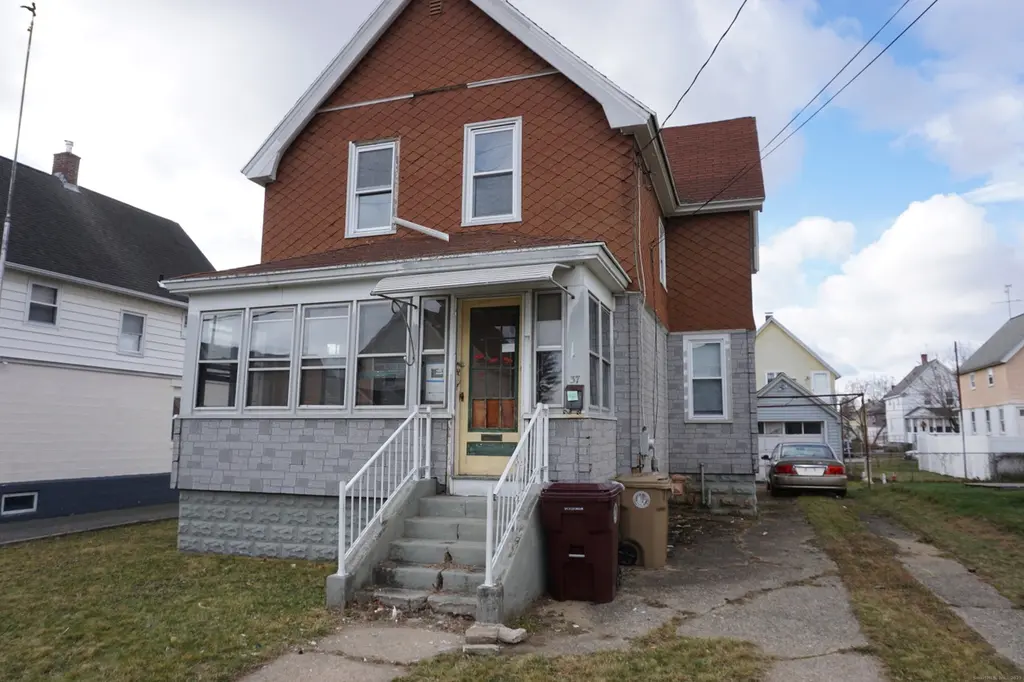
37 FRANKLIN St · Ludlow, MA
Flood risk 1/10 · Minimal
- FEMA flood zone
- X (unshaded)
- Chance of flooding over 30 yrs
- 0.0%
- Est. flood insurance / yr
- $507 – $1,088
Fire risk 3/10 · Minor
- Est. fire insurance / yr
- $915 – $1,699
Heat risk 4/10 · Minor
- Hot days now (above 96°F)
- 7 days/yr
- Hot days in 30 yrs
- 18 days/yr
Wind risk 6/10 · Moderate
- Chance of severe wind over 30 yrs
- 27.0%
Air-quality risk 2/10 · Minimal
- Unhealthy air days now
- 1 days/yr
- Unhealthy air days in 30 yrs
- 2 days/yr
Risk factors via First Street. Map © Google.
Why this score? — see what drove the C- grade
The composite is a weighted blend of 9 inputs, each scored 0–100. Each bar is that input's sub-score; the figure is the points it added to the 100-point composite (weight × sub-score).
- Cash flow +16.4/30.0
- ARV discount +15.0/15.0
- DSCR +5.1/10.0
- 1% rule +4.5/10.0
- Schools +3.2/10.0
- Rent growth +2.5/5.0
- Livability +2.5/5.0
- Condition / age +2.5/5.0
- Appreciation +0.0/10.0
$205,000
🖨 Deal sheet (PDF) 📄 Offer letter ✓ Due diligence
Listing remarks MLS
OverviewInvestors take notice!! This is a great opportunity to revamp this outdated home to your liking. This has lots of potential, easy access to shopping, highways and much more. Schedule your viewing today. Hold harmless requires to be signed prior to showing
Key facts
- 4,356 sq ft lot
- Garage
- Built 1900
Neighborhood map
What this means for you Summary
Snapshot
- This is a 3-bed/1.0-bath single-family listed at $205k.
Deal economics
- At list price, monthly cash flow is $118 ($1k/yr) — positive.
- The deal already cash-flows at list — no discount required.
- To meet the 1% rule (rent ≥ 1% of price), the offer needs to be $196k (4.5% below list).
- Recommended offer: $180k (12.0% below list) — sets the bar for market timing.
Location & tenants
- Location reads: area grade C — affects rentability + tenant quality, not the cash-flow math above.
- Ludlow (suburban): math 30% / reading 40% proficiency, ranked #228 of 302 in MA (top 76%) — families likely to look elsewhere, expect single-tenant / working-renter base with shorter leases.
- Market conditions: 38 active listings in the ZIP; 5 comparable units currently listed for rent nearby; rentals at typical pace (median 22d on market — plan ~3-4 weeks tenant-placement turnaround); 40% of comp listings sitting > 30 days — soft ceiling on asking rent; 453 units permitted in Hampden County in 2024 (116 in 5+ unit buildings).
Forward outlook
- Local home prices are declining (-3.0%/yr); year-one equity from $1k of loan paydown is wiped out by about $6k of value loss. Plan a longer hold.
- Hampden County population projected at +5% by 2050 — modest demand growth; plan on rents tracking national, not racing it.
Negotiation context
- It's been on market 202 days — a 12% lower offer ($180k) is reasonable based on typical stale-listing flexibility.
- 2 sale attempts with the ask held roughly flat each time — persistent listings suggest the price (not the market) is what's stuck; bring a comps-based counter.
Risks & watch-outs
- Watch-outs: built in 1900 — expect roof / HVAC / electrical / plumbing capex.
- Climate carrying-cost: major wind risk, 27% chance of damaging wind over 30y — expect insurance premiums to compound above CPI over the hold.
Questions for the listing agent
- It's been on market 202 days. Have you received any prior offers? Is the seller open to a 12% concession, seller financing, or rate buy-down credit?
- Built in 1900 — when were the roof, HVAC, electrical panel, plumbing, and water heater last replaced?
- Why hasn't it sold? Are there any deal-killer items the seller is aware of (foundation, flood, title, zoning, code violations)?
- Is there a deadline driving the sale (1031 exchange, divorce, estate, relocation)? That informs how much negotiation room exists.
- What's the average days-on-market for RENTAL listings here right now (not sales)? A rising rental-DOM trend means longer vacancies and softer asking-rent achievability than the comps imply.
- What's the recent tenant-quality profile in this submarket — average credit score on applications, eviction rate, late-payment / NSF rate, and stable-employment percentage? A property-management company in the area should have these aggregated.
- How much new for-sale + rental construction is in the pipeline within 1–3 miles? Heavy new supply typically softens prices + rents 12–24 months out; constrained supply supports both.
Investment metrics
- 1% rule
- 0.95% ✗
- Cap rate
- 6.98%
- Cash-on-cash
- 2.46%
- DSCR
- 1.11
- GRM
- 8.7
CMA / ARV
- ARV (median comp)
- $286,938
- List price
- $205,000
- Delta
- -28.56%
- Verdict
- UNDERPRICED
- Comps
- 20 within 1.0 mi
Show comp detail 12 sales within ~0.75 mi
| Address | Dist | Beds/Ba | Sqft | Sold | Price | $/sf | Match |
|---|---|---|---|---|---|---|---|
| 19 Essex St | 0.05mi | 3/1.5 | 1,365 (-6%) | 7mo | $275,000 | $201 | 80 |
| 72 Highland Ave | 0.32mi | 4/1.5 (+1) | 1,440 (-0%) | 7mo | $252,500 | $175 | 72 |
| 59 Prospect | 0.29mi | 3/1.5 | 1,352 (-7%) | 3mo | $260,000 | $192 | 71 |
| 101 Ray St | 0.57mi | 3/1.0 | 1,430 (-1%) | 1mo | $326,000 | $228 | 71 |
| 41 Orchard St | 0.29mi | 4/1.5 (+1) | 1,500 (+4%) | 5mo | $365,000 | $243 | 69 |
| 374 East St | 0.19mi | 3/1.0 | 1,251 (-14%) | 3mo | $240,000 | $192 | 66 |
| 18 Cambridge St | 0.29mi | 4/2.0 (+1) | 1,350 (-7%) | 1mo | $279,900 | $207 | 66 |
| 27 Greenwich St | 0.34mi | 3/1.5 | 1,344 (-7%) | 8mo | $310,000 | $231 | 64 |
| 32 Berkshire St | 0.19mi | 3/2.0 | 1,280 (-12%) | 6mo | $295,000 | $230 | 62 |
| 532 Winsor St | 0.36mi | 4/2.0 (+1) | 1,504 (+4%) | 8mo | $415,000 | $276 | 61 |
| 259 Prospect St | 0.66mi | 3/2.0 | 1,386 (-4%) | 2mo | $282,500 | $204 | 57 |
| 148 Yale St | 0.62mi | 3/1.0 | 1,232 (-15%) | 6mo | $335,000 | $272 | 41 |
Match score weights: distance 35% · size 25% · config 20% · recency 20%. Top-matched comps best support the ARV.
Projected returns pro-forma
-3.0% appreciation · 3.0% rent growth · sell at horizon
- IRR
- -12.4%
- Equity multiple
- 0.55×
- Total profit
- $-25,680
- Equity at exit
- $30,566
- IRR
- -3.3%
- Equity multiple
- 0.78×
- Total profit
- $-12,552
- Equity at exit
- $17,725
Cash invested: $57,400 (down + closing). Projections, not guarantees.
Landlord ↔ Tenant lean methodology
- Overall (STATE)
- 20 Strongly Tenant-Friendly
- State Massachusetts
- 20 Strongly Tenant-Friendly · D+15
- County
- — inherits STATE
- City
- — inherits STATE
ZIP-level market 01056
- Home prices YoY
- -31.1%
- Active inventory
- 38
- Price-to-rent
- 8.7×
Monthly cashflow live
- Estimated rent
- $1,957 high interval (Pro) →
- Mortgage (P&I)
- −$1,075
- Tax from tax record
- −$268 /mo · $3,217/yr
- Insurance
- −$85
- HOA
- −$0
- Vacancy / Maint / Mgmt
- −$411
- Net cashflow
- $118
Break-even live
Sensitivity live
| Price | -10% $234 | -5% $176 | +0% $118 | +5% $60 | +10% $2 |
|---|---|---|---|---|---|
| Rent | -10% $-37 | -5% $40 | +0% $118 | +5% $195 | +10% $272 |
| Rate | -1.0pp $221 | -0.5pp $170 | base $118 | +0.5pp $65 | +1.0pp $11 |
UW: 25.0% down · 7.5% · 30yr · 1.5% tax · 5.0% vac · 8.0% maint · 8.0% mgmt
Financing live
Cash to close
- Down payment
- $51,250
- Closing costs
- $6,150
- Reserves months
- —
- Total cash needed
- —
Loan-product check · same deal, 3 products live
Conventional
25% down · 7.5% · 30yr
- Down + closing
- —
- Monthly P&I
- —
- Monthly cashflow
- —
- DSCR
- —
- Eligible?
- —
Personal DTI + credit; lowest rate.
DSCR
20% down · 8.5% · 30yr
- Down + closing
- —
- Monthly P&I
- —
- Monthly cashflow
- —
- DSCR
- —
- Eligible?
- —
No personal income docs; deal must DSCR.
Hard money
10% down · 12.0% · 12mo
- Down + closing
- —
- Monthly P&I
- —
- Monthly cashflow
- —
- DSCR
- —
- Eligible?
- —
Short-term bridge; refi at stabilization.
Rent comps 5 comps
| Address | Beds | Baths | Sqft | Rent | $/sqft | DOM | Units | Dist |
|---|---|---|---|---|---|---|---|---|
| 33 Cypress St Unit 35 Ludlow, MA | 4.0 | 1.5 | 1250 | $2,150 | $1.72 | 21d | 1 | 0.39mi |
| 1397 Worcester St Apt 2 Indian Orchard, MA | 2.0 | 1.0 | 1000 | $1,600 | $1.60 | 44d | 1 | 1.29mi |
| 35 Healey St Unit 3rd Floor Indian Orchard, MA | 3.0 | 1.0 | 1200 | $2,000 | $1.67 | 14d | 1 | 1.31mi |
| 255 Main St Unit 3L Indian Orchard, MA | 2.0 | 1.0 | 1000 | $1,500 | $1.50 | 14d | 1 | 1.34mi |
| 13 Decatur St Unit 13 Indian Orchard, MA | 2.0 | 1.0 | 900 | $1,900 | $2.11 | 44d | 1 | 1.36mi |
Listing history 22 events
-
2026-06-18days on market $205,000 Active 202 DOM
-
2026-06-17days on market $205,000 Active 201 DOM
-
2026-06-16days on market $205,000 Active 200 DOM
-
2026-06-15days on market $205,000 Active 199 DOM
-
2026-06-14days on market $205,000 Active 197 DOM
-
2026-06-13days on market $205,000 Active 196 DOM
-
2026-06-10days on market $205,000 Active 194 DOM
-
2026-06-09days on market $205,000 Active 193 DOM
-
2026-06-08days on market $205,000 Active 192 DOM
-
2026-06-07days on market $205,000 Active 191 DOM
-
2026-06-05days on market $205,000 Active 188 DOM
-
2026-06-03days on market $205,000 Active 187 DOM
-
2026-06-02days on market $205,000 Active 186 DOM
-
2026-06-01days on market $205,000 Active 185 DOM
-
2026-05-31days on market $205,000 Active 184 DOM
-
2026-05-30days on market $205,000 Active 183 DOM
-
2026-05-04status Under Agreement 263-char remark
Show marketing remark (263 chars)
OverviewInvestors take notice!! This is a great opportunity to revamp this outdated home to your liking. This has lots of potential, easy access to shopping, highways and much more. Schedule your viewing today. Hold harmless requires to be signed prior to showing
-
2026-04-25price $185,000 263-char remark
Show marketing remark (263 chars)
OverviewInvestors take notice!! This is a great opportunity to revamp this outdated home to your liking. This has lots of potential, easy access to shopping, highways and much more. Schedule your viewing today. Hold harmless requires to be signed prior to showing
-
2026-03-14price $195,000 263-char remark
Show marketing remark (263 chars)
OverviewInvestors take notice!! This is a great opportunity to revamp this outdated home to your liking. This has lots of potential, easy access to shopping, highways and much more. Schedule your viewing today. Hold harmless requires to be signed prior to showing
-
2026-02-12price $205,000 256-char remark
Show marketing remark (256 chars)
Investors take notice!! This is a great opportunity to revamp this outdated home to your liking. This has lots of potential, easy access to shopping, highways and much more. Schedule your viewing today. Hold harmless requires to be signed prior to showing
-
2025-11-28$205,000 New 263-char remark
Show marketing remark (256 chars)
Investors take notice!! This is a great opportunity to revamp this outdated home to your liking. This has lots of potential, easy access to shopping, highways and much more. Schedule your viewing today. Hold harmless requires to be signed prior to showing
-
2025-11-28$215,000 Active 256-char remark
Show marketing remark (256 chars)
Investors take notice!! This is a great opportunity to revamp this outdated home to your liking. This has lots of potential, easy access to shopping, highways and much more. Schedule your viewing today. Hold harmless requires to be signed prior to showing
ⓘ Source: listings_history table (triggers on properties + properties_extension) + one-shot
backfill from property_details.listing_events for pre-trigger history.
Tax reassessment forecast MA · Partial reset (capped growth)
- Current annual tax
- $3,217 · $268/mo
- Projected year-2 tax
- $3,217 · $268/mo
- Expected delta
- $0/yr ($0/mo · 0.0%)
ⓘ Screening estimate from a state-policy table — verify with the county assessor before closing.
Climate risk First Street
- Flood 1/10 Low FEMA zone X (unshaded) · 0% chance over 30 yrs
- Wildfire 3/10 Moderate
- Heat 4/10 Moderate 7 d/yr ≥96°F today · 18 d/yr by 30 yrs out
- Wind 6/10 Major 27% chance of damaging wind over 30 yrs
- Air quality 2/10 Low 1 unhealthy d/yr today · 2 by 30 yrs out
Nearby sold comps map
Loading sold comps map…
Walkable amenities ~0.75 mi
Loading nearby amenities…
Taxation est. · year 1
- Rental income
- $23,489
- − Mortgage interest
- −$11,483
- − Property taxes
- −$3,217
- − Insurance
- −$1,025
- − Repairs & maintenance
- −$1,879
- − Management
- −$1,879
- − Depreciation
- −$5,964
- Taxable loss
- −$1,958
- Est. tax savings @ 24.0%
- +$470
- After-tax cash flow
- $1,883/yr
For passive investors: Depreciation is non-cash, so a rental often shows a tax loss while cash-flowing — sheltering income. Rental losses are passive: they offset passive income freely, and up to $25,000/yr can offset ordinary (W-2) income if you actively participate and your MAGI is under $100k (phasing out to $0 by $150k); unused losses carry forward. On sale, claimed depreciation is recaptured at up to 25%, and gains may owe capital-gains tax (a 1031 exchange can defer both). Figures are a year-1 estimate at your 24.0% rate — not tax advice; consult a CPA.
Schools (NCES district)
- District
- Ludlow
- NCES district ID
- 2507050
- Math proficiency
- 30% ▼ -16.00%
- Reading proficiency
- 40% ▼ -5.00%
- Median HH income
- $62,637
- Composite
- 31.52/100
- National rank
- #5965
- State rank
- #228 of 302 in MA
Livability — Ludlow
No livability data for this city. (Only ~50 U.S. cities are tracked.)
Census & demographics
- Population (ZIP)
- 20,846
Population outlook (Hampden County) Hauer SSP2
- Today (2025)
- 485,646 people
- By 2030
- 491,517 · +1.2%
- By 2040
- 500,539 · +3.1%
- By 2050
- 508,827 · +4.8%
- By 2075
- 539,167 · +11.0%
- By 2100
- 545,698 · +12.4%
Race, ethnicity, and origin ACS 2023
- Neighborhood character
- Predominantly White (85%)
- Race & ethnicity
- White 85% Hispanic / Latino 10% Two or more races 7% Black 2%
- Hispanic origin (detail)
- Puerto Rican 7%
- Common ancestry
- Russian 23% Romanian 14% Lithuanian 12%
- Foreign-born
- 16% · Canada
- Languages at home
- 73% English-only · Other Indo-European 15% Spanish 6% Other Asian/Pacific 2%
Political lean MEDSL · Hampden
- 2024 margin
- Lean D (+8.9) · D 53.4% · R 44.5% · Other 2.1%
- 2008→2024 swing
- -16.4pp toward R · 2008: 25.3pp · 2024: 8.9pp
- All cycles
- 2024: D+8.9 2020: D+17.7 2016: D+16.0 2012: D+25.4 2008: D+25.3
Not yet ingested
- Civics
- —
Market trends
- HPI YoY
- ▼ -121.64%
- Current HPI
- 269.7061
- Rent YoY
- —
- Metro
- —
- State GDP YoY
- ▲ 2.28%
- F500 in state
- 38
Industry mix (Fortune 500 HQ in MA)
| Industry | F500 HQs | Revenue |
|---|---|---|
| Technology | 3 | $17B |
|
||
| Insurance | 2 | $84B |
|
||
| Retail | 2 | $76B |
|
||
| Life Sciences | 1 | $43B |
|
||
| Energy Technology | 1 | $31B |
|
||
| Aerospace / Defense | 1 | $18B |
|
||
Price history
-9.8% since first listed6 events — show timeline
- 2026-05-04 Pending — MLS PIN
- 2026-04-25 Price Changed $185,000 MLS PIN
- 2026-03-14 Price Changed $195,000 MLS PIN
- 2026-02-12 Price Changed $205,000 Smart MLS
- 2025-11-28 Listed $215,000 Smart MLS
- 2025-11-28 Listed $205,000 MLS PIN
Property tax history
+3.4%/yrLatest (2023): $3,217 · +4.4% YoY. Source: county tax records.
Cash-flow waterfall
monthlySold comps — $/sqft
last 12 mo · ≤1 miLoading sold comps…