 Multi-family
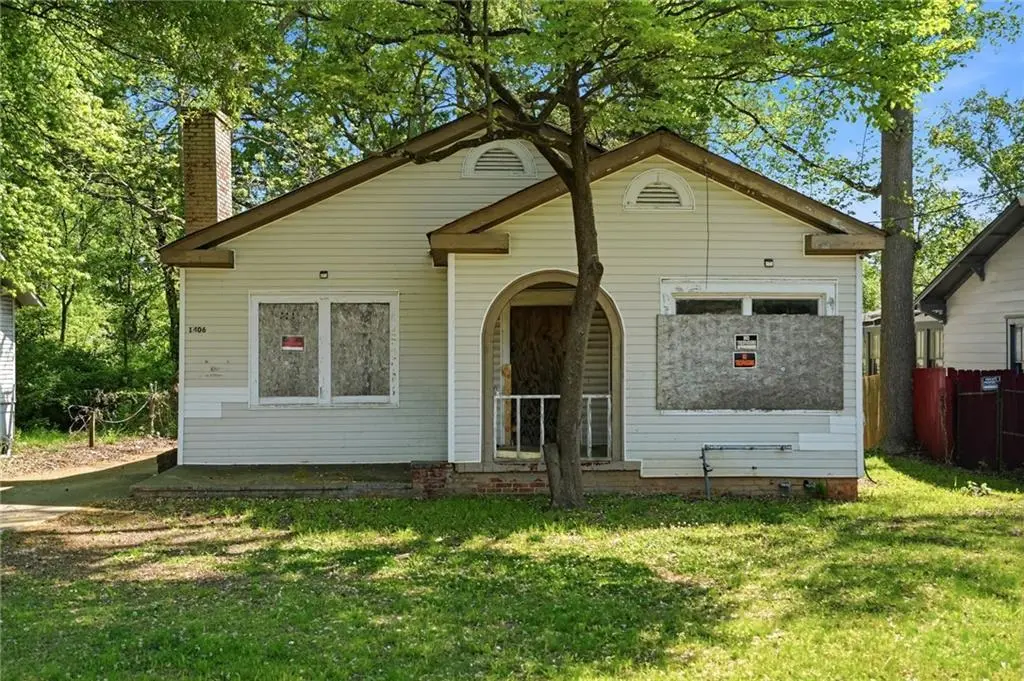
1406 Lakewood Ave SE · Atlanta, GA
Flood risk 1/10 · Minimal
- FEMA flood zone
- X (unshaded)
- Chance of flooding over 30 yrs
- 0.0%
- Est. flood insurance / yr
- $507 – $1,088
Fire risk 1/10 · Minimal
- Est. fire insurance / yr
- $963 – $1,789
Heat risk 5/10 · Moderate
- Hot days now (above 105°F)
- 7 days/yr
- Hot days in 30 yrs
- 18 days/yr
Wind risk 5/10 · Moderate
- Chance of severe wind over 30 yrs
- 26.0%
Air-quality risk 4/10 · Minor
- Unhealthy air days now
- 4 days/yr
- Unhealthy air days in 30 yrs
- 6 days/yr
Risk factors via First Street. Map © Google.
Why this score? — see what drove the B- grade
The composite is a weighted blend of 9 inputs, each scored 0–100. Each bar is that input's sub-score; the figure is the points it added to the 100-point composite (weight × sub-score).
- Cash flow +24.7/30.0
- ARV discount +15.0/15.0
- DSCR +8.0/10.0
- 1% rule +6.7/10.0
- Livability +4.2/5.0
- Rent growth +3.3/5.0
- Schools +2.7/10.0
- Condition / age +2.5/5.0
- Appreciation +0.0/10.0
$205,000
🖨 Deal sheet 📄 Offer letter ✓ Due diligence
Multi-family units
County records classify this as Multi-Family (2-4 Unit). Listing-text estimate: 1 unit. estimate disagrees with records
Listing remarks MLS
Rare opportunity to secure a property in the rapidly growing Lakewood area. Surrounded by renovated homes and new construction, this property offers excellent potential for a full renovation or redevelopment. Prime location near the Atlanta BeltLine, offering easy access to trails, dining, and entertainment, along with convenient proximity to public transit and major highways-making commuting to Downtown Atlanta quick and accessible. Enjoy being just minutes from Grant Park and the vibrant Intown lifestyle. Opportunities like this are becoming increasingly rare in such a centrally located area, this property offers strong upside potential. Property is being sold as-is. Cash only. Don't miss this opportunity-properties in this location move quickly.
Key facts
- Atlanta beltline
- Renovated homes
- Public transit
Tags
Neighborhood map
What this means for you Summary
Snapshot
- This is a 3-bed/1.0-bath multifamily listed at $205k.
Deal economics
- At list price, monthly cash flow is $429 ($5k/yr) — positive.
- The deal already cash-flows at list — no discount required.
- Meets the 1% rule at list price ($2k rent vs $205k).
- Recommended offer: $193k (6.0% below list) — sets the bar for market timing.
- Cap rate 8.8% vs local median 3.1% in Atlanta — top-decile yield for the area; either an underpriced asset or a hidden risk that comps aren't pricing in. Stress-test before assuming the spread holds.
Location & tenants
- Location reads 83/100 on livability (#6 in GA, #919 nationally) — a professional / high-income tenant draw. Strengths: amenities A+, commute A+, housing A+; Watch: schools C-, cost of living C-.
- Atlanta Public Schools (urban): math 28% / reading 35% proficiency, ranked #80 of 174 in GA (top 46%) — families likely to look elsewhere, expect single-tenant / working-renter base with shorter leases; 71% free/reduced lunch — lower-income household profile, screen leases tightly.
- Market conditions: Rents rising (+3.2%/yr); 378 active listings in the ZIP; 40 comparable units currently listed for rent nearby; rentals at typical pace (median 17d on market — plan ~3-4 weeks tenant-placement turnaround); 11,565 units permitted in Fulton County in 2024 (8,159 in 5+ unit buildings).
- At $2,389/mo this rent would consume 56% of the median local household income ($51k/yr) (locally 2962% of renters already pay >50% of income on rent) — very limited rent-growth headroom before tenants either downsize or default.
Forward outlook
- Local home prices are declining (-3.0%/yr); year-one equity from $1k of loan paydown is wiped out by about $6k of value loss. Plan a longer hold.
- Fulton County population projected at +38% by 2050 — long-run rental-demand tailwind backs the buy-and-hold thesis.
Negotiation context
- It's been on market 67 days — a 6% lower offer ($193k) is reasonable based on typical stale-listing flexibility.
- 17 sale attempts since 19y ago with the ask held roughly flat each time — persistent listings suggest the price (not the market) is what's stuck; bring a comps-based counter.
- Current owner paid $11k; list at $205k implies a 1764% gain — meaningful room to come down on a strong offer.
Risks & watch-outs
- Watch-outs: built in 1920 — expect roof / HVAC / electrical / plumbing capex.
- Climate carrying-cost: moderate wind risk, 26% chance of damaging wind over 30y; extreme-heat days projected 7→18/yr by 2055 (HVAC capex compounding) — expect insurance premiums to compound above CPI over the hold.
Questions for the listing agent
- It's been on market 67 days. Have you received any prior offers? Is the seller open to a 6% concession, seller financing, or rate buy-down credit?
- Built in 1920 — when were the roof, HVAC, electrical panel, plumbing, and water heater last replaced?
- Why hasn't it sold? Are there any deal-killer items the seller is aware of (foundation, flood, title, zoning, code violations)?
- Is there a deadline driving the sale (1031 exchange, divorce, estate, relocation)? That informs how much negotiation room exists.
- What's the average days-on-market for RENTAL listings here right now (not sales)? A rising rental-DOM trend means longer vacancies and softer asking-rent achievability than the comps imply.
- What's the recent tenant-quality profile in this submarket — average credit score on applications, eviction rate, late-payment / NSF rate, and stable-employment percentage? A property-management company in the area should have these aggregated.
- How much new apartment / multifamily construction is in the pipeline within 1–3 miles? Heavy new supply (>2% of stock underway) typically softens rents 12–24 months out; light construction supports rent growth.
Investment metrics
- 1% rule
- 1.17% ✓
- Cap rate
- 8.80%
- Cash-on-cash
- 8.96%
- DSCR
- 1.40
- GRM
- 7.1
CMA / ARV
- ARV (median comp)
- $358,010
- List price
- $205,000
- Delta
- -42.74%
- Verdict
- UNDERPRICED
- Comps
- 20 within 1.0 mi
Projected returns pro-forma
-3.0% appreciation · 3.23% rent growth · sell at horizon
- IRR
- -2.4%
- Equity multiple
- 0.91×
- Total profit
- $-5,297
- Equity at exit
- $30,566
- IRR
- 7.5%
- Equity multiple
- 1.58×
- Total profit
- $33,085
- Equity at exit
- $17,725
Cash invested: $57,400 (down + closing). Projections, not guarantees.
Landlord ↔ Tenant lean methodology
- Overall (STATE)
- 90 Strongly Landlord-Friendly
- State Georgia
- 90 Strongly Landlord-Friendly · R+3
- County
- — inherits STATE
- City
- — inherits STATE
ZIP-level market 30315
- Rents YoY
- 3.2%
- Active inventory
- 378
- Price-to-rent
- 7.1×
Monthly cashflow live
- Estimated rent
- $2,389 high interval (Pro) →
- Mortgage (P&I)
- −$1,075
- Tax from tax record
- −$298 /mo · $3,582/yr
- Insurance
- −$85
- HOA
- −$0
- Vacancy / Maint / Mgmt
- −$502
- Net cashflow
- $429
Break-even live
UW: 25.0% down · 7.5% · 30yr · 1.5% tax · 5.0% vac · 8.0% maint · 8.0% mgmt
Financing live
Cash to close
- Down payment
- $51,250
- Closing costs
- $6,150
- Reserves months
- —
- Total cash needed
- —
Loan-product check · same deal, 3 products live
Conventional
25% down · 7.5% · 30yr
- Down + closing
- —
- Monthly P&I
- —
- Monthly cashflow
- —
- DSCR
- —
- Eligible?
- —
Personal DTI + credit; lowest rate.
DSCR
20% down · 8.5% · 30yr
- Down + closing
- —
- Monthly P&I
- —
- Monthly cashflow
- —
- DSCR
- —
- Eligible?
- —
No personal income docs; deal must DSCR.
Hard money
10% down · 12.0% · 12mo
- Down + closing
- —
- Monthly P&I
- —
- Monthly cashflow
- —
- DSCR
- —
- Eligible?
- —
Short-term bridge; refi at stabilization.
Rent comps 40 comps
| Address | Beds | Baths | Sqft | Rent | $/sqft | DOM | Units | Dist |
|---|---|---|---|---|---|---|---|---|
| 104 Mission Way SE Atlanta, GA | 3.0 | 3.5 | 1550 | $2,800 | $1.81 | 4d | 1 | 0.17mi |
| 117 Thayer Ave SE Atlanta, GA | 3.0 | 1.0 | 1241 | $1,666 | $1.34 | 14d | 1 | 0.19mi |
| 141 McDonough Blvd SE Atlanta, GA | 3.0 | 2.0 | 1242 | $2,250 | $1.81 | 24d | 1 | 0.22mi |
| 1515 Jonesboro Rd SE Atlanta, GA | 3.0 | 2.0 | 1360 | $2,300 | $1.69 | 13d | 1 | 0.23mi |
| 117 Brown Ave SE Atlanta, GA | 4.0 | 2.5 | 1632 | $1,945 | $1.19 | 14d | 1 | 0.25mi |
| 95 Thirkield Ave SE Atlanta, GA | 3.0 | 2.0 | 1096 | $1,850 | $1.69 | 16d | 1 | 0.26mi |
| 91 Thirkield Ave SE Atlanta, GA | 2.0 | 1.0 | 1092 | $1,995 | $1.83 | 24d | 1 | 0.27mi |
| 402 McDonough Blvd SE Atlanta, GA | 3.0 | 3.5 | 1270 | $2,350 | $1.85 | 24d | 1 | 0.36mi |
| 64 Moury Ave SE Atlanta, GA | 4.0 | 3.5 | 1877 | $2,699 | $1.44 | 24d | 1 | 0.37mi |
| 41 Meldon Ave SE Atlanta, GA | 4.0 | 1.5 | 1323 | $1,495 | $1.13 | 17d | 1 | 0.38mi |
| 1569 Jonesboro Rd SE Atlanta, GA | 4.0 | 2.0 | 1680 | $2,400 | $1.43 | 19d | 1 | 0.41mi |
| 1569 Jonesboro Rd SE Atlanta, GA | 4.0 | 2.0 | 1680 | $2,400 | $1.43 | 17d | 1 | 0.41mi |
| 309 Skylar Ter SE Atlanta, GA | 2.0 | 4.0 | 1573 | $2,600 | $1.65 | 8d | 1 | 0.44mi |
| 125 Milton Ave SE Atlanta, GA | 2.0 | 1.0–2.0 | 965 | $2,494 | $2.58 | 2d | 29 | 0.45mi |
| 1205 Skylar Ln SE Atlanta, GA | 3.0 | 3.5 | 1898 | $2,850 | $1.50 | 5d | 1 | 0.48mi |
| 1205 Skylar Ln SE Atlanta, GA | 3.0 | 3.5 | 1898 | $2,900 | $1.53 | 5d | 1 | 0.48mi |
| 347 Skylar Ct SE Atlanta, GA | 3.0 | 5.0 | 1898 | $3,470 | $1.83 | 24d | 1 | 0.48mi |
| 357 Skylar Way SE Atlanta, GA | 3.0 | 5.0 | 1898 | $2,800 | $1.48 | 22d | 1 | 0.50mi |
| 174 Moury Ave SW Atlanta, GA | 1.0–3.0 | 1.0–2.0 | 926 | $1,728 | $1.87 | 3d | 6 | 0.57mi |
| 1114 Oak Knoll Ter SE Atlanta, GA | 4.0 | 2.0 | 1525 | $2,800 | $1.84 | 24d | 1 | 0.60mi |
| 430 Englewood Ave SE Atlanta, GA | 3.0 | 1.0–2.0 | 938 | $3,605 | $3.84 | 1d | 28 | 0.62mi |
| 1081 Hill St SE Unit B Atlanta, GA | 3.0 | 2.5 | 1678 | $2,995 | $1.78 | 24d | 1 | 0.62mi |
| 72 Milton Ave SE Atlanta, GA | 2.0 | 1.0–2.0 | 818 | $2,107 | $2.57 | 1d | 24 | 0.65mi |
| 45 Boynton Ave SE Atlanta, GA | 2.0–4.0 | 2.5–4.0 | 1452 | $2,918 | $2.01 | 1d | 15 | 0.66mi |
| 1267 Zucchini Cir SE Atlanta, GA | 3.0 | 3.0 | 1500 | $3,800 | $2.53 | 24d | 1 | 0.67mi |
| 1267 Zucchini Cir SE Atlanta, GA | 3.0 | 3.0 | 1500 | $3,300 | $2.20 | 8d | 1 | 0.67mi |
| 1394 Cozy Cir SE Atlanta, GA | 3.0 | 3.0 | 1500 | $2,850 | $1.90 | 14d | 1 | 0.68mi |
| 1754 Richmond Cir SE Atlanta, GA | 2.0 | 2.0 | 1200 | $1,750 | $1.46 | 8d | 2 | 0.69mi |
| 9 Gould St SE Atlanta, GA | 3.0 | 2.0 | 1800 | $2,000 | $1.11 | 24d | 1 | 0.69mi |
| 255 Farrington Ave SE Atlanta, GA | 4.0 | 3.0 | 1539 | $1,795 | $1.17 | 24d | 1 | 0.71mi |
| 1054 Atlanta, GA | 3.0–4.0 | 2.0 | 1295 | $1,974 | $1.52 | 21d | 2 | 0.72mi |
| 1418 Boulevard SE Atlanta, GA | 4.0 | 2.0 | 1600 | $975 | $0.61 | 4d | 1 | 0.73mi |
| 400 Pratt Dr SE #1401 Atlanta, GA | 2.0 | 2.0 | 1718 | $2,500 | $1.46 | 24d | 1 | 0.74mi |
| 1000 Hill St SE Unit A Atlanta, GA | 2.0 | 1.0 | 1500 | $2,323 | $1.55 | 8d | 1 | 0.79mi |
| 1770 Richmond Cir SE Unit 1000E Atlanta, GA | 2.0 | 2.0 | 1200 | $1,365 | $1.14 | 24d | 1 | 0.79mi |
| 1770 Richmond Cir SE Unit 500F Atlanta, GA | 2.0 | 2.0 | 1200 | $1,750 | $1.46 | 24d | 1 | 0.79mi |
| 979 Hill St SE Atlanta, GA | 3.0 | 2.0 | 1380 | $3,000 | $2.17 | 22d | 1 | 0.82mi |
| 992 Fern Ave SE Atlanta, GA | 3.0 | 3.0 | 2000 | $5,000 | $2.50 | 24d | 1 | 0.82mi |
| 1005 Linam Ave SE Atlanta, GA | 4.0 | 3.0 | 1757 | $3,000 | $1.71 | 24d | 1 | 0.82mi |
| 1845 Lakewood Ter SE Atlanta, GA | 3.0 | 2.0 | 1859 | $1,850 | $1.00 | 13d | 1 | 0.84mi |
Listing history 50 events
-
2026-06-18days on market $205,000 Active 67 DOM
-
2026-06-17days on market $205,000 Active 66 DOM
-
2026-06-16days on market $205,000 Active 65 DOM
-
2026-06-15days on market $205,000 Active 64 DOM
-
2026-06-13days on market $205,000 Active 62 DOM
-
2026-06-13days on market $205,000 Active 61 DOM
-
2026-06-09days on market $205,000 Active 58 DOM
-
2026-06-08days on market $205,000 Active 57 DOM
-
2026-06-07days on market $205,000 Active 56 DOM
-
2026-06-04days on market $205,000 Active 53 DOM
-
2026-06-03days on market $205,000 Active 52 DOM
-
2026-06-02days on market $205,000 Active 51 DOM
-
2026-06-01days on market $205,000 Active 50 DOM
-
2026-05-31days on market $205,000 Active 49 DOM
-
2026-04-12$205,000 New 761-char remark
Show marketing remark (779 chars)
Rare opportunity to secure a property in the rapidly growing Lakewood area. Surrounded by renovated homes and new construction, this property offers excellent potential for a full renovation or redevelopment. Prime location near the Atlanta BeltLine, offering easy access to trails, dining, and entertainment, along with convenient proximity to public transit and major highways—making commuting to Downtown Atlanta quick and accessible. Enjoy being just minutes from Grant Park and the vibrant Intown lifestyle. Opportunities like this are becoming increasingly rare in such a centrally located area, this property offers strong upside potential. Property is being sold as-is. Cash only. Don’t miss this opportunity—properties in this location move quickly.
-
2026-04-12$205,000 Active 779-char remark
Show marketing remark (779 chars)
Rare opportunity to secure a property in the rapidly growing Lakewood area. Surrounded by renovated homes and new construction, this property offers excellent potential for a full renovation or redevelopment. Prime location near the Atlanta BeltLine, offering easy access to trails, dining, and entertainment, along with convenient proximity to public transit and major highways—making commuting to Downtown Atlanta quick and accessible. Enjoy being just minutes from Grant Park and the vibrant Intown lifestyle. Opportunities like this are becoming increasingly rare in such a centrally located area, this property offers strong upside potential. Property is being sold as-is. Cash only. Don’t miss this opportunity—properties in this location move quickly.
-
2025-12-01historical
-
2025-12-01historical
-
2025-11-05status Back On Market
-
2025-10-31status Active
-
2025-10-06historical On Hold
-
2025-09-30status Active
-
2025-09-28status Back On Market
-
2025-08-29historical On Hold
-
2025-08-22status Back On Market
-
2025-06-10status Pending
-
2025-06-04status Under Contract
-
2025-06-03historical Active Under Contract
-
2025-06-03historical On Hold
-
2025-05-21$145,000 New
-
2025-05-21$145,000 Active
-
2013-11-08price $11,000
-
2012-12-14price $11,000
-
2012-12-13historical
-
2012-12-06soldstatus $11,000 Sold
-
2012-12-04soldstatus $11,000 Sold
-
2012-12-04price $15,900
-
2012-11-05historical
-
2012-11-05status Pending
-
2012-11-05price $15,900
-
2012-09-26status Back On Market
-
2012-09-25status Active
-
2012-08-16status Pending
-
2012-08-16historical
-
2012-07-17price $15,900
-
2012-07-17price $15,900
-
2012-06-22$19,900 New
-
2012-06-22$19,900 Active
-
2012-06-01historical
-
2012-04-20status Back On Market
ⓘ Source: listings_history table (triggers on properties + properties_extension) + one-shot
backfill from property_details.listing_events for pre-trigger history.
Tax reassessment forecast GA · Resets to sale price
- Current annual tax
- $3,582 · $298/mo
- Projected year-2 tax
- $3,582 · $298/mo
- Expected delta
- $0/yr ($0/mo · -0.0%)
ⓘ Screening estimate from a state-policy table — verify with the county assessor before closing.
Climate risk First Street
- Flood 1/10 Low FEMA zone X (unshaded) · 0% chance over 30 yrs
- Wildfire 1/10 Low
- Heat 5/10 Major 7 d/yr ≥105°F today · 18 d/yr by 30 yrs out
- Wind 5/10 Major 26% chance of damaging wind over 30 yrs
- Air quality 4/10 Moderate 4 unhealthy d/yr today · 6 by 30 yrs out
Nearby sold comps map
Loading sold comps map…
Walkable amenities ~0.75 mi
Loading nearby amenities…
Taxation est. · year 1
- Rental income
- $28,674
- − Mortgage interest
- −$11,483
- − Property taxes
- −$3,582
- − Insurance
- −$1,025
- − Repairs & maintenance
- −$2,294
- − Management
- −$2,294
- − Depreciation
- −$5,964
- Taxable income
- $2,032
- Est. tax owed @ 24.0%
- −$488
- After-tax cash flow
- $4,657/yr
For passive investors: Depreciation is non-cash, so a rental often shows a tax loss while cash-flowing — sheltering income. Rental losses are passive: they offset passive income freely, and up to $25,000/yr can offset ordinary (W-2) income if you actively participate and your MAGI is under $100k (phasing out to $0 by $150k); unused losses carry forward. On sale, claimed depreciation is recaptured at up to 25%, and gains may owe capital-gains tax (a 1031 exchange can defer both). Figures are a year-1 estimate at your 24.0% rate — not tax advice; consult a CPA.
Schools (NCES district)
- District
- Atlanta Public Schools
- NCES district ID
- 1300120
- Math proficiency
- 28% ▼ -6.00%
- Reading proficiency
- 35% ▼ -2.00%
- Median HH income
- $48,306
- Composite
- 27.27/100
- National rank
- #7006
- State rank
- #80 of 174 in GA
Livability — Atlanta
- Score
- 83/100
- State rank
- #6
- US rank
- #919
Category grades
Schools grade is shown separately in the Schools card above.
Census & demographics
- Census place
- Atlanta, GA
- County
- Fulton County · 1,094,430 people
- City population
- 629,525
- Metro
- Atlanta-Sandy Springs-Alpharetta, GA
- Population (ZIP)
- 34,264
- Household income
- $50,822
- Rent vs Own
- Severe rent burden
- 2962.0
Population outlook (Fulton County) Hauer SSP2
- Today (2025)
- 1,203,707 people
- By 2030
- 1,299,706 · +8.0%
- By 2040
- 1,488,256 · +23.6%
- By 2050
- 1,664,580 · +38.3%
- By 2075
- 2,036,072 · +69.2%
- By 2100
- 2,222,402 · +84.6%
Race, ethnicity, and origin ACS 2023
- Neighborhood character
- Predominantly Black (72%)
- Race & ethnicity
- Black 72% White 14% Hispanic / Latino 10% Two or more races 4%
- Hispanic origin (detail)
- Mexican 4%
- Common ancestry
- Romanian 1% Italian 1% Lithuanian 1%
- Foreign-born
- 5% · Canada
- Languages at home
- 90% English-only · Spanish 9% French/Haitian/Cajun 1%
Political lean MEDSL · Fulton
- 2024 margin
- Solid D (+44.9) · D 71.9% · R 27.0% · Other 1.1%
- 2008→2024 swing
- +9.8pp toward D · 2008: 35.0pp · 2024: 44.9pp
- All cycles
- 2024: D+44.9 2020: D+46.4 2016: D+42.1 2012: D+29.6 2008: D+35.0
Not yet ingested
- Civics
- —
Market trends
- HPI YoY
- ▼ -281.87%
- Current HPI
- 176.673
- Rent YoY
- ▲ 3.23%
- Metro
- Atlanta-Sandy Springs-Alpharetta, GA
- State GDP YoY
- ▲ 2.66%
- F500 in state
- 28
Industry mix (Fortune 500 HQ in GA)
| Industry | F500 HQs | Revenue |
|---|---|---|
| Paper / Packaging | 2 | $29B |
|
||
| Retail | 1 | $160B |
|
||
| Transportation / Logistics | 1 | $91B |
|
||
| Airlines | 1 | $62B |
|
||
| Consumer Goods | 1 | $47B |
|
||
| Utilities | 1 | $25B |
|
||
Price history
+583.3% since first listed46 events — show timeline
- 2026-04-12 Listed $205,000 FMLS
- 2026-04-12 Listed $205,000 GAMLS
- 2025-12-01 Listing Removed — FMLS
- 2025-12-01 Listing Removed — GAMLS
- 2025-11-05 Relisted — GAMLS
- 2025-10-31 Relisted — FMLS
- 2025-10-06 Delisted — GAMLS
- 2025-09-30 Relisted — FMLS
- 2025-09-28 Relisted — GAMLS
- 2025-08-29 Delisted — GAMLS
- 2025-08-22 Relisted — GAMLS
- 2025-06-10 Pending — FMLS
- 2025-06-04 Pending — GAMLS
- 2025-06-03 Contingent — FMLS
- 2025-06-03 Delisted — GAMLS
- 2025-05-21 Listed $145,000 FMLS
- 2025-05-21 Listed $145,000 GAMLS
- 2013-11-08 Price Changed $11,000 GAMLS
- 2012-12-14 Price Changed $11,000 FMLS
- 2012-12-13 Listing Removed — FMLS
- 2012-12-06 Sold (MLS) $11,000 GAMLS
- 2012-12-04 Price Changed $15,900 FMLS
- 2012-12-04 Sold (MLS) $11,000 FMLS
- 2012-11-05 Listing Removed — GAMLS
- 2012-11-05 Pending — FMLS
- 2012-11-05 Price Changed $15,900 GAMLS
- 2012-09-26 Relisted — GAMLS
- 2012-09-25 Relisted — FMLS
- 2012-08-16 Pending — FMLS
- 2012-08-16 Listing Removed — GAMLS
- 2012-07-17 Price Changed $15,900 FMLS
- 2012-07-17 Price Changed $15,900 GAMLS
- 2012-06-22 Listed $19,900 GAMLS
- 2012-06-22 Listed $19,900 FMLS
- 2012-06-01 Listing Removed — GAMLS
- 2012-04-20 Relisted — GAMLS
- 2012-04-01 Listing Removed — GAMLS
- 2012-03-06 Relisted — GAMLS
- 2012-02-02 Listing Removed — GAMLS
- 2011-12-29 Listed $65,000 GAMLS
- 2007-05-03 Sold (Public Records) $79,900 Public Records
- 2007-04-20 Sold (MLS) $79,900 FMLS
- 2007-02-21 Listed $79,900 FMLS
- 2000-12-07 Sold (Public Records) $55,000 Public Records
- 1985-11-26 Sold (Public Records) $17,500 Public Records
- 1983-09-12 Sold (Public Records) $30,000 Public Records
Property tax history
+5.0%/yrLatest (2025): $3,582 · -13.7% YoY. Source: county tax records.
Cash-flow waterfall
monthlySold comps — $/sqft
last 12 mo · ≤1 miLoading sold comps…