959 Fentress Lookout Rd · Falls Of Rough, KY
Flood risk 1/10 · Minimal
- FEMA flood zone
- X (unshaded)
- Chance of flooding over 30 yrs
- 0.0%
- Est. flood insurance / yr
- $507 – $1,088
Fire risk 3/10 · Minor
- Est. fire insurance / yr
- $839 – $1,559
Heat risk 4/10 · Minor
- Hot days now (above 107°F)
- 7 days/yr
- Hot days in 30 yrs
- 19 days/yr
Wind risk 3/10 · Minor
- Chance of severe wind over 30 yrs
- 6.0%
Air-quality risk 2/10 · Minimal
- Unhealthy air days now
- 0 days/yr
- Unhealthy air days in 30 yrs
- 1 days/yr
Risk factors via First Street. Map © Google.
Why this score? — see what drove the D grade
The composite is a weighted blend of 9 inputs, each scored 0–100. Each bar is that input's sub-score; the figure is the points it added to the 100-point composite (weight × sub-score).
- Cash flow +13.2/30.0
- ARV discount +7.5/15.0
- Appreciation +4.5/10.0
- DSCR +4.0/10.0
- 1% rule +3.7/10.0
- Schools +2.8/10.0
- Rent growth +2.5/5.0
- Livability +2.5/5.0
- Condition / age +2.5/5.0
$119,500
🖨 Deal sheet (PDF) 📄 Offer letter ✓ Due diligence
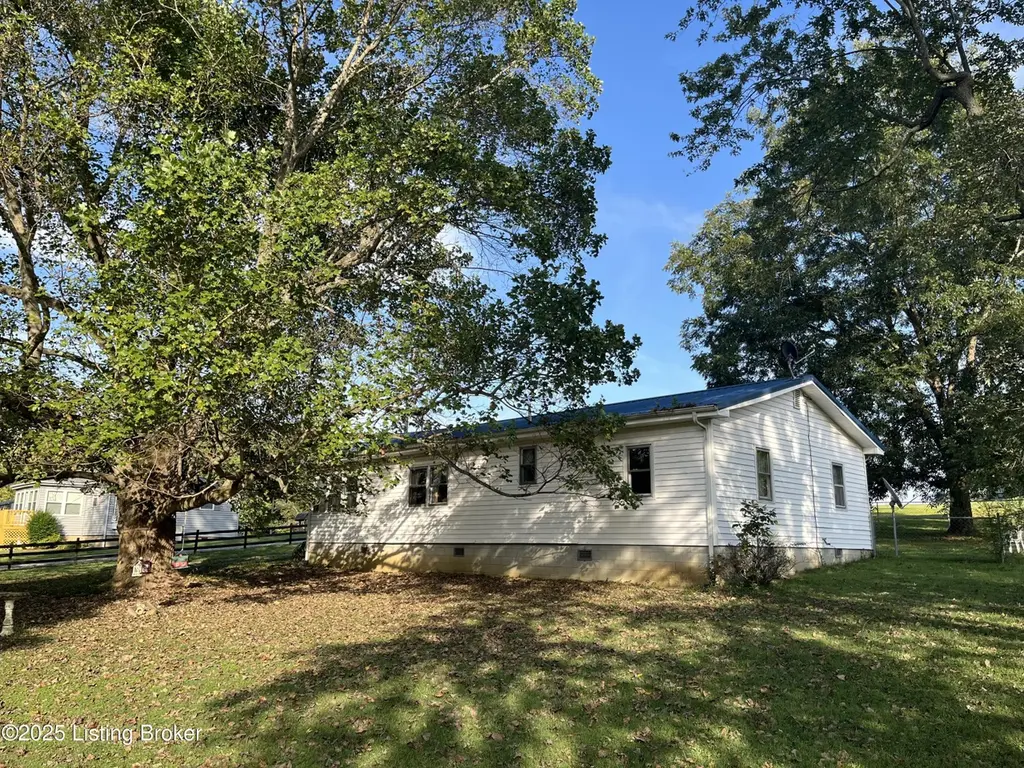
Listing remarks
This property has three nice lots with partial chain link fencing. It has a two car detached garage. It has county water and septic system. A portion of the back section of the dwelling is a mobile home with the main structure being frame construction.
Key facts
- 0.52 acre lot
- 2 garage spots
- Listed 18 days
Neighborhood map
What this means for you Summary
Snapshot
- This is a 3-bed/2.0-bath other listed at $120k.
Deal economics
- At list price, monthly cash flow is $-1 ($-17/yr) — negative.
- To cash-flow at today's rent, offer at most $119k (0.2% below list).
- To meet the 1% rule (rent ≥ 1% of price), the offer needs to be $104k (12.7% below list).
- Recommended offer: $104k (12.7% below list) — sets the bar for 1% rule.
Location & tenants
- Location reads: area grade D — affects rentability + tenant quality, not the cash-flow math above.
- Grayson County (rural): math 27% / reading 40% proficiency, ranked #84 of 165 in KY (top 51%) — families likely to look elsewhere, expect single-tenant / working-renter base with shorter leases.
- Zoned schools: Caneyville Elementary School (math 27% / reading 37%, grade F, #348 of 676 statewide, top 55%, 390 students, 71% FRL); Grayson County Middle School (math 23% / reading 38%, grade F, #143 of 217 statewide, top 67%, 839 students, 63% FRL); Grayson County High School (math 24% / reading 38%, grade F, #118 of 254 statewide, top 47%, 1,252 students, 61% FRL).
- Market conditions: 88 active listings in the ZIP; 23 units permitted in Grayson County in 2024 (12 in 5+ unit buildings).
Forward outlook
- Local home prices are declining (-0.9%/yr); year-one equity from $826 of loan paydown is wiped out by about $1k of value loss. Plan a longer hold.
Negotiation context
- It's been on market 18 days — a 2% lower offer ($118k) is reasonable based on typical stale-listing flexibility.
- 2 sale attempts with the ask held roughly flat each time — persistent listings suggest the price (not the market) is what's stuck; bring a comps-based counter.
- Current owner paid $40k; list at $120k implies a 199% gain — meaningful room to come down on a strong offer.
Questions for the listing agent
- What do current leases actually rent for vs. the listed asking? Can we see a recent rent roll and the last 12 months of T-12 income?
- Is there a deadline driving the sale (1031 exchange, divorce, estate, relocation)? That informs how much negotiation room exists.
- The area grade is low — what's the realistic commute time and amenity access for the typical tenant pool here? Any planned neighborhood developments (good or bad) we should know about?
- What's the average days-on-market for RENTAL listings here right now (not sales)? A rising rental-DOM trend means longer vacancies and softer asking-rent achievability than the comps imply.
- What's the recent tenant-quality profile in this submarket — average credit score on applications, eviction rate, late-payment / NSF rate, and stable-employment percentage? A property-management company in the area should have these aggregated.
- How much new for-sale + rental construction is in the pipeline within 1–3 miles? Heavy new supply typically softens prices + rents 12–24 months out; constrained supply supports both.
Investment metrics
- 1% rule
- 0.87% ✗
- Cap rate
- 6.28%
- Cash-on-cash
- -0.05%
- DSCR
- 1.00
- GRM
- 9.5
CMA / ARV
No comps found within radius.
Projected returns pro-forma
-0.91% appreciation · 3.0% rent growth · sell at horizon
- IRR
- -5.9%
- Equity multiple
- 0.74×
- Total profit
- $-8,608
- Equity at exit
- $29,342
- IRR
- 0.8%
- Equity multiple
- 1.08×
- Total profit
- $2,665
- Equity at exit
- $31,236
Cash invested: $33,460 (down + closing). Projections, not guarantees.
Landlord ↔ Tenant lean methodology
- Overall (STATE)
- 83 Strongly Landlord-Friendly
- State Kentucky
- 83 Strongly Landlord-Friendly · R+16
- County
- — inherits STATE
- City
- — inherits STATE
ZIP-level market 40119
- Home prices YoY
- -0.2%
- Active inventory
- 88
- Price-to-rent
- 9.5×
Monthly cashflow live
- Estimated rent
- $1,044 medium interval (Pro) →
- Mortgage (P&I)
- −$627
- Tax est. 1.5%
- −$149 /mo · $1,792/yr
- Insurance
- −$50
- HOA
- −$0
- Vacancy / Maint / Mgmt
- −$219
- Net cashflow
- $-1
Break-even live
Sensitivity live
| Price | -10% $81 | -5% $40 | +0% $-1 | +5% $-43 | +10% $-84 |
|---|---|---|---|---|---|
| Rent | -10% $-84 | -5% $-43 | +0% $-1 | +5% $40 | +10% $81 |
| Rate | -1.0pp $59 | -0.5pp $29 | base $-1 | +0.5pp $-32 | +1.0pp $-64 |
UW: 25.0% down · 7.5% · 30yr · 1.5% tax · 5.0% vac · 8.0% maint · 8.0% mgmt
Financing live
Cash to close
- Down payment
- $29,875
- Closing costs
- $3,585
- Reserves months
- —
- Total cash needed
- —
Loan-product check · same deal, 3 products live
Conventional
25% down · 7.5% · 30yr
- Down + closing
- —
- Monthly P&I
- —
- Monthly cashflow
- —
- DSCR
- —
- Eligible?
- —
Personal DTI + credit; lowest rate.
DSCR
20% down · 8.5% · 30yr
- Down + closing
- —
- Monthly P&I
- —
- Monthly cashflow
- —
- DSCR
- —
- Eligible?
- —
No personal income docs; deal must DSCR.
Hard money
10% down · 12.0% · 12mo
- Down + closing
- —
- Monthly P&I
- —
- Monthly cashflow
- —
- DSCR
- —
- Eligible?
- —
Short-term bridge; refi at stabilization.
Listing history 6 events
-
2026-04-20status Pending
-
2026-04-02$119,500 Active
-
2026-03-17historical
-
2025-10-14price $134,500
-
2025-09-17$149,500 Active
-
2013-03-01soldstatus $40,000
ⓘ Source: listings_history table (triggers on properties + properties_extension) + one-shot
backfill from property_details.listing_events for pre-trigger history.
Climate risk First Street
- Flood 1/10 Low FEMA zone X (unshaded) · 0% chance over 30 yrs
- Wildfire 3/10 Moderate
- Heat 4/10 Moderate 7 d/yr ≥107°F today · 19 d/yr by 30 yrs out
- Wind 3/10 Moderate 6% chance of damaging wind over 30 yrs
- Air quality 2/10 Low 0 unhealthy d/yr today · 1 by 30 yrs out
Nearby sold comps map
Loading sold comps map…
Walkable amenities ~0.75 mi
Loading nearby amenities…
Taxation est. · year 1
- Rental income
- $12,522
- − Mortgage interest
- −$6,694
- − Property taxes
- −$1,792
- − Insurance
- −$598
- − Repairs & maintenance
- −$1,002
- − Management
- −$1,002
- − Depreciation
- −$3,476
- Taxable loss
- −$2,042
- Est. tax savings @ 24.0%
- +$490
- After-tax cash flow
- $472/yr
For passive investors: Depreciation is non-cash, so a rental often shows a tax loss while cash-flowing — sheltering income. Rental losses are passive: they offset passive income freely, and up to $25,000/yr can offset ordinary (W-2) income if you actively participate and your MAGI is under $100k (phasing out to $0 by $150k); unused losses carry forward. On sale, claimed depreciation is recaptured at up to 25%, and gains may owe capital-gains tax (a 1031 exchange can defer both). Figures are a year-1 estimate at your 24.0% rate — not tax advice; consult a CPA.
Schools (NCES district)
- District
- Grayson County
- NCES district ID
- 2102300
- Math proficiency
- 27% ▼ -23.00%
- Reading proficiency
- 40% ▼ -17.00%
- Median HH income
- $34,256
- Composite
- 27.55/100
- National rank
- #6944
- State rank
- #84 of 165 in KY
Livability — Falls Of Rough
No livability data for this city. (Only ~50 U.S. cities are tracked.)
Census & demographics
- Population (ZIP)
- 2,071
Population outlook (Grayson County) Hauer SSP2
- Today (2025)
- 26,840 people
- By 2030
- 27,032 · +0.7%
- By 2040
- 27,236 · +1.5%
- By 2050
- 27,076 · +0.9%
- By 2075
- 26,565 · -1.0%
- By 2100
- 24,007 · -10.6%
Race, ethnicity, and origin ACS 2023
- Neighborhood character
- Predominantly White (96%)
- Race & ethnicity
- White 96% Two or more races 2% Hispanic / Latino 2%
- Common ancestry
- Romanian 5% Slovak 3% Serbian 2%
- Languages at home
- 98% English-only · Spanish 2%
Political lean MEDSL · Grayson
- 2024 margin
- Solid R (+61.8) · D 18.5% · R 80.3% · Other 1.2%
- 2008→2024 swing
- -26.9pp toward R · 2008: -34.9pp · 2024: -61.8pp
- All cycles
- 2024: R+61.8 2020: R+58.8 2016: R+59.3 2012: R+39.5 2008: R+34.9
Not yet ingested
- Civics
- —
Market trends
- HPI YoY
- ▼ -0.91%
- Current HPI
- 363.2314
- Rent YoY
- —
- Metro
- —
- State GDP YoY
- ▲ 1.81%
- F500 in state
- 4
Industry mix (Fortune 500 HQ in KY)
| Industry | F500 HQs | Revenue |
|---|---|---|
| Healthcare | 1 | $118B |
|
||
| Food / Beverage | 1 | $7B |
|
||
Price history
+198.8% since first listed6 events — show timeline
- 2026-04-20 Pending — Metro Search MLS
- 2026-04-02 Listed $119,500 Metro Search MLS
- 2026-03-17 Listing Removed — Metro Search MLS
- 2025-10-14 Price Changed $134,500 Metro Search MLS
- 2025-09-17 Listed $149,500 Metro Search MLS
- 2013-03-01 Sold (Public Records) $40,000 Public Records
Cash-flow waterfall
monthlySold comps — $/sqft
last 12 mo · ≤1 miLoading sold comps…