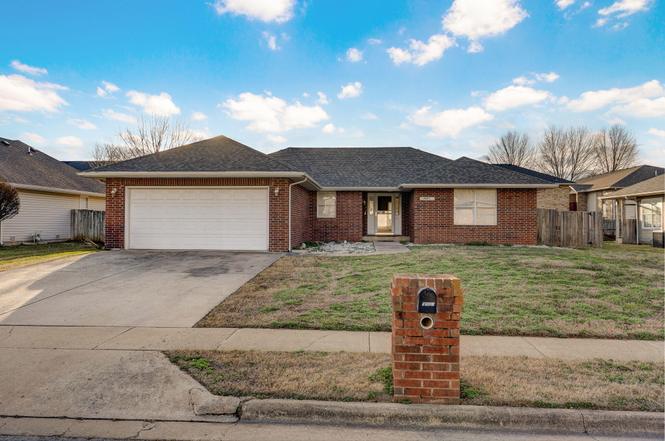
5567 S Jefferson Ave · Springfield, MO
Flood risk 1/10 · Minimal
- FEMA flood zone
- X (unshaded)
- Chance of flooding over 30 yrs
- 0.0%
- Est. flood insurance / yr
- $507 – $1,088
Fire risk 3/10 · Minor
- Est. fire insurance / yr
- $1,054 – $1,958
Heat risk 5/10 · Moderate
- Hot days now (above 105°F)
- 7 days/yr
- Hot days in 30 yrs
- 19 days/yr
Wind risk 2/10 · Minimal
- Chance of severe wind over 30 yrs
- —
Air-quality risk 1/10 · Minimal
- Unhealthy air days now
- 0 days/yr
- Unhealthy air days in 30 yrs
- 0 days/yr
Risk factors via First Street. Map © Google.
Why this score? — see what drove the C- grade
The composite is a weighted blend of 9 inputs, each scored 0–100. Each bar is that input's sub-score; the figure is the points it added to the 100-point composite (weight × sub-score).
- Cash flow +20.1/30.0
- ARV discount +11.1/15.0
- DSCR +6.4/10.0
- 1% rule +4.4/10.0
- Livability +3.8/5.0
- Schools +3.2/10.0
- Rent growth +3.1/5.0
- Condition / age +2.5/5.0
- Appreciation +0.0/10.0
$249,000
🖨 Deal sheet 📄 Offer letter ✓ Due diligence
Listing remarks
Fantastic South Springfield location just minutes from Cherokee Middle School, Sam's Club, Walmart, and quick access to James River Freeway for easy commuting across town. This well-maintained 1 owner brick front 3 bedroom, 3 bath home offers with some accessible feature and both comfort and functionality with several recent updates including a new roof in 2025, new hot water heater in 2024, and newer flooring throughout. The backyard is a standout feature with a nice covered deck perfect for relaxing or entertaining. You'll also find two large storage buildings providing excellent flexibility. The 14x24 building is insulated and equipped with electricity, plumbing, ethernet, and cable, mak
Key facts
- Covered deck
- Insulated building
- Home office
Tags
Neighborhood map
What this means for you Summary
Snapshot
- This is a 3-bed/3.0-bath single-family listed at $249k.
Deal economics
- At list price, monthly cash flow is $309 ($4k/yr) — positive.
- The deal already cash-flows at list — no discount required.
- To meet the 1% rule (rent ≥ 1% of price), the offer needs to be $234k (6.1% below list).
- Recommended offer: $234k (6.1% below list) — sets the bar for 1% rule.
- Cap rate 7.8% vs local median 4.6% in Springfield — top-decile yield for the area; either an underpriced asset or a hidden risk that comps aren't pricing in. Stress-test before assuming the spread holds.
Location & tenants
- Location reads 75/100 on livability (#57 in MO, #4,121 nationally) — a middle-class / working-renter tenant base. Strengths: commute A+, cost of living A+, housing A+; Watch: crime F, employment F.
- Springfield R-XII (urban): math 32% / reading 46% proficiency, ranked #174 of 324 in MO (top 54%) — families likely to look elsewhere, expect single-tenant / working-renter base with shorter leases.
- Zoned schools: Cherokee Middle (math 50% / reading 62%, grade B-, #40 of 391 statewide, top 10%, 758 students, 27% FRL); Kickapoo High (math 39% / reading 66%, grade C-, #89 of 521 statewide, top 17%, 1,881 students, 26% FRL) — zoned schools average 27% FRL vs 46% district-wide (20 pts lower); this property's tenant base skews higher-income than the district average.
- Zoned-school proficiency averages 54% at this address vs 39% district-wide (+15 pts) — the actual schools serving this property are materially stronger than the Springfield R-XII average implies; a family-tenant draw the district grade alone would hide.
- Market conditions: Rents rising (+2.5%/yr); 250 active listings in the ZIP; 10 comparable units currently listed for rent nearby; rentals leasing fast (median 14d on market — plan ~1-2 weeks tenant-placement turnaround); solid renter incomes; 1,302 units permitted in Greene County in 2024 (250 in 5+ unit buildings).
Forward outlook
- Local home prices are declining (-3.0%/yr); year-one equity from $2k of loan paydown is wiped out by about $7k of value loss. Plan a longer hold.
- Greene County population projected at +25% by 2050 — long-run rental-demand tailwind backs the buy-and-hold thesis.
Negotiation context
- It's been on market 45 days — a 3% lower offer ($242k) is reasonable based on typical stale-listing flexibility.
- 2 sale attempts with the ask held roughly flat each time — persistent listings suggest the price (not the market) is what's stuck; bring a comps-based counter.
- Current owner paid $105k; list at $249k implies a 137% gain — meaningful room to come down on a strong offer.
Risks & watch-outs
- Climate carrying-cost: extreme-heat days projected 7→19/yr by 2055 (HVAC capex compounding) — expect insurance premiums to compound above CPI over the hold.
Questions for the listing agent
- It's been on market 45 days. Have you received any prior offers? Is the seller open to a 6% concession, seller financing, or rate buy-down credit?
- What does the HOA fee cover, when was the last increase, and are there any pending special assessments or reserve-fund shortfalls?
- Is there a deadline driving the sale (1031 exchange, divorce, estate, relocation)? That informs how much negotiation room exists.
- Crime grade is F in this area — have there been break-ins, vandalism, or insurance claims at this property in the last 3 years? What carrier currently insures it and at what premium?
- What's the average days-on-market for RENTAL listings here right now (not sales)? A rising rental-DOM trend means longer vacancies and softer asking-rent achievability than the comps imply.
- What's the recent tenant-quality profile in this submarket — average credit score on applications, eviction rate, late-payment / NSF rate, and stable-employment percentage? A property-management company in the area should have these aggregated.
- How much new for-sale + rental construction is in the pipeline within 1–3 miles? Heavy new supply typically softens prices + rents 12–24 months out; constrained supply supports both.
Investment metrics
- 1% rule
- 0.94% ✗
- Cap rate
- 7.78%
- Cash-on-cash
- 5.32%
- DSCR
- 1.24
- GRM
- 8.9
CMA / ARV
- ARV (on-the-fly)
- $270,810
- Comps found
- 12
Show comp detail 12 sales within ~0.75 mi
| Address | Dist | Beds/Ba | Sqft | Sold | Price | $/sf | Match |
|---|---|---|---|---|---|---|---|
| 5567 S Jefferson Ave | 0.00mi | 3/3.0 | 1,530 (0%) | 1mo | $249,000 | $163 | 99 |
| 5411 S Jefferson Ave | 0.20mi | 3/2.0 | 1,601 (+5%) | 1mo | $289,000 | $181 | 78 |
| 5645 S Jefferson Ave | 0.09mi | 3/2.0 | 1,612 (+5%) | 6mo | $247,500 | $154 | 78 |
| 5678 S Fairview Ave | 0.37mi | 3/2.0 | 1,472 (-4%) | 3mo | $289,900 | $197 | 70 |
| 5827 S Farm Road 157 | 0.34mi | 3/2.0 | 1,395 (-9%) | 3mo | $239,900 | $172 | 63 |
| 5795 S Wedgewood Ave | 0.52mi | 3/2.0 | 1,536 (+0%) | 10mo | $329,900 | $215 | 63 |
| 1120 E Oak Tree Ln | 0.70mi | 3/2.0 | 1,545 (+1%) | 4mo | $250,000 | $162 | 58 |
| 1052 E Oak Tree Ln | 0.64mi | 3/2.0 | 1,468 (-4%) | 3mo | $259,900 | $177 | 57 |
| 5537 S Pinehurst Ave | 0.63mi | 4/2.0 (+1) | 1,620 (+6%) | 8mo | $299,000 | $185 | 45 |
| 1145 E Oak Tree Ln | 0.75mi | 3/2.0 | 1,628 (+6%) | 9mo | $285,000 | $175 | 43 |
| 5496 S Stonegate Ave | 0.67mi | 3/2.0 | 1,717 (+12%) | 4mo | $285,000 | $166 | 41 |
| 5513 S Maryland Ave | 0.56mi | 3/2.0 | 1,725 (+13%) | 10mo | $320,000 | $186 | 40 |
Match score weights: distance 35% · size 25% · config 20% · recency 20%. Top-matched comps best support the ARV.
Projected returns pro-forma
-3.0% appreciation · 2.53% rent growth · sell at horizon
- IRR
- -8.6%
- Equity multiple
- 0.69×
- Total profit
- $-21,838
- Equity at exit
- $37,127
- IRR
- 0.3%
- Equity multiple
- 1.02×
- Total profit
- $1,548
- Equity at exit
- $21,529
Cash invested: $69,720 (down + closing). Projections, not guarantees.
Landlord ↔ Tenant lean methodology
- Overall (STATE)
- 81 Strongly Landlord-Friendly
- State Missouri
- 81 Strongly Landlord-Friendly · R+10
- County
- — inherits STATE
- City
- — inherits STATE
ZIP-level market 65810
- Home prices YoY
- -28.8%
- Rents YoY
- 2.5%
- Active inventory
- 250
- Price-to-rent
- 8.9×
Monthly cashflow live
- Estimated rent
- $2,338 high interval (Pro) →
- Mortgage (P&I)
- −$1,306
- Tax from tax record
- −$125 /mo · $1,503/yr
- Insurance
- −$104
- HOA
- −$3
- Vacancy / Maint / Mgmt
- −$491
- Net cashflow
- $309
Break-even live
UW: 25.0% down · 7.5% · 30yr · 1.5% tax · 5.0% vac · 8.0% maint · 8.0% mgmt
Financing live
Cash to close
- Down payment
- $62,250
- Closing costs
- $7,470
- Reserves months
- —
- Total cash needed
- —
Loan-product check · same deal, 3 products live
Conventional
25% down · 7.5% · 30yr
- Down + closing
- —
- Monthly P&I
- —
- Monthly cashflow
- —
- DSCR
- —
- Eligible?
- —
Personal DTI + credit; lowest rate.
DSCR
20% down · 8.5% · 30yr
- Down + closing
- —
- Monthly P&I
- —
- Monthly cashflow
- —
- DSCR
- —
- Eligible?
- —
No personal income docs; deal must DSCR.
Hard money
10% down · 12.0% · 12mo
- Down + closing
- —
- Monthly P&I
- —
- Monthly cashflow
- —
- DSCR
- —
- Eligible?
- —
Short-term bridge; refi at stabilization.
Rent comps 10 comps
| Address | Beds | Baths | Sqft | Rent | $/sqft | DOM | Units | Dist |
|---|---|---|---|---|---|---|---|---|
| 5305 S Michigan Ave Springfield, MO | 2.0–3.0 | 2.0–2.5 | 1644 | $2,017 | $1.23 | 13d | 3 | 0.58mi |
| 565 W Bryant Springfield, MO | 1.0–2.0 | 1.0–2.0 | 891 | $1,621 | $1.82 | 13d | 4 | 0.60mi |
| 5100 S Main Ave Springfield, MO | 1.0–2.0 | 1.0–2.0 | 925 | $1,275 | $1.38 | 13d | 1 | 0.74mi |
| 1182 E Evans St Springfield, MO | 4.0 | 3.0 | 2032 | $2,595 | $1.28 | 13d | 1 | 0.75mi |
| 5955 S Farm Road 163 Springfield, MO | 2.0 | 2.0 | 1703 | $3,440 | $2.02 | 13d | 8 | 0.82mi |
| 5955 S National Ave Unit 163 Springfield, MO | 3.0 | 2.0 | 1630 | $3,995 | $2.45 | 43d | 1 | 0.84mi |
| 1367 E Siler Pkwy Springfield, MO | 2.0 | 2.5 | 2045 | $2,695 | $1.32 | 13d | 1 | 1.07mi |
| 4730 S Robberson Ave Springfield, MO | 3.0 | 1.0–2.0 | 807 | $1,195 | $1.48 | 43d | 7 | 1.08mi |
| 1504 W High Point Cir Springfield, MO | 3.0 | 2.5 | 2031 | $1,925 | $0.95 | 23d | 1 | 1.14mi |
| 1261 E Lakewood St Springfield, MO | 4.0 | 2.5 | 1800 | $1,595 | $0.89 | 13d | 1 | 1.35mi |
HOA detail
- Monthly dues
- $3 · $36/yr
- Likely covers
- waterelectriccable
Listing history 8 events
-
2026-04-28status Pending
-
2026-04-13status Active
-
2026-04-05status Pending
-
2026-03-27price $249,000
-
2026-03-06$259,000 Active
-
2022-10-06soldstatus $105,000
-
2019-12-26soldstatus
-
1999-06-11soldstatus
ⓘ Source: listings_history table (triggers on properties + properties_extension) + one-shot
backfill from property_details.listing_events for pre-trigger history.
Tax reassessment forecast MO · Resets to sale price
- Current annual tax
- $1,503 · $125/mo
- Projected year-2 tax
- $2,415 · $201/mo
- Expected delta
- +$913/yr (+$76/mo · 60.7%)
ⓘ Screening estimate from a state-policy table — verify with the county assessor before closing.
Climate risk First Street
- Flood 1/10 Low FEMA zone X (unshaded) · 0% chance over 30 yrs
- Wildfire 3/10 Moderate
- Heat 5/10 Major 7 d/yr ≥105°F today · 19 d/yr by 30 yrs out
- Wind 2/10 Low
- Air quality 1/10 Low 0 unhealthy d/yr today · 0 by 30 yrs out
Nearby sold comps map
Loading sold comps map…
Walkable amenities ~0.75 mi
Loading nearby amenities…
Taxation est. · year 1
- Rental income
- $28,054
- − Mortgage interest
- −$13,948
- − Property taxes
- −$1,503
- − Insurance
- −$1,245
- − Repairs & maintenance
- −$2,244
- − Management
- −$2,244
- − HOA
- −$36
- − Depreciation
- −$7,244
- Taxable loss
- −$410
- Est. tax savings @ 24.0%
- +$98
- After-tax cash flow
- $3,808/yr
For passive investors: Depreciation is non-cash, so a rental often shows a tax loss while cash-flowing — sheltering income. Rental losses are passive: they offset passive income freely, and up to $25,000/yr can offset ordinary (W-2) income if you actively participate and your MAGI is under $100k (phasing out to $0 by $150k); unused losses carry forward. On sale, claimed depreciation is recaptured at up to 25%, and gains may owe capital-gains tax (a 1031 exchange can defer both). Figures are a year-1 estimate at your 24.0% rate — not tax advice; consult a CPA.
Schools (NCES district)
- District
- Springfield R-XII
- NCES district ID
- 2928860
- Math proficiency
- 32% ▼ -2.00%
- Reading proficiency
- 46% ▼ -3.00%
- Median HH income
- $37,886
- Composite
- 32.45/100
- National rank
- #5717
- State rank
- #174 of 324 in MO
Livability — Springfield
- Score
- 75/100
- State rank
- #57
- US rank
- #4121
Category grades
Schools grade is shown separately in the Schools card above.
Census & demographics
- Census place
- Springfield, MO
- County
- Greene County · 244,327 people
- City population
- 223,044
- Metro
- Springfield, MO
- Population (ZIP)
- 22,137
- Household income
- $95,160
- Rent vs Own
- Severe rent burden
- 437.0
Population outlook (Greene County) Hauer SSP2
- Today (2025)
- 319,054 people
- By 2030
- 335,135 · +5.0%
- By 2040
- 366,186 · +14.8%
- By 2050
- 397,431 · +24.6%
- By 2075
- 477,035 · +49.5%
- By 2100
- 520,828 · +63.2%
Race, ethnicity, and origin ACS 2023
- Neighborhood character
- Predominantly White (89%)
- Race & ethnicity
- White 89% Two or more races 4% Hispanic / Latino 3% Asian 3% Black 2%
- Common ancestry
- Italian 4% Lithuanian 3% Portuguese 3%
- Foreign-born
- 4% · Vietnam, China, Canada
- Languages at home
- 95% English-only · Other Indo-European 1% Spanish 1% Chinese 1%
Political lean MEDSL · Greene
- 2024 margin
- Strong R (+20.8) · D 38.9% · R 59.7% · Other 1.4%
- 2008→2024 swing
- -5.0pp toward R · 2008: -15.8pp · 2024: -20.8pp
- All cycles
- 2024: R+20.8 2020: R+20.1 2016: R+27.4 2012: R+24.4 2008: R+15.8
Not yet ingested
- Civics
- —
Market trends
- HPI YoY
- ▼ -78.67%
- Current HPI
- 194.8736
- Rent YoY
- ▲ 2.53%
- Metro
- Springfield, MO
- State GDP YoY
- ▲ 1.84%
- F500 in state
- 20
Industry mix (Fortune 500 HQ in MO)
| Industry | F500 HQs | Revenue |
|---|---|---|
| Healthcare | 1 | $163B |
|
||
| Insurance | 1 | $21B |
|
||
| Industrial Technology | 1 | $17B |
|
||
| Retail | 1 | $16B |
|
||
| Industrial Distribution | 1 | $10B |
|
||
| Utilities | 1 | $9B |
|
||
Price history
+137.1% since first listed8 events — show timeline
- 2026-04-28 Pending — SOMO
- 2026-04-13 Relisted — SOMO
- 2026-04-05 Pending — SOMO
- 2026-03-27 Price Changed $249,000 SOMO
- 2026-03-06 Listed $259,000 SOMO
- 2022-10-06 Sold (Public Records) $105,000 Public Records
- 2019-12-26 Sold (Public Records) — Public Records
- 1999-06-11 Sold (Public Records) — Public Records
Property tax history
+1.9%/yrLatest (2025): $1,503 · +0.0% YoY. Source: county tax records.
Cash-flow waterfall
monthlySold comps — $/sqft
last 12 mo · ≤1 miLoading sold comps…