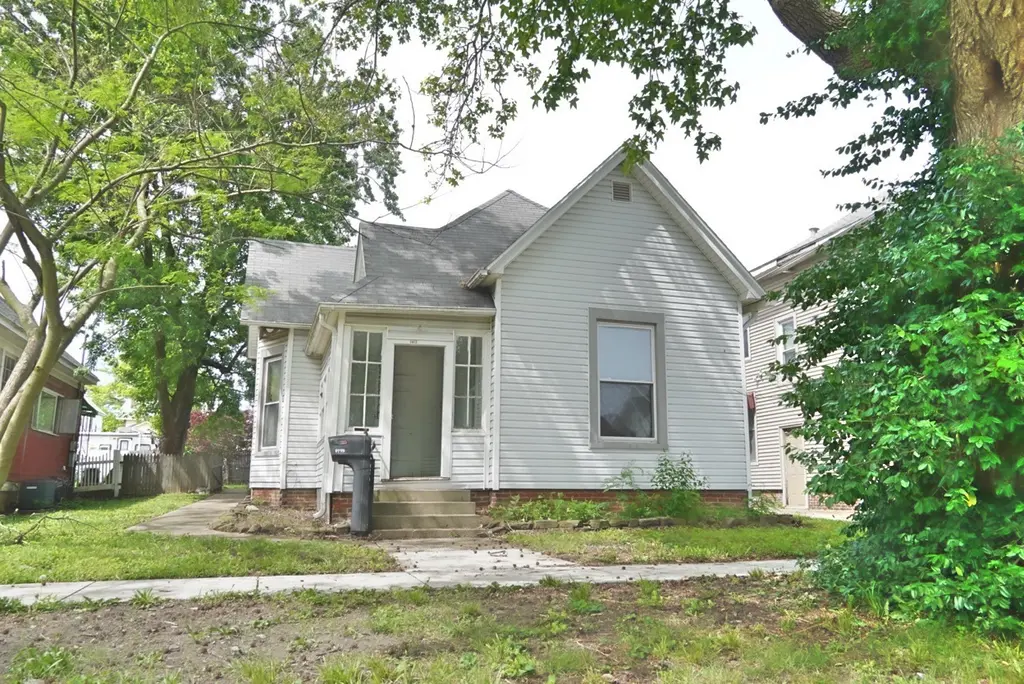
1412 Edgar Ave · Mattoon, IL
Flood risk 1/10 · Minimal
- FEMA flood zone
- X (unshaded)
- Chance of flooding over 30 yrs
- 0.0%
- Est. flood insurance / yr
- $473 – $860
Fire risk 1/10 · Minimal
- Est. fire insurance / yr
- $804 – $1,492
Heat risk 4/10 · Minor
- Hot days now (above 104°F)
- 7 days/yr
- Hot days in 30 yrs
- 19 days/yr
Wind risk 2/10 · Minimal
- Chance of severe wind over 30 yrs
- 1.0%
Air-quality risk 2/10 · Minimal
- Unhealthy air days now
- 1 days/yr
- Unhealthy air days in 30 yrs
- 2 days/yr
Risk factors via First Street. Map © Google.
Why this score? — see what drove the B- grade
The composite is a weighted blend of 9 inputs, each scored 0–100. Each bar is that input's sub-score; the figure is the points it added to the 100-point composite (weight × sub-score).
- Cash flow +30.0/30.0
- DSCR +10.0/10.0
- 1% rule +9.2/10.0
- ARV discount +7.5/15.0
- Livability +3.2/5.0
- Rent growth +2.5/5.0
- Condition / age +2.5/5.0
- Schools +1.6/10.0
- Appreciation +0.0/10.0
$59,900
🖨 Deal sheet 📄 Offer letter ✓ Due diligence
Listing remarks
Unlock your future with this fantastic investment property - 2 spacious bedrooms, 1 bathroom, and a basement full of potential, plus generous parking space, offering limitless opportunities for growth and success. Roof less than ten years. All new water line pvc drain lines. Electrical upgrades, Furnace and ac 3 years old. Don't pass up on this opportunity! Sale is AS- is
Key facts
- Electrical upgrades
- 6,534 sq ft lot
- 10 parking spots
Tags
Property features AI
Finance
- Other: Fee simple ownership
- HOA & community: No master association fee required
Exterior
- Parking: Space for 10 vehicles; Driveway parking; Guest parking available
- Utilities: Public water; Public sewer; Electric service (standard)
- Home design: Detached single-family home; One-story
- Construction: Vinyl siding; Over 100 years old; Built before 1978
- Exterior features: 49 x 140 lot dimensions; Lot smaller than 0.25 acre; Curbs and paved streets
Interior
- Kitchen: Kitchen on main level (15 x 14)
- Bedrooms: Master bedroom on main level (20 x 15); Second bedroom on main level (20 x 14); Additional bedrooms present
- Bathrooms: 1 full bathroom
- Heating & cooling: Natural gas heating; Central air conditioning
- Interior features: 6 total rooms; Unfinished partial basement
- Laundry & utility: Laundry room
Neighborhood map
What this means for you Summary
Snapshot
- This is a 2-bed/1.0-bath single-family listed at $60k.
Deal economics
- At list price, monthly cash flow is $260 ($3k/yr) — positive.
- The deal already cash-flows at list — no discount required.
- Meets the 1% rule at list price ($849 rent vs $60k).
- Recommended offer: $59k (1.5% below list) — sets the bar for market timing.
- Cap rate 11.5% vs local median 3.6% in Mattoon — top-decile yield for the area; either an underpriced asset or a hidden risk that comps aren't pricing in. Stress-test before assuming the spread holds.
Location & tenants
- Location reads 64/100 on livability (#706 in IL) — a middle-class / working-renter tenant base. Strengths: cost of living A+, housing A+; Watch: crime D, schools D-, amenities F.
- Mattoon CUSD 2 (town): math 13% / reading 24% proficiency, ranked #462 of 620 in IL (top 74%) — low school quality limits family demand, transient renter base, plan for 1-2y turnover.
- Market conditions: 117 active listings in the ZIP; 34 units permitted in Coles County in 2024 (30 in 5+ unit buildings).
- This rent is only 18% of the median local income ($58k/yr) — well below the 30% rent-burden line; pricing power to push rent on renewal without tenant pushback.
Forward outlook
- Local home prices are declining (-3.0%/yr); year-one equity from $414 of loan paydown is wiped out by about $2k of value loss. Plan a longer hold.
- Coles County population projected to shrink 7% by 2050 — rents likely to lag national; underwrite the cash flow, not the appreciation.
- At projected returns (-3.0% appreciation + 3.0% rent growth), your $17k cash investment doubles in ~7 years — after that, you're playing with house money.
Negotiation context
- It's been on market 24 days — a 2% lower offer ($59k) is reasonable based on typical stale-listing flexibility.
Risks & watch-outs
- Watch-outs: built in 1891 — expect roof / HVAC / electrical / plumbing capex.
Questions for the listing agent
- Built in 1891 — when were the roof, HVAC, electrical panel, plumbing, and water heater last replaced?
- Is there a deadline driving the sale (1031 exchange, divorce, estate, relocation)? That informs how much negotiation room exists.
- Schools are D-rated, which usually means shorter tenancies and higher turnover. Who's the typical renter profile here, and what's been the actual vacancy rate?
- Crime grade is D in this area — have there been break-ins, vandalism, or insurance claims at this property in the last 3 years? What carrier currently insures it and at what premium?
- What's the average days-on-market for RENTAL listings here right now (not sales)? A rising rental-DOM trend means longer vacancies and softer asking-rent achievability than the comps imply.
- What's the recent tenant-quality profile in this submarket — average credit score on applications, eviction rate, late-payment / NSF rate, and stable-employment percentage? A property-management company in the area should have these aggregated.
- How much new for-sale + rental construction is in the pipeline within 1–3 miles? Heavy new supply typically softens prices + rents 12–24 months out; constrained supply supports both.
Investment metrics
- 1% rule
- 1.42% ✓
- Cap rate
- 11.50%
- Cash-on-cash
- 18.59%
- DSCR
- 1.83
- GRM
- 5.9
CMA / ARV
- ARV (on-the-fly)
- $141,570
- Comps found
- 12
Show comp detail 12 sales within ~0.75 mi
| Address | Dist | Beds/Ba | Sqft | Sold | Price | $/sf | Match |
|---|---|---|---|---|---|---|---|
| 1017 S 14th St | 0.42mi | 2/1.0 | 1,121 (-7%) | 3mo | $79,500 | $71 | 66 |
| 609 Marshall Ave | 0.60mi | 3/2.0 (+1) | 1,194 (-1%) | 0mo | $153,000 | $128 | 60 |
| 720 Edgar Ave | 0.49mi | 2/1.0 | 1,122 (-7%) | 6mo | $80,000 | $71 | 60 |
| 801 Richmond Ave | 0.62mi | 2/1.0 | 1,150 (-5%) | 6mo | $35,000 | $30 | 58 |
| 808 9th St | 0.51mi | 3/1.5 (+1) | 1,244 (+3%) | 10mo | $49,900 | $40 | 56 |
| 609 Wabash Ave | 0.60mi | 2/1.0 | 1,080 (-11%) | 0mo | $141,000 | $131 | 54 |
| 913 Lafayette Ave | 0.37mi | 3/1.0 (+1) | 1,364 (+13%) | 5mo | $165,000 | $121 | 52 |
| 913 Lafayette Ave | 0.37mi | 3/1.0 (+1) | 1,364 (+13%) | 5mo | $165,000 | $121 | 52 |
| 1112 Moultrie Ave | 0.70mi | 3/1.0 (+1) | 1,099 (-9%) | 1mo | $107,100 | $97 | 46 |
| 805 S 5th Pl | 0.70mi | 3/1.0 (+1) | 1,275 (+5%) | 11mo | $142,000 | $111 | 44 |
| 820 Oklahoma Ave | 0.72mi | 2/2.0 | 1,096 (-9%) | 10mo | $128,000 | $117 | 39 |
| 905 S 23rd St | 0.69mi | 3/1.0 (+1) | 1,056 (-13%) | 5mo | $140,000 | $133 | 37 |
Match score weights: distance 35% · size 25% · config 20% · recency 20%. Top-matched comps best support the ARV.
Projected returns pro-forma
-3.0% appreciation · 3.0% rent growth · sell at horizon
- IRR
- 10.3%
- Equity multiple
- 1.41×
- Total profit
- $6,855
- Equity at exit
- $8,931
- IRR
- 19.4%
- Equity multiple
- 2.63×
- Total profit
- $27,326
- Equity at exit
- $5,179
Cash invested: $16,772 (down + closing). Projections, not guarantees.
Landlord ↔ Tenant lean methodology
- Overall (STATE)
- 43 Moderately Tenant-Leaning
- State Illinois
- 43 Moderately Tenant-Leaning · D+7
- County
- — inherits STATE
- City
- — inherits STATE
ZIP-level market 61938
- Active inventory
- 117
- Price-to-rent
- 5.9×
Monthly cashflow live
- Estimated rent
- $849 medium interval (Pro) →
- Mortgage (P&I)
- −$314
- Tax from tax record
- −$72 /mo · $862/yr
- Insurance
- −$25
- HOA
- −$0
- Vacancy / Maint / Mgmt
- −$178
- Net cashflow
- $260
Break-even live
UW: 25.0% down · 7.5% · 30yr · 1.5% tax · 5.0% vac · 8.0% maint · 8.0% mgmt
Financing live
Cash to close
- Down payment
- $14,975
- Closing costs
- $1,797
- Reserves months
- —
- Total cash needed
- —
Loan-product check · same deal, 3 products live
Conventional
25% down · 7.5% · 30yr
- Down + closing
- —
- Monthly P&I
- —
- Monthly cashflow
- —
- DSCR
- —
- Eligible?
- —
Personal DTI + credit; lowest rate.
DSCR
20% down · 8.5% · 30yr
- Down + closing
- —
- Monthly P&I
- —
- Monthly cashflow
- —
- DSCR
- —
- Eligible?
- —
No personal income docs; deal must DSCR.
Hard money
10% down · 12.0% · 12mo
- Down + closing
- —
- Monthly P&I
- —
- Monthly cashflow
- —
- DSCR
- —
- Eligible?
- —
Short-term bridge; refi at stabilization.
Listing history 16 events
-
2026-06-19days on market $59,900 Active 24 DOM
-
2026-06-18days on market $59,900 Active 23 DOM
-
2026-06-17days on market $59,900 Active 22 DOM
-
2026-06-16days on market $59,900 Active 21 DOM
-
2026-06-15days on market $59,900 Active 20 DOM
-
2026-06-14days on market $59,900 Active 18 DOM
-
2026-06-12pricedays on market $59,900 Active 17 DOM
-
2026-06-09days on market $64,999 Active 14 DOM
-
2026-06-08days on market $64,999 Active 13 DOM
-
2026-06-07days on market $64,999 Active 12 DOM
-
2026-06-03days on market $64,999 Active 8 DOM
-
2026-06-02days on market $64,999 Active 7 DOM
-
2026-06-01days on market $64,999 Active 6 DOM
-
2026-05-31days on market $64,999 Active 5 DOM
-
2026-05-30days on market $64,999 Active 4 DOM
-
2026-05-26$64,999 Active
ⓘ Source: listings_history table (triggers on properties + properties_extension) + one-shot
backfill from property_details.listing_events for pre-trigger history.
Tax reassessment forecast IL · Partial reset (capped growth)
- Current annual tax
- $862 · $72/mo
- Projected year-2 tax
- $1,111 · $93/mo
- Expected delta
- +$249/yr (+$21/mo · 28.9%)
ⓘ Screening estimate from a state-policy table — verify with the county assessor before closing.
Climate risk First Street
- Flood 1/10 Low FEMA zone X (unshaded) · 0% chance over 30 yrs
- Wildfire 1/10 Low
- Heat 4/10 Moderate 7 d/yr ≥104°F today · 19 d/yr by 30 yrs out
- Wind 2/10 Low 100% chance of damaging wind over 30 yrs
- Air quality 2/10 Low 1 unhealthy d/yr today · 2 by 30 yrs out
Nearby sold comps map
Loading sold comps map…
Walkable amenities ~0.75 mi
Loading nearby amenities…
Taxation est. · year 1
- Rental income
- $10,188
- − Mortgage interest
- −$3,355
- − Property taxes
- −$862
- − Insurance
- −$300
- − Repairs & maintenance
- −$815
- − Management
- −$815
- − Depreciation
- −$1,743
- Taxable income
- $2,299
- Est. tax owed @ 24.0%
- −$552
- After-tax cash flow
- $2,567/yr
For passive investors: Depreciation is non-cash, so a rental often shows a tax loss while cash-flowing — sheltering income. Rental losses are passive: they offset passive income freely, and up to $25,000/yr can offset ordinary (W-2) income if you actively participate and your MAGI is under $100k (phasing out to $0 by $150k); unused losses carry forward. On sale, claimed depreciation is recaptured at up to 25%, and gains may owe capital-gains tax (a 1031 exchange can defer both). Figures are a year-1 estimate at your 24.0% rate — not tax advice; consult a CPA.
Schools (NCES district)
- District
- Mattoon CUSD 2
- NCES district ID
- 1725050
- Math proficiency
- 13% ▼ -9.00%
- Reading proficiency
- 24% ▼ -12.00%
- Median HH income
- $40,452
- Composite
- 15.71/100
- National rank
- #9280
- State rank
- #462 of 620 in IL
Livability — Mattoon
- Score
- 64/100
- State rank
- #706
- US rank
- #14352
Category grades
Schools grade is shown separately in the Schools card above.
Census & demographics
- Census place
- Mattoon, IL
- County
- Coles County · 41,301 people
- City population
- 20,350
- Metro
- Charleston-Mattoon, IL
- Population (ZIP)
- 20,350
- Household income
- $57,503
- Rent vs Own
- Severe rent burden
- 453.0
Population outlook (Coles County) Hauer SSP2
- Today (2025)
- 53,967 people
- By 2030
- 53,829 · -0.3%
- By 2040
- 52,332 · -3.0%
- By 2050
- 49,989 · -7.4%
- By 2075
- 42,226 · -21.8%
- By 2100
- 34,675 · -35.7%
Race, ethnicity, and origin ACS 2023
- Neighborhood character
- Predominantly White (91%)
- Race & ethnicity
- White 91% Two or more races 5% Hispanic / Latino 3% Black 2%
- Common ancestry
- Italian 2% Slovak 2% Serbian 1%
- Foreign-born
- 1%
- Languages at home
- 97% English-only · Spanish 1% German/W. Germanic 1%
Political lean MEDSL · Coles
- 2024 margin
- Strong R (+28.5) · D 34.9% · R 63.4% · Other 1.7%
- 2008→2024 swing
- -31.7pp toward R · 2008: 3.2pp · 2024: -28.5pp
- All cycles
- 2024: R+28.5 2020: R+26.4 2016: R+26.4 2012: R+11.1 2008: D+3.2
Not yet ingested
- Civics
- —
Market trends
- HPI YoY
- ▼ -103.29%
- Current HPI
- 133.8791
- Rent YoY
- —
- Metro
- Charleston-Mattoon, IL
- State GDP YoY
- ▲ 1.59%
- F500 in state
- 60
Industry mix (Fortune 500 HQ in IL)
| Industry | F500 HQs | Revenue |
|---|---|---|
| Insurance | 4 | $201B |
|
||
| Consumer Goods | 4 | $87B |
|
||
| Industrial Machinery | 3 | $64B |
|
||
| Healthcare | 2 | $55B |
|
||
| Retail / Pharmacy | 1 | $148B |
|
||
| Agriculture / Food | 1 | $86B |
|
||
Price history
1 event — show timeline
- 2026-05-26 Listed $64,999 MRED as Distributed by MLS Grid
Property tax history
+2.4%/yrLatest (2024): $862 · +15.8% YoY. Source: county tax records.
Cash-flow waterfall
monthlySold comps — $/sqft
last 12 mo · ≤1 miLoading sold comps…