 Duplex
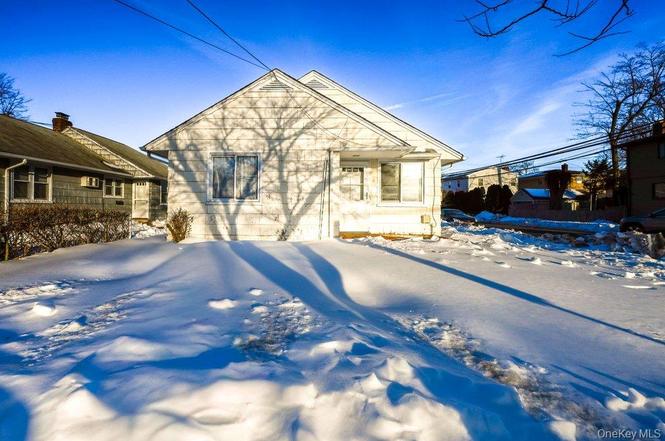
40 Firwood Rd Unit Main St · Manorhaven, NY
Flood risk 3/10 · Minor
- FEMA flood zone
- X (unshaded)
- Chance of flooding over 30 yrs
- 0.07%
- Est. flood insurance / yr
- $507 – $1,088
Fire risk 1/10 · Minimal
- Est. fire insurance / yr
- $691 – $1,283
Heat risk 6/10 · Moderate
- Hot days now (above 97°F)
- 7 days/yr
- Hot days in 30 yrs
- 16 days/yr
Wind risk 6/10 · Moderate
- Chance of severe wind over 30 yrs
- 27.0%
Air-quality risk 4/10 · Minor
- Unhealthy air days now
- 6 days/yr
- Unhealthy air days in 30 yrs
- 7 days/yr
Risk factors via First Street. Map © Google.
Why this score? — see what drove the D+ grade
The composite is a weighted blend of 9 inputs, each scored 0–100. Each bar is that input's sub-score; the figure is the points it added to the 100-point composite (weight × sub-score).
- Cash flow +13.5/30.0
- ARV discount +7.5/15.0
- Schools +6.8/10.0
- Rent growth +5.0/5.0
- DSCR +4.1/10.0
- 1% rule +3.8/10.0
- Livability +3.7/5.0
- Condition / age +2.5/5.0
- Appreciation +0.0/10.0
$715,000
🖨 Deal sheet (PDF) 📄 Offer letter ✓ Due diligence
Multi-family units
County records classify this as Multi-Family (2-4 Unit). Listing-text estimate: 2 units. confirmed
Listing remarks
This well-maintained two-family ranch offers a fantastic opportunity for homeowners and investors alike, featuring a spacious two-bedroom unit alongside a comfortable one-bedroom unit, Unit A comes with updated kitchen and bathroom. Ideally located just minutes from the bay and the town pool, the property is also conveniently close to transportation, popular restaurants, and unique specialty shops. With low taxes keeping ownership affordable, you can choose to rent both units for steady income or live in one while offsetting your costs by renting the other—flexible living with smart investment potential.
Key facts
- 4,000 sq ft lot
- 2 garage spots
- Built 1957
Neighborhood map
What this means for you Summary
Snapshot
- This is a 1×2bd/1.5ba + 1×1bd/1.5ba units multifamily listed at $715k.
Deal economics
- At list price, monthly cash flow is $27 ($325/yr) — positive. Per door: $14/mo.
- The deal already cash-flows at list — no discount required.
- To meet the 1% rule (rent ≥ 1% of price), the offer needs to be $629k (12.0% below list).
- Recommended offer: $629k (12.0% below list) — sets the bar for 1% rule.
Location & tenants
- Location reads 74/100 on livability (#279 in NY, #4,435 nationally) — a middle-class / working-renter tenant base. Strengths: crime A+, commute A+, employment A+; Watch: housing D+, amenities D-, cost of living F.
- Port Washington Union Free School District (suburban): math 75% / reading 72% proficiency, ranked #69 of 590 in NY (top 12%) — strong family-tenant draw, lease renewals of 3-5y typical; only 12% free/reduced lunch — higher-income household profile.
- Zoned schools: Manorhaven Elementary School (math 62% / reading 62%, grade B, #675 of 2,108 statewide, top 35%, 477 students, 2% FRL); Carrie Palmer Weber Middle School (math 63% / reading 71%, grade A-, #101 of 729 statewide, top 15%, 1,216 students, 0% FRL); Paul D Schreiber Senior High School (math 100% / reading 77%, grade A, #299 of 1,100 statewide, top 27%, 1,613 students, 6% FRL).
- Market conditions: Rents rising fast (+17.0%/yr); 153 active listings in the ZIP; high-income renter base; 824 units permitted in Nassau County in 2024 (153 in 5+ unit buildings).
- At $6,289/mo this rent would consume 49% of the median local household income ($154k/yr) (locally 857% of renters already pay >50% of income on rent) — very limited rent-growth headroom before tenants either downsize or default.
Forward outlook
- Local home prices are declining (-3.0%/yr); year-one equity from $5k of loan paydown is wiped out by about $21k of value loss. Plan a longer hold.
- Nassau County population projected at +7% by 2050 — modest demand growth; plan on rents tracking national, not racing it.
Negotiation context
- It's been on market 21 days — a 2% lower offer ($704k) is reasonable based on typical stale-listing flexibility.
Risks & watch-outs
- Watch-outs: built in 1957 — expect roof / HVAC / electrical / plumbing capex.
- Climate carrying-cost: major wind risk, 27% chance of damaging wind over 30y; extreme-heat days projected 7→16/yr by 2055 (HVAC capex compounding) — expect insurance premiums to compound above CPI over the hold.
Questions for the listing agent
- Can we see the unit-by-unit rent roll, current vacancy, and any below-market leases? What's the average tenancy length?
- What capital expenditures (roof, boiler, parking lot, exteriors) have been made in the last 5 years, and what's planned in the next 2?
- Built in 1957 — when were the roof, HVAC, electrical panel, plumbing, and water heater last replaced?
- Is there a deadline driving the sale (1031 exchange, divorce, estate, relocation)? That informs how much negotiation room exists.
- Schools are B-rated — typically a magnet for longer-tenancy family renters. What's the average tenant stay here, and is there a school-zone premium baked into asking?
- The area grade is low — what's the realistic commute time and amenity access for the typical tenant pool here? Any planned neighborhood developments (good or bad) we should know about?
- What's the average days-on-market for RENTAL listings here right now (not sales)? A rising rental-DOM trend means longer vacancies and softer asking-rent achievability than the comps imply.
- What's the recent tenant-quality profile in this submarket — average credit score on applications, eviction rate, late-payment / NSF rate, and stable-employment percentage? A property-management company in the area should have these aggregated.
- How much new apartment / multifamily construction is in the pipeline within 1–3 miles? Heavy new supply (>2% of stock underway) typically softens rents 12–24 months out; light construction supports rent growth.
Investment metrics
- 1% rule
- 0.88% ✗
- Cap rate
- 6.34%
- Cash-on-cash
- 0.16%
- DSCR
- 1.01
- GRM
- 9.5
CMA / ARV
No comps found within radius.
Projected returns pro-forma
-3.0% appreciation · 8.0% rent growth · sell at horizon
- IRR
- -10.6%
- Equity multiple
- 0.60×
- Total profit
- $-80,804
- Equity at exit
- $106,609
- IRR
- 4.7%
- Equity multiple
- 1.42×
- Total profit
- $83,517
- Equity at exit
- $61,820
Cash invested: $200,200 (down + closing). Projections, not guarantees.
Landlord ↔ Tenant lean methodology
- Overall (STATE)
- 15 Strongly Tenant-Friendly
- State New York
- 15 Strongly Tenant-Friendly · D+10
- County
- — inherits STATE
- City
- — inherits STATE
ZIP-level market 11050
- Rents YoY
- 17.0%
- Active inventory
- 153
- Price-to-rent
- 18.0×
Monthly cashflow live
- Estimated rent
- $6,289 medium interval (Pro) →
- Mortgage (P&I)
- −$3,750
- Tax est. 1.5%
- −$894 /mo · $10,725/yr
- Insurance
- −$298
- HOA
- −$0
- Vacancy / Maint / Mgmt
- −$1,321
- Net cashflow
- $27
Break-even live
Sensitivity live
| Price | -10% $521 | -5% $274 | +0% $27 | +5% $-220 | +10% $-467 |
|---|---|---|---|---|---|
| Rent | -10% $-470 | -5% $-221 | +0% $27 | +5% $276 | +10% $524 |
| Rate | -1.0pp $387 | -0.5pp $209 | base $27 | +0.5pp $-158 | +1.0pp $-347 |
2-unit breakdown (identical units grouped — click to expand)
| Units | Beds | Baths | Est. rent |
|---|---|---|---|
| 1× unit | 2 | 1.5 | $3,313 |
| 1× unit | 1 | 1.5 | $2,976 |
| Total (2 units) | $6,289 | ||
UW: 25.0% down · 7.5% · 30yr · 1.5% tax · 5.0% vac · 8.0% maint · 8.0% mgmt
Financing live
Cash to close
- Down payment
- $178,750
- Closing costs
- $21,450
- Reserves months
- —
- Total cash needed
- —
Loan-product check · same deal, 3 products live
Conventional
25% down · 7.5% · 30yr
- Down + closing
- —
- Monthly P&I
- —
- Monthly cashflow
- —
- DSCR
- —
- Eligible?
- —
Personal DTI + credit; lowest rate.
DSCR
20% down · 8.5% · 30yr
- Down + closing
- —
- Monthly P&I
- —
- Monthly cashflow
- —
- DSCR
- —
- Eligible?
- —
No personal income docs; deal must DSCR.
Hard money
10% down · 12.0% · 12mo
- Down + closing
- —
- Monthly P&I
- —
- Monthly cashflow
- —
- DSCR
- —
- Eligible?
- —
Short-term bridge; refi at stabilization.
Listing history 3 events
-
2026-02-25status Pending
-
2026-02-05$715,000 Active
-
2026-02-03historical $715,000
ⓘ Source: listings_history table (triggers on properties + properties_extension) + one-shot
backfill from property_details.listing_events for pre-trigger history.
Climate risk First Street
- Flood 3/10 Moderate FEMA zone X (unshaded) · 7% chance over 30 yrs
- Wildfire 1/10 Low
- Heat 6/10 Major 7 d/yr ≥97°F today · 16 d/yr by 30 yrs out
- Wind 6/10 Major 27% chance of damaging wind over 30 yrs
- Air quality 4/10 Moderate 6 unhealthy d/yr today · 7 by 30 yrs out
Nearby sold comps map
Loading sold comps map…
Walkable amenities ~0.75 mi
Loading nearby amenities…
Taxation est. · year 1
- Rental income
- $75,468
- − Mortgage interest
- −$40,051
- − Property taxes
- −$10,725
- − Insurance
- −$3,575
- − Repairs & maintenance
- −$6,037
- − Management
- −$6,037
- − Depreciation
- −$20,800
- Taxable loss
- −$11,758
- Est. tax savings @ 24.0%
- +$2,822
- After-tax cash flow
- $3,147/yr
For passive investors: Depreciation is non-cash, so a rental often shows a tax loss while cash-flowing — sheltering income. Rental losses are passive: they offset passive income freely, and up to $25,000/yr can offset ordinary (W-2) income if you actively participate and your MAGI is under $100k (phasing out to $0 by $150k); unused losses carry forward. On sale, claimed depreciation is recaptured at up to 25%, and gains may owe capital-gains tax (a 1031 exchange can defer both). Figures are a year-1 estimate at your 24.0% rate — not tax advice; consult a CPA.
Schools (NCES district)
- District
- Port Washington Union Free School District
- NCES district ID
- 3623580
- Math proficiency
- 75% ▼ -2.00%
- Reading proficiency
- 72% ▲ 3.00%
- Median HH income
- $108,016
- Composite
- 67.83/100
- National rank
- #362
- State rank
- #69 of 590 in NY
Livability — Manorhaven
- Score
- 74/100
- State rank
- #279
- US rank
- #4435
Category grades
Schools grade is shown separately in the Schools card above.
Census & demographics
- Census place
- Manorhaven, NY
- County
- Nassau County · 653,051 people
- Metro
- New York-Newark-Jersey City, NY-NJ-PA
- Population (ZIP)
- 32,794
- Household income
- $154,225
- Rent vs Own
- Severe rent burden
- 857.0
Population outlook (Nassau County) Hauer SSP2
- Today (2025)
- 1,409,302 people
- By 2030
- 1,431,482 · +1.6%
- By 2040
- 1,471,607 · +4.4%
- By 2050
- 1,502,845 · +6.6%
- By 2075
- 1,575,403 · +11.8%
- By 2100
- 1,554,356 · +10.3%
Race, ethnicity, and origin ACS 2023
- Neighborhood character
- Predominantly White (67%)
- Race & ethnicity
- White 67% Hispanic / Latino 18% Two or more races 10% Asian 10% Black 2%
- Hispanic origin (detail)
- Mexican 3%
- Common ancestry
- Scotch-Irish 5% Romanian 4% Italian 3%
- Foreign-born
- 18% · Canada, China, South Korea
- Languages at home
- 75% English-only · Spanish 14% Other Indo-European 3% Chinese 3%
Political lean MEDSL · Nassau
- 2024 margin
- Toss-up / Even · D 47.9% · R 52.1%
- 2008→2024 swing
- -12.6pp toward R · 2008: 8.4pp · 2024: -4.2pp
- All cycles
- 2024: R+4.2 2020: D+9.5 2016: D+5.3 2012: D+6.7 2008: D+8.4
Not yet ingested
- Civics
- —
Market trends
- HPI YoY
- ▼ -893.18%
- Current HPI
- 260.9293
- Rent YoY
- ▲ 17.00%
- Metro
- New York-Newark-Jersey City, NY-NJ-PA
- State GDP YoY
- ▲ 2.60%
- F500 in state
- 92
Industry mix (Fortune 500 HQ in NY)
| Industry | F500 HQs | Revenue |
|---|---|---|
| Financial Services | 10 | $950B |
|
||
| Consumer Goods | 9 | $162B |
|
||
| Insurance | 4 | $225B |
|
||
| Telecommunications | 2 | $144B |
|
||
| Pharmaceuticals | 2 | $112B |
|
||
| Media / Entertainment | 2 | $69B |
|
||
Price history
+0.0% since first listed3 events — show timeline
- 2026-02-25 Pending — OneKey® MLS as Distributed by MLS Grid
- 2026-02-05 Listed $715,000 OneKey® MLS as Distributed by MLS Grid
- 2026-02-03 Coming Soon $715,000 OneKey® MLS as Distributed by MLS Grid
Cash-flow waterfall
monthlySold comps — $/sqft
last 12 mo · ≤1 miLoading sold comps…