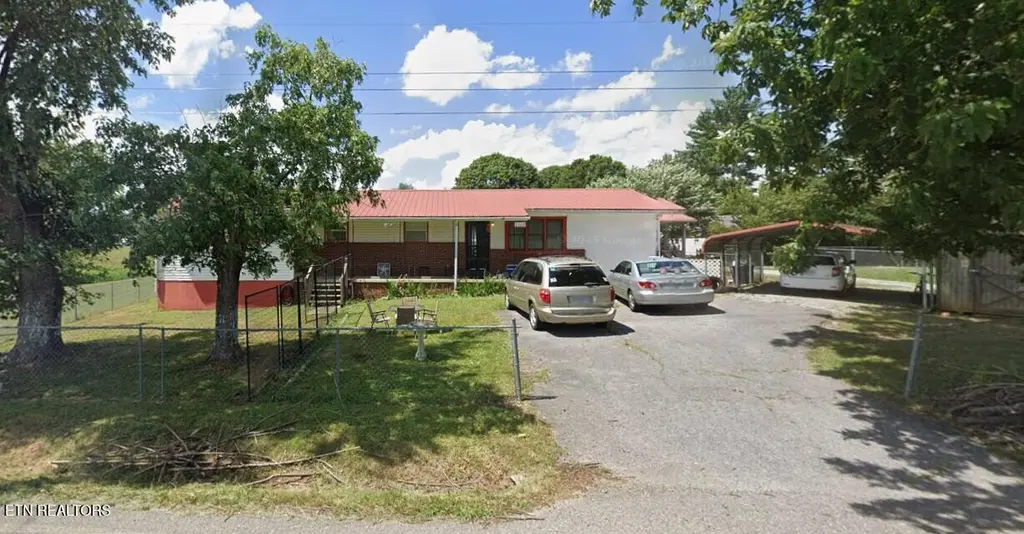
1110 Hickory Flats Rd · Pennington Gap, VA
Flood risk 1/10 · Minimal
- FEMA flood zone
- X (unshaded)
- Chance of flooding over 30 yrs
- 0.0%
- Est. flood insurance / yr
- $507 – $1,088
Fire risk 6/10 · Moderate
- Est. fire insurance / yr
- $666 – $1,236
Heat risk 4/10 · Minor
- Hot days now (above 97°F)
- 7 days/yr
- Hot days in 30 yrs
- 20 days/yr
Wind risk 2/10 · Minimal
- Chance of severe wind over 30 yrs
- 1.0%
Air-quality risk 2/10 · Minimal
- Unhealthy air days now
- 1 days/yr
- Unhealthy air days in 30 yrs
- 1 days/yr
Risk factors via First Street. Map © Google.
Why this score? — see what drove the C- grade
The composite is a weighted blend of 9 inputs, each scored 0–100. Each bar is that input's sub-score; the figure is the points it added to the 100-point composite (weight × sub-score).
- ARV discount +15.0/15.0
- Cash flow +11.2/30.0
- Appreciation +7.8/10.0
- Schools +5.0/10.0
- DSCR +3.3/10.0
- Livability +3.1/5.0
- Rent growth +2.5/5.0
- Condition / age +2.5/5.0
- 1% rule +2.3/10.0
$164,900
🖨 Deal sheet 📄 Offer letter ✓ Due diligence
Listing remarks MLS
4 BEDROOM HOME FOR SALE IN THE DESIRABLE HICKORY FLATS AREA OF PENNINGTON GAP VA! Take a look at this beautiful home featuring: 4 bedrooms (optional 5th), 2 bathrooms, living room, kitchen, LVP flooring, metal roof, fenced yard, covered porch, great location, and so much more! Call today to schedule your tour!
Key facts
- Covered porch
- Metal roof
- Fenced yard
Tags
Neighborhood map
What this means for you Summary
Snapshot
- This is a 3-bed/2.0-bath single-family listed at $165k.
Deal economics
- At list price, monthly cash flow is $-63 ($-755/yr) — negative.
- To cash-flow at today's rent, offer at most $154k (6.7% below list).
- To meet the 1% rule (rent ≥ 1% of price), the offer needs to be $121k (26.6% below list).
- Recommended offer: $121k (26.6% below list) — sets the bar for 1% rule.
Location & tenants
- Location reads 62/100 on livability (#410 in VA) — a middle-class / working-renter tenant base. Strengths: crime A+, cost of living A+, housing B; Watch: amenities F, commute F, employment F.
- Lee County Public School District (rural): math 53% / reading 69% proficiency, ranked #62 of 131 in VA (top 47%) — acceptable for families but not a draw, mixed tenant base, ~2y average lease.
- Market conditions: 30 active listings in the ZIP; 18 units permitted in Lee County in 2024 (0 in 5+ unit buildings).
Forward outlook
- In year one you build about $10k of equity ($1k loan paydown + $9k appreciation (5.6% local appreciation)).
- Lee County population projected at -27% by 2050 — secular population decline; favor cash flow + early exit over multi-decade hold.
- At projected returns (5.6% appreciation + 3.0% rent growth), your $46k cash investment doubles in ~5 years — after that, you're playing with house money.
- By year 4, paydown + projected appreciation supports a ~$35k cash-out refi (75% LTV) — recoverable capital for the next deal without selling this one.
Negotiation context
- It's been on market 134 days — a 12% lower offer ($145k) is reasonable based on typical stale-listing flexibility.
- Current owner paid $63k; list at $165k implies a 162% gain — meaningful room to come down on a strong offer.
Risks & watch-outs
- Climate carrying-cost: major wildfire risk — expect insurance premiums to compound above CPI over the hold.
Questions for the listing agent
- What do current leases actually rent for vs. the listed asking? Can we see a recent rent roll and the last 12 months of T-12 income?
- It's been on market 134 days. Have you received any prior offers? Is the seller open to a 27% concession, seller financing, or rate buy-down credit?
- Built in 1976 — when were the roof, HVAC, electrical panel, plumbing, and water heater last replaced?
- Why hasn't it sold? Are there any deal-killer items the seller is aware of (foundation, flood, title, zoning, code violations)?
- Is there a deadline driving the sale (1031 exchange, divorce, estate, relocation)? That informs how much negotiation room exists.
- What's the average days-on-market for RENTAL listings here right now (not sales)? A rising rental-DOM trend means longer vacancies and softer asking-rent achievability than the comps imply.
- What's the recent tenant-quality profile in this submarket — average credit score on applications, eviction rate, late-payment / NSF rate, and stable-employment percentage? A property-management company in the area should have these aggregated.
- How much new for-sale + rental construction is in the pipeline within 1–3 miles? Heavy new supply typically softens prices + rents 12–24 months out; constrained supply supports both.
Investment metrics
- 1% rule
- 0.73% ✗
- Cap rate
- 5.83%
- Cash-on-cash
- -1.64%
- DSCR
- 0.93
- GRM
- 11.3
CMA / ARV
- ARV (median comp)
- $202,922
- List price
- $164,900
- Delta
- -18.74%
- Verdict
- UNDERPRICED
- Comps
- 6 within 1.0 mi
Show comp detail 1 sale within ~0.75 mi
| Address | Dist | Beds/Ba | Sqft | Sold | Price | $/sf | Match |
|---|---|---|---|---|---|---|---|
| 141 Clyde Ellis Dr | 0.13mi | 3/2.0 | 1,800 (-5%) | 6mo | $175,760 | $98 | 80 |
Match score weights: distance 35% · size 25% · config 20% · recency 20%. Top-matched comps best support the ARV.
Projected returns pro-forma
5.59% appreciation · 3.0% rent growth · sell at horizon
- IRR
- 13.0%
- Equity multiple
- 1.86×
- Total profit
- $39,582
- Equity at exit
- $99,446
- IRR
- 13.7%
- Equity multiple
- 3.61×
- Total profit
- $120,602
- Equity at exit
- $176,809
Cash invested: $46,172 (down + closing). Projections, not guarantees.
Landlord ↔ Tenant lean methodology
- Overall (STATE)
- 55 Moderately Landlord-Leaning
- State Virginia
- 55 Moderately Landlord-Leaning · D+2
- County
- — inherits STATE
- City
- — inherits STATE
ZIP-level market 24277
- Home prices YoY
- 3.5%
- Active inventory
- 30
- Price-to-rent
- 11.3×
Monthly cashflow live
- Estimated rent
- $1,211 medium interval (Pro) →
- Mortgage (P&I)
- −$865
- Tax from tax record
- −$86 /mo · $1,033/yr
- Insurance
- −$69
- HOA
- −$0
- Vacancy / Maint / Mgmt
- −$254
- Net cashflow
- $-63
Break-even live
UW: 25.0% down · 7.5% · 30yr · 1.5% tax · 5.0% vac · 8.0% maint · 8.0% mgmt
Financing live
Cash to close
- Down payment
- $41,225
- Closing costs
- $4,947
- Reserves months
- —
- Total cash needed
- —
Loan-product check · same deal, 3 products live
Conventional
25% down · 7.5% · 30yr
- Down + closing
- —
- Monthly P&I
- —
- Monthly cashflow
- —
- DSCR
- —
- Eligible?
- —
Personal DTI + credit; lowest rate.
DSCR
20% down · 8.5% · 30yr
- Down + closing
- —
- Monthly P&I
- —
- Monthly cashflow
- —
- DSCR
- —
- Eligible?
- —
No personal income docs; deal must DSCR.
Hard money
10% down · 12.0% · 12mo
- Down + closing
- —
- Monthly P&I
- —
- Monthly cashflow
- —
- DSCR
- —
- Eligible?
- —
Short-term bridge; refi at stabilization.
Listing history 22 events
-
2026-06-18days on market $164,900 Active 134 DOM
-
2026-06-17days on market $164,900 Active 133 DOM
-
2026-06-16days on market $164,900 Active 132 DOM
-
2026-06-15days on market $164,900 Active 131 DOM
-
2026-06-15days on market $164,900 Active 130 DOM
-
2026-06-13days on market $164,900 Active 129 DOM
-
2026-06-12days on market $164,900 Active 128 DOM
-
2026-06-09days on market $164,900 Active 125 DOM
-
2026-06-08days on market $164,900 Active 124 DOM
-
2026-06-08days on market $164,900 Active 123 DOM
-
2026-06-07days on market $164,900 Active 122 DOM
-
2026-06-03days on market $164,900 Active 119 DOM
-
2026-06-02days on market $164,900 Active 118 DOM
-
2026-06-01days on market $164,900 Active 117 DOM
-
2026-05-31days on market $164,900 Active 116 DOM
-
2026-04-16price $164,900 311-char remark
Show marketing remark (311 chars)
4 BEDROOM HOME FOR SALE IN THE DESIRABLE HICKORY FLATS AREA OF PENNINGTON GAP VA! Take a look at this beautiful home featuring: 4 bedrooms (optional 5th), 2 bathrooms, living room, kitchen, LVP flooring, metal roof, fenced yard, covered porch, great location, and so much more! Call today to schedule your tour!
-
2026-03-04price $169,900 311-char remark
Show marketing remark (311 chars)
4 BEDROOM HOME FOR SALE IN THE DESIRABLE HICKORY FLATS AREA OF PENNINGTON GAP VA! Take a look at this beautiful home featuring: 4 bedrooms (optional 5th), 2 bathrooms, living room, kitchen, LVP flooring, metal roof, fenced yard, covered porch, great location, and so much more! Call today to schedule your tour!
-
2026-02-04$165,000 Active 311-char remark
Show marketing remark (311 chars)
4 BEDROOM HOME FOR SALE IN THE DESIRABLE HICKORY FLATS AREA OF PENNINGTON GAP VA! Take a look at this beautiful home featuring: 4 bedrooms (optional 5th), 2 bathrooms, living room, kitchen, LVP flooring, metal roof, fenced yard, covered porch, great location, and so much more! Call today to schedule your tour!
-
2025-07-24price $185,000
-
2025-05-02price $189,900
-
2024-04-05price $199,900
-
1997-12-30soldstatus $63,000
ⓘ Source: listings_history table (triggers on properties + properties_extension) + one-shot
backfill from property_details.listing_events for pre-trigger history.
Tax reassessment forecast VA · Resets to sale price
- Current annual tax
- $1,033 · $86/mo
- Projected year-2 tax
- $1,352 · $113/mo
- Expected delta
- +$319/yr (+$27/mo · 30.9%)
ⓘ Screening estimate from a state-policy table — verify with the county assessor before closing.
Climate risk First Street
- Flood 1/10 Low FEMA zone X (unshaded) · 0% chance over 30 yrs
- Wildfire 6/10 Major
- Heat 4/10 Moderate 7 d/yr ≥97°F today · 20 d/yr by 30 yrs out
- Wind 2/10 Low 100% chance of damaging wind over 30 yrs
- Air quality 2/10 Low 1 unhealthy d/yr today · 1 by 30 yrs out
Nearby sold comps map
Loading sold comps map…
Walkable amenities ~0.75 mi
Loading nearby amenities…
Taxation est. · year 1
- Rental income
- $14,530
- − Mortgage interest
- −$9,237
- − Property taxes
- −$1,033
- − Insurance
- −$824
- − Repairs & maintenance
- −$1,162
- − Management
- −$1,162
- − Depreciation
- −$4,797
- Taxable loss
- −$3,686
- Est. tax savings @ 24.0%
- +$885
- After-tax cash flow
- $129/yr
For passive investors: Depreciation is non-cash, so a rental often shows a tax loss while cash-flowing — sheltering income. Rental losses are passive: they offset passive income freely, and up to $25,000/yr can offset ordinary (W-2) income if you actively participate and your MAGI is under $100k (phasing out to $0 by $150k); unused losses carry forward. On sale, claimed depreciation is recaptured at up to 25%, and gains may owe capital-gains tax (a 1031 exchange can defer both). Figures are a year-1 estimate at your 24.0% rate — not tax advice; consult a CPA.
Schools (NCES district)
- District
- Lee County Public School District
- NCES district ID
- 5102190
- Math proficiency
- 53% ▼ -31.00%
- Reading proficiency
- 69% ▼ -9.00%
- Median HH income
- $31,356
- Composite
- 50.06/100
- National rank
- #1913
- State rank
- #62 of 131 in VA
Livability — Pennington Gap
- Score
- 62/100
- State rank
- #410
- US rank
- #17149
Category grades
Schools grade is shown separately in the Schools card above.
Census & demographics
- Population (ZIP)
- 6,379
Population outlook (Lee County) Hauer SSP2
- Today (2025)
- 22,861 people
- By 2030
- 21,701 · -5.1%
- By 2040
- 19,188 · -16.1%
- By 2050
- 16,619 · -27.3%
- By 2075
- 11,795 · -48.4%
- By 2100
- 8,290 · -63.7%
Race, ethnicity, and origin ACS 2023
- Neighborhood character
- Predominantly White (79%)
- Race & ethnicity
- White 79% Black 14% Hispanic / Latino 5% Two or more races 2%
- Common ancestry
- Serbian 1% Slovak 1% Romanian 1%
- Foreign-born
- 4% · Canada
- Languages at home
- 95% English-only · Spanish 4%
Political lean MEDSL · Lee
- 2024 margin
- Solid R (+72.0) · D 13.8% · R 85.8%
- 2008→2024 swing
- -43.8pp toward R · 2008: -28.2pp · 2024: -72.0pp
- All cycles
- 2024: R+72.0 2020: R+69.1 2016: R+63.2 2012: R+44.4 2008: R+28.2
Not yet ingested
- Civics
- —
Market trends
- HPI YoY
- ▲ 5.59%
- Current HPI
- 165.997
- Rent YoY
- —
- Metro
- —
- State GDP YoY
- ▲ 2.40%
- F500 in state
- 50
Industry mix (Fortune 500 HQ in VA)
| Industry | F500 HQs | Revenue |
|---|---|---|
| Aerospace / Defense | 4 | $236B |
|
||
| Technology / Defense | 3 | $32B |
|
||
| Financial Services | 2 | $176B |
|
||
| Utilities | 2 | $27B |
|
||
| Insurance | 2 | $25B |
|
||
| Technology | 2 | $15B |
|
||
Price history
+161.7% since first listed7 events — show timeline
- 2026-04-16 Price Changed $164,900 Knoxville MLS
- 2026-03-04 Price Changed $169,900 Knoxville MLS
- 2026-02-04 Listed $165,000 Knoxville MLS
- 2025-07-24 Price Changed $185,000 TVRMLS
- 2025-05-02 Price Changed $189,900 TVRMLS
- 2024-04-05 Price Changed $199,900 TVRMLS
- 1997-12-30 Sold (Public Records) $63,000 Public Records
Property tax history
+6.8%/yrLatest (2025): $1,033 · +67.8% YoY. Source: county tax records.
Cash-flow waterfall
monthlySold comps — $/sqft
last 12 mo · ≤1 miLoading sold comps…