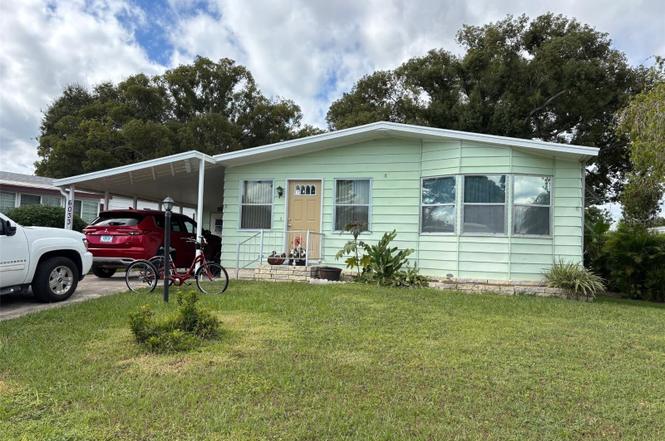
6033 Grand Oaks Dr SE · Winter Haven, FL
Flood risk 1/10 · Minimal
- FEMA flood zone
- X (unshaded)
- Chance of flooding over 30 yrs
- 0.0%
- Est. flood insurance / yr
- $507 – $1,088
Fire risk 4/10 · Minor
- Est. fire insurance / yr
- $947 – $1,759
Heat risk 8/10 · Major
- Hot days now (above 108°F)
- 7 days/yr
- Hot days in 30 yrs
- 23 days/yr
Wind risk 10/10 · Severe
- Chance of severe wind over 30 yrs
- 99.0%
Air-quality risk 1/10 · Minimal
- Unhealthy air days now
- 0 days/yr
- Unhealthy air days in 30 yrs
- 0 days/yr
Risk factors via First Street. Map © Google.
Why this score? — see what drove the C grade
The composite is a weighted blend of 9 inputs, each scored 0–100. Each bar is that input's sub-score; the figure is the points it added to the 100-point composite (weight × sub-score).
- Cash flow +23.7/30.0
- DSCR +7.6/10.0
- ARV discount +7.5/15.0
- 1% rule +6.7/10.0
- Livability +3.7/5.0
- Schools +3.5/10.0
- Rent growth +3.0/5.0
- Condition / age +2.5/5.0
- Appreciation +0.0/10.0
$137,900
🖨 Deal sheet 📄 Offer letter ✓ Due diligence
Listing remarks MLS
Mobile home in active 55+ gated community. This home features 2 bedrooms and 2 bathrooms with open living area with screened lanai. The community offers heated pool, spa, and shuffleboard. Come take a look today!
Key facts
- Wet bar
- Walk-in closet
- Tons of cabinets
Tags
Property features AI
Finance
- Other: Directions to property available
- Financial info: Total monthly fees $65; total annual fees $780; Lease restrictions apply
- HOA & community: Has HOA; monthly association fee $65; Association amenities include clubhouse, pool, spa/hot tub, recreation facilities, shuffleboard court, security, vehicle restrictions and fence restrictions; Association fee covers common area taxes, pool, escrow reserves, private road, recreational facilities and security; Buyer/association approval required; Senior community; Pets allowed (cats and dogs; number limit applies); Association recreation owned; street lights; deed restrictions; special community restrictions
Exterior
- Parking: Driveway and off-street parking; Carport (1 space)
- Security: Smoke detector(s); Community security
- Utilities: Public water; Public sewer; Electricity connected; Sewer connected
- Home design: Manufactured home (double wide); One story; East-facing
- Construction: Metal siding; Membrane roof; Crawlspace foundation; Completed condition
- Exterior features: Covered screened rear porch; Awning(s); Private mailbox; Mature landscaping; Paved and landscaped lot; Private lot; Private maintained asphalt road; Irrigation equipment; Storage structure; Workshop
Interior
- Kitchen: Dishwasher; Microwave; Range; Range hood; Refrigerator; Electric water heater
- Bedrooms: 2 bedrooms
- Flooring: Laminate flooring; Vinyl flooring
- Bathrooms: 2 full bathrooms
- Heating & cooling: Central heating; Electric heat pump; Central air conditioning
- Interior features: Ceiling fans; Walk-in closet(s); Wet bar; Window treatments; Aluminum window frames; Blinds; Storage rooms
- Laundry & utility: Laundry room with washer hookup and electric dryer hookup; Inside utility
Neighborhood map
What this means for you Summary
Snapshot
- This is a 2-bed/2.0-bath manufactured listed at $138k.
Deal economics
- At list price, monthly cash flow is $261 ($3k/yr) — positive.
- The deal already cash-flows at list — no discount required.
- Meets the 1% rule at list price ($2k rent vs $138k).
- Recommended offer: $121k (12.0% below list) — sets the bar for market timing.
Location & tenants
- Location reads 74/100 on livability (#291 in FL, #4,898 nationally) — a middle-class / working-renter tenant base. Strengths: cost of living A+, housing A+, health & safety A; Watch: schools C-, employment C-, amenities F.
- Polk (suburban): math 39% / reading 43% proficiency, ranked #62 of 73 in FL (top 85%) — families likely to look elsewhere, expect single-tenant / working-renter base with shorter leases.
- Market conditions: Rents rising (+1.9%/yr); 680 active listings in the ZIP; 13 comparable units currently listed for rent nearby; rentals at typical pace (median 24d on market — plan ~3-4 weeks tenant-placement turnaround); 10,384 units permitted in Polk County in 2024 (1,716 in 5+ unit buildings).
Forward outlook
- Local home prices are declining (-3.0%/yr); year-one equity from $953 of loan paydown is wiped out by about $4k of value loss. Plan a longer hold.
- Polk County population projected at +33% by 2050 — long-run rental-demand tailwind backs the buy-and-hold thesis.
Negotiation context
- It's been on market 229 days — a 12% lower offer ($121k) is reasonable based on typical stale-listing flexibility.
- 2 sale attempts since 12y ago with the ask held roughly flat each time — persistent listings suggest the price (not the market) is what's stuck; bring a comps-based counter.
- Current owner paid $32k; list at $138k implies a 324% gain — meaningful room to come down on a strong offer.
Risks & watch-outs
- Climate carrying-cost: severe wind risk, 99% chance of damaging wind over 30y; extreme-heat days projected 7→23/yr by 2055 (HVAC capex compounding) — expect insurance premiums to compound above CPI over the hold.
Questions for the listing agent
- It's been on market 229 days. Have you received any prior offers? Is the seller open to a 12% concession, seller financing, or rate buy-down credit?
- What does the HOA fee cover, when was the last increase, and are there any pending special assessments or reserve-fund shortfalls?
- Why hasn't it sold? Are there any deal-killer items the seller is aware of (foundation, flood, title, zoning, code violations)?
- Is there a deadline driving the sale (1031 exchange, divorce, estate, relocation)? That informs how much negotiation room exists.
- What's the average days-on-market for RENTAL listings here right now (not sales)? A rising rental-DOM trend means longer vacancies and softer asking-rent achievability than the comps imply.
- What's the recent tenant-quality profile in this submarket — average credit score on applications, eviction rate, late-payment / NSF rate, and stable-employment percentage? A property-management company in the area should have these aggregated.
- How much new for-sale + rental construction is in the pipeline within 1–3 miles? Heavy new supply typically softens prices + rents 12–24 months out; constrained supply supports both.
Investment metrics
- 1% rule
- 1.17% ✓
- Cap rate
- 8.57%
- Cash-on-cash
- 8.13%
- DSCR
- 1.36
- GRM
- 7.1
CMA / ARV
No comps found within radius.
Projected returns pro-forma
-3.0% appreciation · 1.9% rent growth · sell at horizon
- IRR
- -5.2%
- Equity multiple
- 0.81×
- Total profit
- $-7,395
- Equity at exit
- $20,561
- IRR
- 3.1%
- Equity multiple
- 1.21×
- Total profit
- $8,175
- Equity at exit
- $11,923
Cash invested: $38,612 (down + closing). Projections, not guarantees.
Landlord ↔ Tenant lean methodology
- Overall (STATE)
- 87 Strongly Landlord-Friendly
- State Florida
- 87 Strongly Landlord-Friendly · R+3
- County
- — inherits STATE
- City
- — inherits STATE
ZIP-level market 33884
- Home prices YoY
- -34.1%
- Rents YoY
- 1.9%
- Active inventory
- 680
- Price-to-rent
- 7.1×
Monthly cashflow live
- Estimated rent
- $1,609 high interval (Pro) →
- Mortgage (P&I)
- −$723
- Tax from tax record
- −$164 /mo · $1,968/yr
- Insurance
- −$57
- HOA
- −$65
- Vacancy / Maint / Mgmt
- −$338
- Net cashflow
- $261
Break-even live
UW: 25.0% down · 7.5% · 30yr · 1.5% tax · 5.0% vac · 8.0% maint · 8.0% mgmt
Financing live
Cash to close
- Down payment
- $34,475
- Closing costs
- $4,137
- Reserves months
- —
- Total cash needed
- —
Loan-product check · same deal, 3 products live
Conventional
25% down · 7.5% · 30yr
- Down + closing
- —
- Monthly P&I
- —
- Monthly cashflow
- —
- DSCR
- —
- Eligible?
- —
Personal DTI + credit; lowest rate.
DSCR
20% down · 8.5% · 30yr
- Down + closing
- —
- Monthly P&I
- —
- Monthly cashflow
- —
- DSCR
- —
- Eligible?
- —
No personal income docs; deal must DSCR.
Hard money
10% down · 12.0% · 12mo
- Down + closing
- —
- Monthly P&I
- —
- Monthly cashflow
- —
- DSCR
- —
- Eligible?
- —
Short-term bridge; refi at stabilization.
Rent comps 13 comps
| Address | Beds | Baths | Sqft | Rent | $/sqft | DOM | Units | Dist |
|---|---|---|---|---|---|---|---|---|
| 5667 Struthers Ct Winter Haven, FL | 2.0 | 1.0 | 775 | $1,350 | $1.74 | 23d | 1 | 0.32mi |
| 5665 Struthers Ct Unit 5667 Winter Haven, FL | 2.0 | 1.0 | 775 | $1,350 | $1.74 | 23d | 1 | 0.32mi |
| 5657 Struthers Ct Unit 1 Winter Haven, FL | 2.0 | 1.0 | 800 | $1,475 | $1.84 | 14d | 1 | 0.33mi |
| 5657 Struthers Ct Winter Haven, FL | 2.0 | 1.0 | 780 | $1,475 | $1.89 | 10d | 1 | 0.33mi |
| 5608 Lake Fox Cir Winter Haven, FL | 3.0 | 2.0 | 1490 | $2,400 | $1.61 | 23d | 1 | 0.73mi |
| 1015 Lake Forest Blvd Winter Haven, FL | 1.0–3.0 | 1.0–2.0 | 929 | $1,840 | $1.98 | 2d | 24 | 1.07mi |
| 4025 Lake Ned Village Cir Winter Haven, FL | 1.0–3.0 | 1.0–2.0 | 1025 | $1,530 | $1.49 | 3d | 8 | 1.20mi |
| 1707 Eagle Pond Dr Unit 1707 Winter Haven, FL | 2.0 | 2.0 | 1017 | $1,450 | $1.43 | 23d | 1 | 1.28mi |
| 508 Eagle Pond Dr #508 Winter Haven, FL | 2.0 | 2.0 | 1017 | $1,500 | $1.47 | 23d | 1 | 1.32mi |
| 1202 Eagle Pond Dr Unit 1202 Winter Haven, FL | 2.0 | 2.0 | 1017 | $1,450 | $1.43 | 14d | 1 | 1.32mi |
| 1101 Eagle Pond Dr #1101 Winter Haven, FL | 2.0 | 2.0 | 1017 | $1,400 | $1.38 | 23d | 1 | 1.35mi |
| 7676 Carlton Arms Blvd Winter Haven, FL | 3.0 | 1.0–2.5 | 987 | $1,508 | $1.53 | 23d | 1 | 1.44mi |
| 408 Lake Ned Rd Winter Haven, FL | 3.0 | 2.0 | 1470 | $2,100 | $1.43 | 23d | 1 | 1.46mi |
HOA detail
- Monthly dues
- $65 · $780/yr
- Likely covers
- poolsecurity
Listing history 17 events
-
2026-06-18days on market $137,900 Active 229 DOM
-
2026-06-17days on market $137,900 Active 228 DOM
-
2026-06-16days on market $137,900 Active 227 DOM
-
2026-06-15days on market $137,900 Active 226 DOM
-
2026-06-13days on market $137,900 Active 224 DOM
-
2026-06-10days on market $137,900 Active 221 DOM
-
2026-06-09days on market $137,900 Active 220 DOM
-
2026-06-08days on market $137,900 Active 219 DOM
-
2026-06-07days on market $137,900 Active 218 DOM
-
2026-06-05days on market $137,900 Active 215 DOM
-
2026-06-03days on market $137,900 Active 213 DOM
-
2026-06-01days on market $137,900 Active 212 DOM
-
2026-05-31days on market $137,900 Active 211 DOM
-
2026-04-15price $137,900
-
2025-11-02$140,000 Active
-
2014-03-20soldstatus $32,500 Sold 212-char remark
Show marketing remark (212 chars)
Mobile home in active 55+ gated community. This home features 2 bedrooms and 2 bathrooms with open living area with screened lanai. The community offers heated pool, spa, and shuffleboard. Come take a look today!
-
2014-02-12$33,900 212-char remark
Show marketing remark (212 chars)
Mobile home in active 55+ gated community. This home features 2 bedrooms and 2 bathrooms with open living area with screened lanai. The community offers heated pool, spa, and shuffleboard. Come take a look today!
ⓘ Source: listings_history table (triggers on properties + properties_extension) + one-shot
backfill from property_details.listing_events for pre-trigger history.
Tax reassessment forecast FL · Resets to sale price
- Current annual tax
- $1,968 · $164/mo
- Projected year-2 tax
- $1,968 · $164/mo
- Expected delta
- $0/yr ($0/mo · 0.0%)
ⓘ Screening estimate from a state-policy table — verify with the county assessor before closing.
Climate risk First Street
- Flood 1/10 Low FEMA zone X (unshaded) · 0% chance over 30 yrs
- Wildfire 4/10 Moderate
- Heat 8/10 Severe 7 d/yr ≥108°F today · 23 d/yr by 30 yrs out
- Wind 10/10 Extreme 99% chance of damaging wind over 30 yrs
- Air quality 1/10 Low 0 unhealthy d/yr today · 0 by 30 yrs out
Nearby sold comps map
Loading sold comps map…
Walkable amenities ~0.75 mi
Loading nearby amenities…
Taxation est. · year 1
- Rental income
- $19,307
- − Mortgage interest
- −$7,725
- − Property taxes
- −$1,968
- − Insurance
- −$690
- − Repairs & maintenance
- −$1,545
- − Management
- −$1,545
- − HOA
- −$780
- − Depreciation
- −$4,012
- Taxable income
- $1,045
- Est. tax owed @ 24.0%
- −$251
- After-tax cash flow
- $2,887/yr
For passive investors: Depreciation is non-cash, so a rental often shows a tax loss while cash-flowing — sheltering income. Rental losses are passive: they offset passive income freely, and up to $25,000/yr can offset ordinary (W-2) income if you actively participate and your MAGI is under $100k (phasing out to $0 by $150k); unused losses carry forward. On sale, claimed depreciation is recaptured at up to 25%, and gains may owe capital-gains tax (a 1031 exchange can defer both). Figures are a year-1 estimate at your 24.0% rate — not tax advice; consult a CPA.
Schools (NCES district)
- District
- Polk
- NCES district ID
- 1201590
- Math proficiency
- 39% ▼ -11.00%
- Reading proficiency
- 43% ▼ -4.00%
- Median HH income
- $43,979
- Composite
- 34.74/100
- National rank
- #5132
- State rank
- #62 of 73 in FL
Livability — Winter Haven
- Score
- 74/100
- State rank
- #291
- US rank
- #4898
Category grades
Schools grade is shown separately in the Schools card above.
Census & demographics
- County
- Polk County · 740,051 people
- City population
- 121,740
- Metro
- Lakeland-Winter Haven, FL
- Population (ZIP)
- 37,561
- Household income
- $70,443
- Rent vs Own
- Severe rent burden
- 949.0
Population outlook (Polk County) Hauer SSP2
- Today (2025)
- 752,975 people
- By 2030
- 804,621 · +6.9%
- By 2040
- 906,117 · +20.3%
- By 2050
- 1,000,476 · +32.9%
- By 2075
- 1,197,520 · +59.0%
- By 2100
- 1,271,518 · +68.9%
Race, ethnicity, and origin ACS 2023
- Neighborhood character
- Diverse neighborhood (Simpson 0.55)
- Race & ethnicity
- White 63% Hispanic / Latino 19% Black 14% Two or more races 7% Asian 2%
- Hispanic origin (detail)
- Mexican 2% Puerto Rican 10% Cuban 2%
- Common ancestry
- Romanian 2% Lithuanian 2% Hispanic 2%
- Foreign-born
- 7% · Canada, Jamaica
- Languages at home
- 84% English-only · Spanish 12% French/Haitian/Cajun 1% Other Indo-European 1%
Political lean MEDSL · Polk
- 2024 margin
- Strong R (+20.7) · D 39.2% · R 59.9%
- 2008→2024 swing
- -14.6pp toward R · 2008: -6.1pp · 2024: -20.7pp
- All cycles
- 2024: R+20.7 2020: R+14.4 2016: R+14.1 2012: R+6.8 2008: R+6.1
Not yet ingested
- Civics
- —
Market trends
- HPI YoY
- ▼ -134.69%
- Current HPI
- 260.1421
- Rent YoY
- ▲ 1.90%
- Metro
- Lakeland-Winter Haven, FL
- State GDP YoY
- ▲ 3.28%
- F500 in state
- 36
Industry mix (Fortune 500 HQ in FL)
| Industry | F500 HQs | Revenue |
|---|---|---|
| Industrial Technology | 2 | $29B |
|
||
| Insurance | 2 | $17B |
|
||
| Retail | 1 | $60B |
|
||
| Technology Distribution | 1 | $58B |
|
||
| Homebuilding | 1 | $35B |
|
||
| Technology Manufacturing | 1 | $35B |
|
||
Price history
+306.8% since first listed4 events — show timeline
- 2026-04-15 Price Changed $137,900 Stellar MLS as Distributed by MLS Grid
- 2025-11-02 Listed $140,000 Stellar MLS as Distributed by MLS Grid
- 2014-03-20 Sold (MLS) $32,500 Stellar MLS as Distributed by MLS Grid
- 2014-02-12 Listed $33,900 Stellar MLS as Distributed by MLS Grid
Property tax history
+19.9%/yrLatest (2025): $1,968 · +10.3% YoY. Source: county tax records.
Cash-flow waterfall
monthlySold comps — $/sqft
last 12 mo · ≤1 miLoading sold comps…