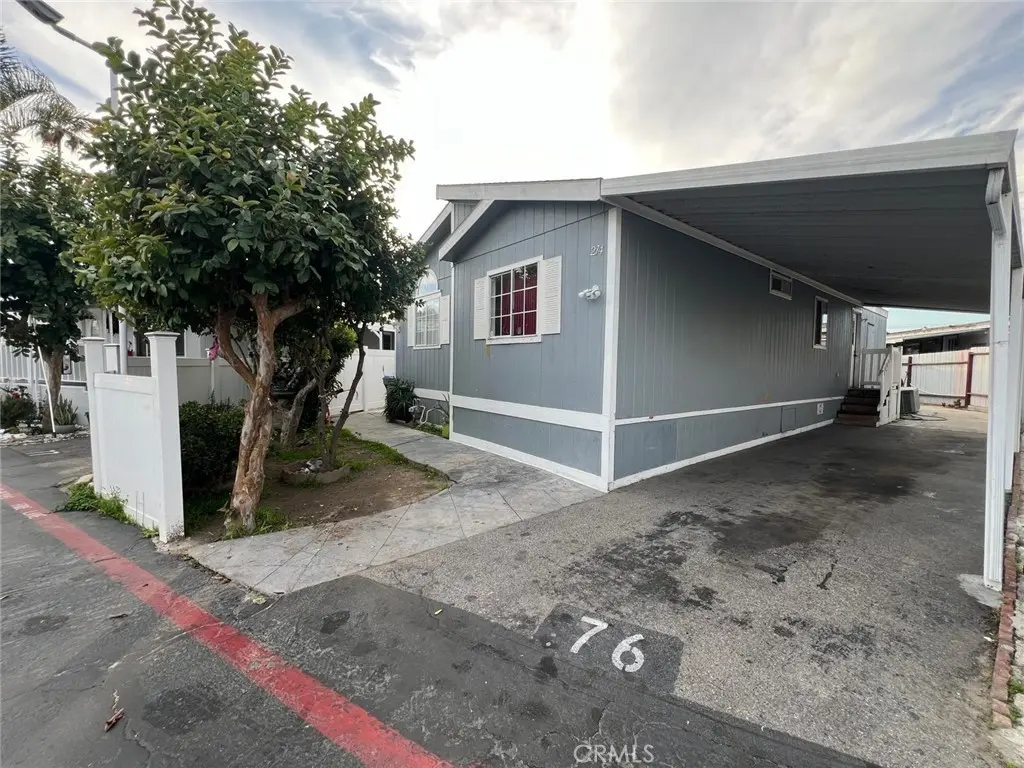
214 Earl Ln #76 · Santa Ana, CA
Flood risk 3/10 · Minor
- FEMA flood zone
- X
- Chance of flooding over 30 yrs
- 0.07%
- Est. flood insurance / yr
- $507 – $1,088
Fire risk 1/10 · Minimal
- Est. fire insurance / yr
- $659 – $1,223
Heat risk 5/10 · Moderate
- Hot days now (above 89°F)
- 7 days/yr
- Hot days in 30 yrs
- 23 days/yr
Wind risk 1/10 · Minimal
- Chance of severe wind over 30 yrs
- —
Air-quality risk 4/10 · Minor
- Unhealthy air days now
- 5 days/yr
- Unhealthy air days in 30 yrs
- 5 days/yr
Risk factors via First Street. Map © Google.
Why this score? — see what drove the B- grade
The composite is a weighted blend of 9 inputs, each scored 0–100. Each bar is that input's sub-score; the figure is the points it added to the 100-point composite (weight × sub-score).
- Cash flow +30.0/30.0
- 1% rule +10.0/10.0
- DSCR +10.0/10.0
- ARV discount +9.1/15.0
- Rent growth +3.0/5.0
- Livability +2.8/5.0
- Schools +2.7/10.0
- Condition / age +2.2/5.0
- Appreciation +0.0/10.0
$159,000
🖨 Deal sheet 📄 Offer letter ✓ Due diligence
Listing remarks MLS
Mobile Home Located in the lovely Coach Royal Park, an all-age mobile home community, this home features 3 bedrooms and 2 bathrooms. It sits on a good-sized lot with a privacy fence. The community offers great amenities, including a clubhouse/event room, pool and spa, and a children’s playground.
Key facts
- Privacy fence
- Clubhouse event room
- Pool and spa
Tags
Neighborhood map
What this means for you Summary
Snapshot
- This is a 3-bed/2.0-bath manufactured listed at $159k. Condition is rated fair.
Deal economics
- At list price, monthly cash flow is $2k ($19k/yr) — positive.
- The deal already cash-flows at list — no discount required.
- Meets the 1% rule at list price ($3k rent vs $159k).
- Recommended offer: $140k (12.0% below list) — sets the bar for market timing.
- Cap rate 17.9% vs local median 2.5% in Santa Ana — top-decile yield for the area; either an underpriced asset or a hidden risk that comps aren't pricing in. Stress-test before assuming the spread holds.
Location & tenants
- Location reads 55/100 on livability (#871 in CA) — a working-class tenant base; expect higher turnover. Strengths: employment A; Watch: schools D, crime D-, amenities F.
- Santa Ana Unified (urban): math 23% / reading 37% proficiency, ranked #329 of 517 in CA (top 64%) — families likely to look elsewhere, expect single-tenant / working-renter base with shorter leases; 83% free/reduced lunch — lower-income household profile, screen leases tightly.
- Market conditions: Rents rising (+2.2%/yr); 80 active listings in the ZIP; 19 comparable units currently listed for rent nearby; rentals at typical pace (median 22d on market — plan ~3-4 weeks tenant-placement turnaround); 42% of comp listings sitting > 30 days — soft ceiling on asking rent; solid renter incomes; 6,974 units permitted in Orange County in 2024 (3,839 in 5+ unit buildings).
- This rent runs 40% of the median local income ($100k/yr) — at the standard rent-burdened threshold; future hikes will face affordability resistance.
Forward outlook
- Local home prices are declining (-3.0%/yr); year-one equity from $1k of loan paydown is wiped out by about $5k of value loss. Plan a longer hold.
- Orange County population projected at +14% by 2050 — modest demand growth; plan on rents tracking national, not racing it.
- At projected returns (-3.0% appreciation + 2.2% rent growth), your $45k cash investment doubles in ~3 years — after that, you're playing with house money.
Negotiation context
- It's been on market 189 days — a 12% lower offer ($140k) is reasonable based on typical stale-listing flexibility.
- 3 sale attempts since 3y ago; this cycle's ask has dropped $16k (9%) from the opening price — seller is motivated, your offer sets the floor, not the list.
Risks & watch-outs
- Climate carrying-cost: extreme-heat days projected 7→23/yr by 2055 (HVAC capex compounding) — expect insurance premiums to compound above CPI over the hold.
Questions for the listing agent
- It's been on market 189 days. Have you received any prior offers? Is the seller open to a 12% concession, seller financing, or rate buy-down credit?
- Have any recent inspections been done? Can we get a copy of the seller's disclosures and any deferred-maintenance estimates?
- Why hasn't it sold? Are there any deal-killer items the seller is aware of (foundation, flood, title, zoning, code violations)?
- Is there a deadline driving the sale (1031 exchange, divorce, estate, relocation)? That informs how much negotiation room exists.
- Schools are D-rated, which usually means shorter tenancies and higher turnover. Who's the typical renter profile here, and what's been the actual vacancy rate?
- Crime grade is D in this area — have there been break-ins, vandalism, or insurance claims at this property in the last 3 years? What carrier currently insures it and at what premium?
- What's the average days-on-market for RENTAL listings here right now (not sales)? A rising rental-DOM trend means longer vacancies and softer asking-rent achievability than the comps imply.
- What's the recent tenant-quality profile in this submarket — average credit score on applications, eviction rate, late-payment / NSF rate, and stable-employment percentage? A property-management company in the area should have these aggregated.
- How much new for-sale + rental construction is in the pipeline within 1–3 miles? Heavy new supply typically softens prices + rents 12–24 months out; constrained supply supports both.
Investment metrics
- 1% rule
- 2.10% ✓
- Cap rate
- 17.94%
- Cash-on-cash
- 41.60%
- DSCR
- 2.85
- GRM
- 4.0
CMA / ARV
- ARV (median comp)
- $165,000
- List price
- $159,000
- Delta
- -3.64%
- Verdict
- FAIR
- Comps
- 7 within 1.0 mi
Show comp detail 4 sales within ~0.75 mi
| Address | Dist | Beds/Ba | Sqft | Sold | Price | $/sf | Match |
|---|---|---|---|---|---|---|---|
| 302 Castle Ln | 0.09mi | 2/2.0 (-1) | 1,382 (-1%) | 17mo | $102,500 | $74 | 74 |
| 206 S Sullivan St #87 | 0.20mi | 4/2.0 (+1) | 1,450 (+4%) | 22mo | $274,000 | $189 | 61 |
| 1 Vienna Dr #64 | 0.40mi | 3/2.0 | 1,440 (+3%) | 19mo | $175,000 | $122 | 61 |
| 214 Sequoia Way | 0.53mi | 3/2.0 | 1,310 (-6%) | 19mo | $180,000 | $137 | 49 |
Match score weights: distance 35% · size 25% · config 20% · recency 20%. Top-matched comps best support the ARV.
Projected returns pro-forma
-3.0% appreciation · 2.16% rent growth · sell at horizon
- IRR
- 37.3%
- Equity multiple
- 2.57×
- Total profit
- $69,777
- Equity at exit
- $23,707
- IRR
- 43.4%
- Equity multiple
- 4.96×
- Total profit
- $176,226
- Equity at exit
- $13,747
Cash invested: $44,520 (down + closing). Projections, not guarantees.
Landlord ↔ Tenant lean methodology
- Overall (STATE)
- 18 Strongly Tenant-Friendly
- State California
- 18 Strongly Tenant-Friendly · D+13
- County
- — inherits STATE
- City
- — inherits STATE
ZIP-level market 92704
- Rents YoY
- 2.2%
- Active inventory
- 80
- Price-to-rent
- 4.0×
Monthly cashflow live
- Estimated rent
- $3,344 high interval (Pro) →
- Mortgage (P&I)
- −$834
- Tax est. 1.5%
- −$199 /mo · $2,385/yr
- Insurance
- −$66
- HOA
- −$0
- Vacancy / Maint / Mgmt
- −$702
- Net cashflow
- $1,543
Break-even live
UW: 25.0% down · 7.5% · 30yr · 1.5% tax · 5.0% vac · 8.0% maint · 8.0% mgmt
Financing live
Cash to close
- Down payment
- $39,750
- Closing costs
- $4,770
- Reserves months
- —
- Total cash needed
- —
Loan-product check · same deal, 3 products live
Conventional
25% down · 7.5% · 30yr
- Down + closing
- —
- Monthly P&I
- —
- Monthly cashflow
- —
- DSCR
- —
- Eligible?
- —
Personal DTI + credit; lowest rate.
DSCR
20% down · 8.5% · 30yr
- Down + closing
- —
- Monthly P&I
- —
- Monthly cashflow
- —
- DSCR
- —
- Eligible?
- —
No personal income docs; deal must DSCR.
Hard money
10% down · 12.0% · 12mo
- Down + closing
- —
- Monthly P&I
- —
- Monthly cashflow
- —
- DSCR
- —
- Eligible?
- —
Short-term bridge; refi at stabilization.
Rent comps 19 comps
| Address | Beds | Baths | Sqft | Rent | $/sqft | DOM | Units | Dist |
|---|---|---|---|---|---|---|---|---|
| 1570 W 1st St #15 Santa Ana, CA | 3.0 | 3.0 | 1513 | $3,850 | $2.54 | 12d | 1 | 0.67mi |
| 1520 W 1st St Santa Ana, CA | 3.0 | 3.0 | 1513 | $3,600 | $2.38 | 43d | 1 | 0.70mi |
| 3200 W 5th St Santa Ana, CA | 1.0–2.0 | 1.0–2.0 | 769 | $2,795 | $3.63 | 2d | 9 | 0.70mi |
| 308 S Laurel St Unit C Santa Ana, CA | 2.0 | 1.0 | 950 | $2,650 | $2.79 | 43d | 1 | 0.81mi |
| 1330 W 10th St Unit 2 Santa Ana, CA | 3.0 | 2.0 | 993 | $3,700 | $3.73 | 12d | 1 | 1.08mi |
| 1610 N King St Santa Ana, CA | 1.0–2.0 | 1.0–2.0 | 808 | $2,400 | $2.97 | 43d | 1 | 1.14mi |
| 1114 W Santa Ana Blvd Santa Ana, CA | 2.0 | 2.0 | 725 | $2,700 | $3.72 | 43d | 4 | 1.16mi |
| 1123 Highland St Unit A Santa Ana, CA | 4.0 | 2.0 | 1600 | $4,200 | $2.62 | 21d | 1 | 1.16mi |
| 1410 W Washington Ave Santa Ana, CA | 4.0 | 3.0 | 1721 | $1,100 | $0.64 | 19d | 1 | 1.18mi |
| 3900 W 5th St Santa Ana, CA | 1.0–2.0 | 1.0–2.0 | 780 | $2,175 | $2.79 | 13d | 1 | 1.25mi |
| 2513 W Occidental St Santa Ana, CA | 2.0 | 2.0 | 980 | $3,495 | $3.57 | 7d | 1 | 1.29mi |
| 924 W Chestnut Ave Santa Ana, CA | 2.0 | 1.0 | 1554 | $2,400 | $1.54 | 43d | 1 | 1.35mi |
| 4109 W 5th St Unit C3 Santa Ana, CA | 2.0 | 2.0 | 921 | $2,500 | $2.71 | 21d | 1 | 1.39mi |
| 4109 W 5th St Unit C3 Santa Ana, CA | 2.0 | 2.0 | 921 | $2,900 | $3.15 | 43d | 1 | 1.39mi |
| 4200 W 1st St Santa Ana, CA | 1.0–2.0 | 1.0–2.0 | 714 | $2,997 | $4.19 | 1d | 4 | 1.42mi |
| 4201 W 5th St Santa Ana, CA | 2.0 | 1.0 | 921 | $2,800 | $3.04 | 7d | 1 | 1.44mi |
| 909 S Elliott Pl Santa Ana, CA | 4.0 | 2.0 | 1351 | $4,700 | $3.48 | 43d | 1 | 1.45mi |
| 3630 Westminster Ave Santa Ana, CA | 2.0 | 2.0 | 997 | $2,758 | $2.77 | 43d | 1 | 1.49mi |
| 1314 N Harbor Blvd Santa Ana, CA | 2.0 | 2.0 | 884 | $2,742 | $3.10 | 13d | 4 | 1.49mi |
Listing history 20 events
-
2026-06-18days on market $159,000 Active 189 DOM
-
2026-06-17days on market $159,000 Active 188 DOM
-
2026-06-16days on market $159,000 Active 187 DOM
-
2026-06-15days on market $159,000 Active 186 DOM
-
2026-06-13days on market $159,000 Active 184 DOM
-
2026-06-13days on market $159,000 Active 183 DOM
-
2026-06-09days on market $159,000 Active 180 DOM
-
2026-06-08days on market $159,000 Active 179 DOM
-
2026-06-07days on market $159,000 Active 178 DOM
-
2026-06-04days on market $159,000 Active 175 DOM
-
2026-06-03days on market $159,000 Active 174 DOM
-
2026-06-02days on market $159,000 Active 173 DOM
-
2026-06-01days on market $159,000 Active 172 DOM
-
2026-05-31days on market $159,000 Active 171 DOM
-
2026-03-02price $159,000 303-char remark
Show marketing remark (303 chars)
Mobile Home Located in the lovely Coach Royal Park, an all-age mobile home community, this home features 3 bedrooms and 2 bathrooms. It sits on a good-sized lot with a privacy fence. The community offers great amenities, including a clubhouse/event room, pool and spa, and a children’s playground.
-
2026-01-27price $169,000 303-char remark
Show marketing remark (303 chars)
Mobile Home Located in the lovely Coach Royal Park, an all-age mobile home community, this home features 3 bedrooms and 2 bathrooms. It sits on a good-sized lot with a privacy fence. The community offers great amenities, including a clubhouse/event room, pool and spa, and a children’s playground.
-
2025-12-11$175,000 Active 303-char remark
Show marketing remark (303 chars)
Mobile Home Located in the lovely Coach Royal Park, an all-age mobile home community, this home features 3 bedrooms and 2 bathrooms. It sits on a good-sized lot with a privacy fence. The community offers great amenities, including a clubhouse/event room, pool and spa, and a children’s playground.
-
2023-10-13historical
-
2023-07-02status Active
-
2023-04-16$180,000 Active
ⓘ Source: listings_history table (triggers on properties + properties_extension) + one-shot
backfill from property_details.listing_events for pre-trigger history.
Climate risk First Street
- Flood 3/10 Moderate FEMA zone X · 7% chance over 30 yrs
- Wildfire 1/10 Low
- Heat 5/10 Major 7 d/yr ≥89°F today · 23 d/yr by 30 yrs out
- Wind 1/10 Low
- Air quality 4/10 Moderate 5 unhealthy d/yr today · 5 by 30 yrs out
Nearby sold comps map
Loading sold comps map…
Walkable amenities ~0.75 mi
Loading nearby amenities…
Taxation est. · year 1
- Rental income
- $40,134
- − Mortgage interest
- −$8,906
- − Property taxes
- −$2,385
- − Insurance
- −$795
- − Repairs & maintenance
- −$3,211
- − Management
- −$3,211
- − Depreciation
- −$4,625
- Taxable income
- $17,000
- Est. tax owed @ 24.0%
- −$4,080
- After-tax cash flow
- $14,440/yr
For passive investors: Depreciation is non-cash, so a rental often shows a tax loss while cash-flowing — sheltering income. Rental losses are passive: they offset passive income freely, and up to $25,000/yr can offset ordinary (W-2) income if you actively participate and your MAGI is under $100k (phasing out to $0 by $150k); unused losses carry forward. On sale, claimed depreciation is recaptured at up to 25%, and gains may owe capital-gains tax (a 1031 exchange can defer both). Figures are a year-1 estimate at your 24.0% rate — not tax advice; consult a CPA.
Condition & rehab AI · 12 photos
This mobile home requires moderate repairs and maintenance, including painting, flooring, and kitchen appliances, to improve its condition and value.
Repairs flagged
- Minor Paint — Light discoloration
- Moderate Flooring — Worn and needs replacement
- Moderate Kitchen appliances — Older and may need replacement
Value-add opportunities
- Both Paint — Enhances curb appeal and interior
- Both Flooring — Improves living experience and resale value
- Both Kitchen appliances — Modernizes the space and attracts buyers
Renovation cost estimate screening
| Repair item | Severity | Est. cost |
|---|---|---|
| Paint · Light discoloration | Minor | $500–3,000 |
| Flooring · Worn and needs replacement | Moderate | $3,000–15,000 |
| Kitchen appliances · Older and may need replacement | Moderate | $3,000–15,000 |
| Total estimated repair cost · 3 items | $6,500–33,000 |
Value-add ROI direction
- Both Paint — Enhances curb appeal and interior ↑
- Both Flooring — Improves living experience and resale value ↑
- Both Kitchen appliances — Modernizes the space and attracts buyers ↑
ⓘ Cost ranges are severity-bucket heuristics (US national rule-of-thumb). Get contractor quotes + a written scope before underwriting a rehab budget.
Schools (NCES district)
- District
- Santa Ana Unified
- NCES district ID
- 0635310
- Math proficiency
- 23% ▼ -2.00%
- Reading proficiency
- 37% ▲ 5.00%
- Median HH income
- $55,752
- Composite
- 26.7/100
- National rank
- #7152
- State rank
- #329 of 517 in CA
Livability — Santa Ana
- Score
- 55/100
- State rank
- #871
- US rank
- #23502
Category grades
Schools grade is shown separately in the Schools card above.
Census & demographics
- Census place
- Santa Ana, CA
- County
- Orange County · 3,096,323 people
- City population
- 288,255
- Metro
- Los Angeles-Long Beach-Anaheim, CA
- Population (ZIP)
- 82,120
- Household income
- $99,777
- Rent vs Own
- Severe rent burden
- 2188.0
Population outlook (Orange County) Hauer SSP2
- Today (2025)
- 3,477,456 people
- By 2030
- 3,613,117 · +3.9%
- By 2040
- 3,835,945 · +10.3%
- By 2050
- 3,968,736 · +14.1%
- By 2075
- 4,097,053 · +17.8%
- By 2100
- 3,903,633 · +12.3%
Race, ethnicity, and origin ACS 2023
- Neighborhood character
- Predominantly Hispanic (71%)
- Race & ethnicity
- Hispanic / Latino 71% Asian 18% Two or more races 17% White 9% Native American 2%
- Hispanic origin (detail)
- Mexican 65%
- Common ancestry
- Italian 1%
- Foreign-born
- 44% · Canada, Vietnam, China
- Languages at home
- 22% English-only · Spanish 61% Vietnamese 13% Other Asian/Pacific 2%
Political lean MEDSL · Orange
- 2024 margin
- Toss-up / Even · D 49.7% · R 47.1% · Other 3.2%
- 2008→2024 swing
- +5.2pp toward D · 2008: -2.6pp · 2024: 2.6pp
- All cycles
- 2024: D+2.6 2020: D+9.0 2016: D+7.7 2012: R+8.3 2008: R+2.6
Not yet ingested
- Civics
- —
Market trends
- HPI YoY
- ▼ -991.35%
- Current HPI
- 449.8874
- Rent YoY
- ▲ 2.16%
- Metro
- Los Angeles-Long Beach-Anaheim, CA
- State GDP YoY
- ▲ 3.21%
- F500 in state
- 116
Industry mix (Fortune 500 HQ in CA)
| Industry | F500 HQs | Revenue |
|---|---|---|
| Technology | 27 | $1,492B |
|
||
| Financial Services | 3 | $174B |
|
||
| Retail | 3 | $44B |
|
||
| Insurance | 3 | $26B |
|
||
| Media / Entertainment | 2 | $115B |
|
||
| Pharmaceuticals / Biotech | 2 | $62B |
|
||
Price history
-11.7% since first listed6 events — show timeline
- 2026-03-02 Price Changed $159,000 CRMLS
- 2026-01-27 Price Changed $169,000 CRMLS
- 2025-12-11 Listed $175,000 CRMLS
- 2023-10-13 Listing Removed — CRMLS
- 2023-07-02 Relisted — CRMLS
- 2023-04-16 Listed $180,000 CRMLS
Cash-flow waterfall
monthlySold comps — $/sqft
last 12 mo · ≤1 miLoading sold comps…