 5-Plex
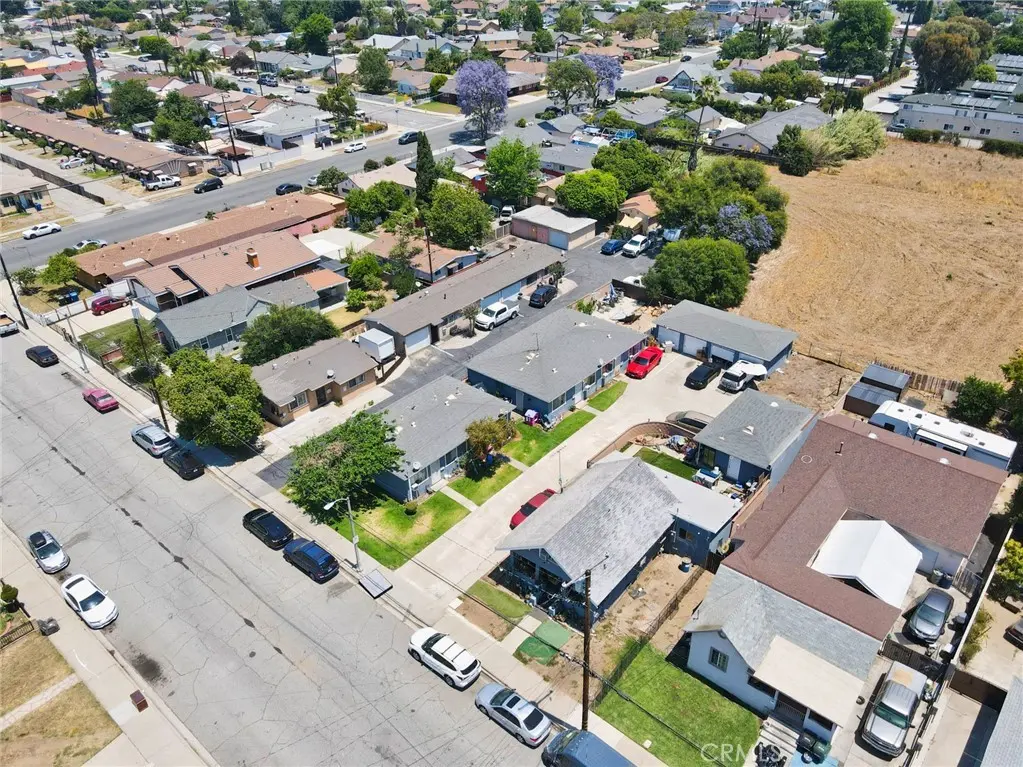
610 Fillmore · Pomona, CA
Flood risk 2/10 · Minimal
- FEMA flood zone
- X (unshaded)
- Chance of flooding over 30 yrs
- 0.09%
- Est. flood insurance / yr
- $507 – $1,088
Fire risk 3/10 · Minor
- Est. fire insurance / yr
- $659 – $1,223
Heat risk 7/10 · Major
- Hot days now (above 99°F)
- 7 days/yr
- Hot days in 30 yrs
- 20 days/yr
Wind risk 1/10 · Minimal
- Chance of severe wind over 30 yrs
- —
Air-quality risk 8/10 · Major
- Unhealthy air days now
- 17 days/yr
- Unhealthy air days in 30 yrs
- 21 days/yr
Risk factors via First Street. Map © Google.
Why this score? — see what drove the F grade
The composite is a weighted blend of 9 inputs, each scored 0–100. Each bar is that input's sub-score; the figure is the points it added to the 100-point composite (weight × sub-score).
- ARV discount +7.5/15.0
- Cash flow +5.6/30.0
- Livability +2.9/5.0
- Rent growth +2.5/5.0
- Condition / age +2.5/5.0
- Schools +2.0/10.0
- 1% rule +0.3/10.0
- DSCR +0.0/10.0
- Appreciation +0.0/10.0
$1,690,000
🖨 Deal sheet 📄 Offer letter ✓ Due diligence
Multi-family units
County records classify this as Multi-Family (5+ Unit). Listing-text estimate: 5 units. confirmed
5+ unit building — per-unit beds/baths from public records are typically unavailable; the breakdown below (if shown) is an estimate from the listing text.
Listing remarks MLS
Take advantage of this great 5-unit Commercial investment opportunity! This amazing property has 3 separate living structures with a unit mix of 1 - 3 bed, 1 bath, 2 - 2 bed, 1 bath, and 2 - 1 bed, 1 bath! Each unit has its own garage and washer and dryer hook ups! There is a total of 4 1-car garages and 1 2-car garage for the 3 bedroom unit. The 3 bedroom unit also has it’s own backyard area! There is a long wide driveway going down the middle of the property with an open parking area in the rear giving ample parking for each unit. A majority of the units have been updated with simulated wood porcelain tile floors, countertops, and bathroom tile. There are many amenities nearby including easy freeway access to the 10 & 71 Freeways and close proximity to the Pomona Metro Station and you are just minutes from Downtown Pomona! You are also close to Cal Poly Pomona, The Pomona Fair plex, & the Brackett Field Airport!
Key facts
- Individually metered
- 3 detached buildings
- Private yard
Tags
Property features AI
Finance
- Other: Rent control applies
- Financial info: Gross scheduled income: $115,572; Total actual rent (current): $9,631 per month; Net operating income: $78,301; Operating expenses: $37,271 (includes insurance $5,200; water/sewer $6,660; trash $4,647; gardener $2,400; new taxes $12,580)
Exterior
- Parking: Total of 6 parking spaces; Individual garage spaces allocated to units (unit-level garage spaces: several units include 1 garage space; one unit includes 2 garage spaces)
- Utilities: Public sewer; District/Public water; Multiple utility meters: five separate electric meters, five separate gas meters, two separate water meters
- Home design: Single-story building; Five separate buildings on site
- Construction: Built year from public records (year not provided)
- Exterior features: No pool; Curbs and sidewalks in the community
Interior
- Kitchen: No specific appliance list provided
- Bedrooms: Five dwelling units: a mix of 1-bed, 2-bed and 3-bed units across the building (unit breakdown: three 1-bed units, two 2-bed units, one 3-bed unit noted across units — see unit-level rents and bed counts)
- Bathrooms: Each unit has one full bathroom
- Interior features: One-level property; Attached property; 2+ common walls
- Laundry & utility: On-site laundry hookups with washer hookup and gas dryer hookup; Tenants pay gas and electricity
Neighborhood map
What this means for you Summary
Snapshot
- This is a 1×3bd/1ba + 2×2bd/1ba + 2×1bd/1ba units multifamily listed at $1.69M.
Deal economics
- At list price, monthly cash flow is $-4k ($-42k/yr) — negative. Per door: $-702/mo.
- To cash-flow at today's rent, offer at most $1.07M (36.7% below list).
- To meet the 1% rule (rent ≥ 1% of price), the offer needs to be $900k (46.8% below list).
- Recommended offer: $900k (46.8% below list) — sets the bar for 1% rule.
- Cap rate 3.8% vs local median 2.8% in Pomona — top-decile yield for the area; either an underpriced asset or a hidden risk that comps aren't pricing in. Stress-test before assuming the spread holds.
Location & tenants
- Location reads 58/100 on livability (#676 in CA) — a working-class tenant base; expect higher turnover. Strengths: commute A+; Watch: schools D, crime F, amenities F.
- Pomona Unified (suburban): math 12% / reading 31% proficiency, ranked #444 of 517 in CA (top 86%) — low school quality limits family demand, transient renter base, plan for 1-2y turnover; 73% free/reduced lunch — lower-income household profile, screen leases tightly.
- Market conditions: 59 active listings in the ZIP; 19 comparable units currently listed for rent nearby; rentals at typical pace (median 24d on market — plan ~3-4 weeks tenant-placement turnaround); 47% of comp listings sitting > 30 days — soft ceiling on asking rent; solid renter incomes; 19,697 units permitted in Los Angeles County in 2024 (9,426 in 5+ unit buildings).
- At $8,995/mo this rent would consume 142% of the median local household income ($76k/yr) (locally 1403% of renters already pay >50% of income on rent) — very limited rent-growth headroom before tenants either downsize or default.
Forward outlook
- Local home prices are declining (-3.0%/yr); year-one equity from $12k of loan paydown is wiped out by about $51k of value loss. Plan a longer hold.
- Los Angeles County population projected at +9% by 2050 — modest demand growth; plan on rents tracking national, not racing it.
Negotiation context
- It's been on market 16 days — a 2% lower offer ($1.66M) is reasonable based on typical stale-listing flexibility.
- 11 sale attempts since 21y ago with the ask held roughly flat each time — persistent listings suggest the price (not the market) is what's stuck; bring a comps-based counter.
- Current owner paid $1.27M; 33% above their basis — modest negotiation headroom, anchor on the comps not their cost.
Risks & watch-outs
- Climate carrying-cost: extreme-heat days projected 7→20/yr by 2055 (HVAC capex compounding) — expect insurance premiums to compound above CPI over the hold.
Questions for the listing agent
- What do current leases actually rent for vs. the listed asking? Can we see a recent rent roll and the last 12 months of T-12 income?
- Can we see the unit-by-unit rent roll, current vacancy, and any below-market leases? What's the average tenancy length?
- What capital expenditures (roof, boiler, parking lot, exteriors) have been made in the last 5 years, and what's planned in the next 2?
- Built in 1960 — when were the roof, HVAC, electrical panel, plumbing, and water heater last replaced?
- Is there a deadline driving the sale (1031 exchange, divorce, estate, relocation)? That informs how much negotiation room exists.
- Schools are D-rated, which usually means shorter tenancies and higher turnover. Who's the typical renter profile here, and what's been the actual vacancy rate?
- Crime grade is F in this area — have there been break-ins, vandalism, or insurance claims at this property in the last 3 years? What carrier currently insures it and at what premium?
- The area grade is low — what's the realistic commute time and amenity access for the typical tenant pool here? Any planned neighborhood developments (good or bad) we should know about?
- What's the average days-on-market for RENTAL listings here right now (not sales)? A rising rental-DOM trend means longer vacancies and softer asking-rent achievability than the comps imply.
- What's the recent tenant-quality profile in this submarket — average credit score on applications, eviction rate, late-payment / NSF rate, and stable-employment percentage? A property-management company in the area should have these aggregated.
- How much new apartment / multifamily construction is in the pipeline within 1–3 miles? Heavy new supply (>2% of stock underway) typically softens rents 12–24 months out; light construction supports rent growth.
Investment metrics
- 1% rule
- 0.53% ✗
- Cap rate
- 3.80%
- Cash-on-cash
- -8.90%
- DSCR
- 0.60
- GRM
- 15.7
CMA / ARV
- ARV (on-the-fly)
- $664,000
- Comps found
- 5
Show comp detail 5 sales within ~0.75 mi
| Address | Dist | Beds/Ba | Sqft | Sold | Price | $/sf | Match |
|---|---|---|---|---|---|---|---|
| 1035 Laurel Ave | 0.09mi | 4/2.0 | 1,722 (+8%) | 6mo | $735,500 | $427 | 78 |
| 1242 W Orange Grv | 0.34mi | 4/2.0 | 1,443 (-10%) | 1mo | $750,000 | $520 | 67 |
| 610 W Center | 0.45mi | 4/2.0 | 1,791 (+12%) | 1mo | $545,000 | $304 | 58 |
| 574 Davidson Ln | 0.26mi | 4/2.0 | 1,801 (+13%) | 11mo | $725,000 | $403 | 58 |
| 806 W 4th St | 0.74mi | 3/2.0 (-1) | 1,469 (-8%) | 16mo | $610,000 | $415 | 33 |
Match score weights: distance 35% · size 25% · config 20% · recency 20%. Top-matched comps best support the ARV.
Projected returns pro-forma
-3.0% appreciation · 3.0% rent growth · sell at horizon
- IRR
- -32.1%
- Equity multiple
- -0.05×
- Total profit
- $-497,865
- Equity at exit
- $251,984
- IRR
- -37.4%
- Equity multiple
- -0.53×
- Total profit
- $-723,421
- Equity at exit
- $146,120
Cash invested: $473,200 (down + closing). Projections, not guarantees.
Landlord ↔ Tenant lean methodology
- Overall (STATE)
- 18 Strongly Tenant-Friendly
- State California
- 18 Strongly Tenant-Friendly · D+13
- County
- — inherits STATE
- City
- — inherits STATE
ZIP-level market 91768
- Active inventory
- 59
- Price-to-rent
- 72.8×
Monthly cashflow live
- Estimated rent
- $8,995 medium interval (Pro) →
- Mortgage (P&I)
- −$8,863
- Tax from tax record
- −$1,048 /mo · $12,581/yr
- Insurance
- −$704
- HOA
- −$0
- Vacancy / Maint / Mgmt
- −$1,889
- Net cashflow
- $-3,509
Break-even live
5-unit breakdown (identical units grouped — click to expand)
| Units | Beds | Baths | Est. rent |
|---|---|---|---|
| 1× unit | 3 | 1 | $1,936 |
| 2× units | 2 | 1 | $3,616 |
| #2 | 2 | 1 | $1,808 |
| #3 | 2 | 1 | $1,808 |
| 2× units | 1 | 1 | $3,444 |
| #4 | 1 | 1 | $1,722 |
| #5 | 1 | 1 | $1,722 |
| Total (5 units) | $8,995 | ||
UW: 25.0% down · 7.5% · 30yr · 1.5% tax · 5.0% vac · 8.0% maint · 8.0% mgmt
Financing live
Cash to close
- Down payment
- $422,500
- Closing costs
- $50,700
- Reserves months
- —
- Total cash needed
- —
Loan-product check · same deal, 3 products live
Conventional
25% down · 7.5% · 30yr
- Down + closing
- —
- Monthly P&I
- —
- Monthly cashflow
- —
- DSCR
- —
- Eligible?
- —
Personal DTI + credit; lowest rate.
DSCR
20% down · 8.5% · 30yr
- Down + closing
- —
- Monthly P&I
- —
- Monthly cashflow
- —
- DSCR
- —
- Eligible?
- —
No personal income docs; deal must DSCR.
Hard money
10% down · 12.0% · 12mo
- Down + closing
- —
- Monthly P&I
- —
- Monthly cashflow
- —
- DSCR
- —
- Eligible?
- —
Short-term bridge; refi at stabilization.
Rent comps 19 comps
| Address | Beds | Baths | Sqft | Rent | $/sqft | DOM | Units | Dist |
|---|---|---|---|---|---|---|---|---|
| 1010 W Wilson St Pomona, CA | 4.0 | 3.5 | 2013 | $3,250 | $1.61 | 43d | 1 | 0.20mi |
| 761 Lewis St Pomona, CA | 3.0 | 2.5 | 1726 | $7,000 | $4.06 | 20d | 1 | 0.22mi |
| 1318 Jacqueline Dr Pomona, CA | 3.0 | 2.0 | 1328 | $3,500 | $2.64 | 1d | 1 | 0.77mi |
| 1615 California Pl Pomona, CA | 4.0 | 2.5 | 2046 | $7,500 | $3.67 | 12d | 1 | 0.80mi |
| 1339 Nimbus Ct Pomona, CA | 3.0 | 3.0 | 1500 | $3,320 | $2.21 | 10d | 1 | 0.81mi |
| 1501 Stratus Dr Pomona, CA | 3.0 | 3.5 | 1791 | $3,150 | $1.76 | 43d | 1 | 0.84mi |
| 115 E Jefferson Ave Pomona, CA | 4.0 | 1.0 | 1592 | $3,495 | $2.20 | 43d | 1 | 1.00mi |
| 1490 N Park Ave Pomona, CA | 3.0 | 2.0 | 1376 | $3,395 | $2.47 | 43d | 1 | 1.02mi |
| 1543 Mc Comas St Pomona, CA | 3.0 | 2.0 | 1199 | $3,500 | $2.92 | 17d | 1 | 1.05mi |
| 1325 W Grand Ave Unit 3 Pomona, CA | 3.0 | 2.5 | 1628 | $3,350 | $2.06 | 43d | 1 | 1.06mi |
| 1548 Vallecito Pomona, CA | 4.0 | 3.0 | 2243 | $3,800 | $1.69 | 1d | 1 | 1.10mi |
| 1574 N Orange Grove Ave Pomona, CA | 3.0 | 2.0 | 1330 | $4,000 | $3.01 | 43d | 1 | 1.19mi |
| 1036 W Fernleaf Ave Pomona, CA | 3.0 | 3.0 | 1605 | $3,200 | $1.99 | 43d | 1 | 1.25mi |
| 642 W Grand Ave Pomona, CA | 4.0 | 3.0 | 1689 | $3,495 | $2.07 | 17d | 1 | 1.27mi |
| 1331 S Park Ave Unit 1333 Pomona, CA | 4.0 | 2.0 | 1200 | $3,395 | $2.83 | 43d | 1 | 1.31mi |
| 1331 S Park Ave Unit 1333 Pomona, CA | 4.0 | 2.0 | 1200 | $2,959 | $2.47 | 11d | 1 | 1.31mi |
| 1333 S Park Ave Pomona, CA | 4.0 | 2.0 | 1200 | $3,500 | $2.92 | 43d | 1 | 1.31mi |
| 1333 S Park Ave Pomona, CA | 4.0 | 2.0 | 1200 | $3,395 | $2.83 | 24d | 1 | 1.31mi |
| 1908 Grier St Pomona, CA | 3.0 | 1.0 | 1106 | $3,200 | $2.89 | 2d | 1 | 1.50mi |
Listing history 12 events
-
2026-06-18days on market $1,690,000 Active 16 DOM
-
2026-06-17days on market $1,690,000 Active 15 DOM
-
2026-06-16days on market $1,690,000 Active 14 DOM
-
2026-06-15days on market $1,690,000 Active 13 DOM
-
2026-06-13days on market $1,690,000 Active 11 DOM
-
2026-06-13days on market $1,690,000 Active 10 DOM
-
2026-06-09days on market $1,690,000 Active 7 DOM
-
2026-06-08days on market $1,690,000 Active 6 DOM
-
2026-06-07days on market $1,690,000 Active 5 DOM
-
2026-06-04days on market $1,690,000 Active 2 DOM
-
2026-06-02remarks 689-char remark
-
2026-06-02$1,690,000 Active 1 DOM
ⓘ Source: listings_history table (triggers on properties + properties_extension) + one-shot
backfill from property_details.listing_events for pre-trigger history.
Tax reassessment forecast CA · Resets to sale price
- Current annual tax
- $12,581 · $1,048/mo
- Projected year-2 tax
- $12,844 · $1,070/mo
- Expected delta
- +$263/yr (+$22/mo · 2.1%)
ⓘ Screening estimate from a state-policy table — verify with the county assessor before closing.
Climate risk First Street
- Flood 2/10 Low FEMA zone X (unshaded) · 9% chance over 30 yrs
- Wildfire 3/10 Moderate
- Heat 7/10 Severe 7 d/yr ≥99°F today · 20 d/yr by 30 yrs out
- Wind 1/10 Low
- Air quality 8/10 Severe 17 unhealthy d/yr today · 21 by 30 yrs out
Nearby sold comps map
Loading sold comps map…
Walkable amenities ~0.75 mi
Loading nearby amenities…
Taxation est. · year 1
- Rental income
- $107,940
- − Mortgage interest
- −$94,666
- − Property taxes
- −$12,581
- − Insurance
- −$8,450
- − Repairs & maintenance
- −$8,635
- − Management
- −$8,635
- − Depreciation
- −$49,164
- Taxable loss
- −$74,191
- Est. tax savings @ 24.0%
- +$17,806
- After-tax cash flow
- $-24,303/yr
For passive investors: Depreciation is non-cash, so a rental often shows a tax loss while cash-flowing — sheltering income. Rental losses are passive: they offset passive income freely, and up to $25,000/yr can offset ordinary (W-2) income if you actively participate and your MAGI is under $100k (phasing out to $0 by $150k); unused losses carry forward. On sale, claimed depreciation is recaptured at up to 25%, and gains may owe capital-gains tax (a 1031 exchange can defer both). Figures are a year-1 estimate at your 24.0% rate — not tax advice; consult a CPA.
Schools (NCES district)
- District
- Pomona Unified
- NCES district ID
- 0631320
- Math proficiency
- 12% ▼ -15.00%
- Reading proficiency
- 31% ▼ -10.00%
- Median HH income
- $54,839
- Composite
- 19.54/100
- National rank
- #8761
- State rank
- #444 of 517 in CA
Livability — Pomona
- Score
- 58/100
- State rank
- #676
- US rank
- #20782
Category grades
Schools grade is shown separately in the Schools card above.
Census & demographics
- Census place
- Pomona, CA
- County
- Los Angeles County · 9,444,647 people
- City population
- 152,679
- Metro
- Los Angeles-Long Beach-Anaheim, CA
- Population (ZIP)
- 34,200
- Household income
- $76,041
- Rent vs Own
- Severe rent burden
- 1403.0
Population outlook (Los Angeles County) Hauer SSP2
- Today (2025)
- 10,940,515 people
- By 2030
- 11,256,481 · +2.9%
- By 2040
- 11,729,929 · +7.2%
- By 2050
- 11,948,407 · +9.2%
- By 2075
- 11,818,114 · +8.0%
- By 2100
- 10,842,928 · -0.9%
Race, ethnicity, and origin ACS 2023
- Neighborhood character
- Predominantly Hispanic (74%)
- Race & ethnicity
- Hispanic / Latino 74% Two or more races 19% White 11% Asian 8% Black 4% Native American 4%
- Hispanic origin (detail)
- Mexican 64%
- Common ancestry
- Italian 1% Iranian 1% Lithuanian 1%
- Foreign-born
- 31% · Canada, Vietnam, China
- Languages at home
- 37% English-only · Spanish 54% Chinese 2% Vietnamese 2%
Political lean MEDSL · Los Angeles
- 2024 margin
- Solid D (+32.9) · D 64.8% · R 31.9% · Other 3.3%
- 2008→2024 swing
- -7.4pp toward R · 2008: 40.4pp · 2024: 32.9pp
- All cycles
- 2024: D+32.9 2020: D+44.2 2016: D+48.0 2012: D+40.0 2008: D+40.4
Not yet ingested
- Civics
- —
Market trends
- HPI YoY
- ▼ -784.48%
- Current HPI
- 425.8176
- Rent YoY
- —
- Metro
- Los Angeles-Long Beach-Anaheim, CA
- State GDP YoY
- ▲ 3.21%
- F500 in state
- 116
Industry mix (Fortune 500 HQ in CA)
| Industry | F500 HQs | Revenue |
|---|---|---|
| Technology | 27 | $1,492B |
|
||
| Financial Services | 3 | $174B |
|
||
| Retail | 3 | $44B |
|
||
| Insurance | 3 | $26B |
|
||
| Media / Entertainment | 2 | $115B |
|
||
| Pharmaceuticals / Biotech | 2 | $62B |
|
||
Price history
+98.8% since first listed24 events — show timeline
- 2026-06-02 Listed $1,690,000 CRMLS
- 2025-09-23 Sold (MLS) $1,275,000 CRMLS
- 2025-08-01 Pending — CRMLS
- 2025-07-15 Listed $1,300,000 CRMLS
- 2024-12-02 Listing Removed — CRMLS
- 2024-10-18 Listed $1,250,000 CRMLS
- 2024-10-18 Coming Soon — CRMLS
- 2022-11-07 Listing Removed — CRMLS
- 2022-10-06 Listed $1,275,000 CRMLS
- 2011-03-18 Listing Removed — CRMLS
- 2010-10-11 Listed $509,900 CRMLS
- 2010-07-31 Listing Removed — CRMLS
- 2010-03-31 Listed $549,900 CRMLS
- 2009-08-30 Listing Removed — CRMLS
- 2009-01-30 Listed $629,900 CRMLS
- 2009-01-02 Listing Removed — CRMLS
- 2008-11-05 Listed $724,900 CRMLS
- 2008-07-31 Listing Removed — CRMLS
- 2008-04-29 Listed $724,900 CRMLS
- 2006-12-07 Sold (Public Records) $650,000 Public Records
- 2006-12-07 Sold (MLS) $650,000 CRMLS
- 2005-12-01 Listed $799,900 CRMLS
- 2005-11-30 Listing Removed — CRMLS
- 2005-05-30 Listed $850,000 CRMLS
Property tax history
+2.5%/yrLatest (2025): $12,581 · +9.6% YoY. Source: county tax records.
Cash-flow waterfall
monthlySold comps — $/sqft
last 12 mo · ≤1 miLoading sold comps…