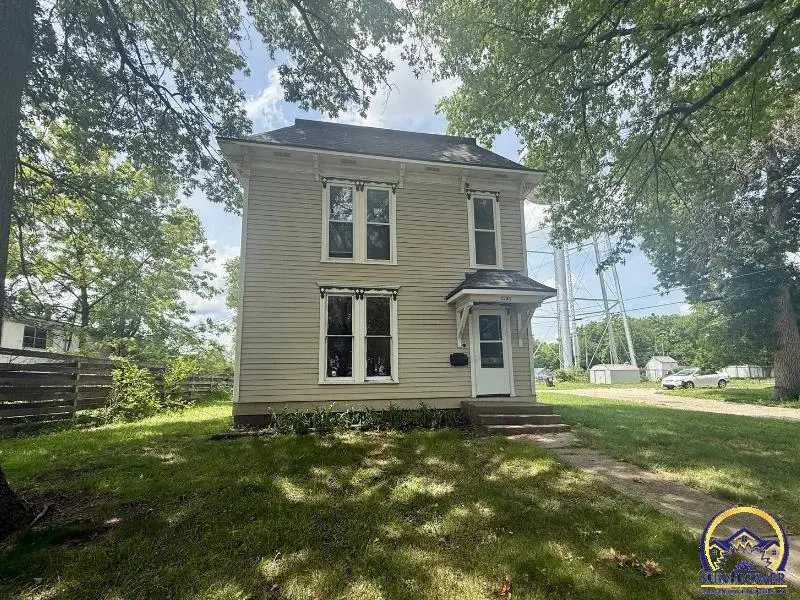
1521 1st Avenue Ave E · Horton, KS
Flood risk 1/10 · Minimal
- FEMA flood zone
- X (unshaded)
- Chance of flooding over 30 yrs
- 0.0%
- Est. flood insurance / yr
- $473 – $860
Fire risk 4/10 · Minor
- Est. fire insurance / yr
- $1,154 – $2,142
Heat risk 4/10 · Minor
- Hot days now (above 109°F)
- 7 days/yr
- Hot days in 30 yrs
- 17 days/yr
Wind risk 2/10 · Minimal
- Chance of severe wind over 30 yrs
- —
Air-quality risk 2/10 · Minimal
- Unhealthy air days now
- 1 days/yr
- Unhealthy air days in 30 yrs
- 1 days/yr
Risk factors via First Street. Map © Google.
Why this score? — see what drove the B grade
The composite is a weighted blend of 9 inputs, each scored 0–100. Each bar is that input's sub-score; the figure is the points it added to the 100-point composite (weight × sub-score).
- Cash flow +26.2/30.0
- ARV discount +15.0/15.0
- DSCR +8.9/10.0
- 1% rule +6.7/10.0
- Appreciation +4.7/10.0
- Livability +3.5/5.0
- Rent growth +2.5/5.0
- Condition / age +2.5/5.0
- Schools +2.3/10.0
$89,000
🖨 Deal sheet 📄 Offer letter ✓ Due diligence
Key facts
- Room to relax
- Detached garage
- 8,712 sq ft lot
Tags
Property features AI
Exterior
- Parking: Detached 2-car garage
- Home design: Single-family residence
- Exterior features: Lot of approximately 0.2 acres
Interior
- Bathrooms: 1 full bathroom; 1 half bathroom
- Interior features: Basement present
Neighborhood map
What this means for you Summary
Snapshot
- This is a 2-bed/1.5-bath single-family listed at $89k.
Deal economics
- At list price, monthly cash flow is $228 ($3k/yr) — positive.
- The deal already cash-flows at list — no discount required.
- Meets the 1% rule at list price ($1k rent vs $89k).
- Recommended offer: $88k (1.5% below list) — sets the bar for market timing.
Location & tenants
- Location reads 69/100 on livability (#177 in KS) — a middle-class / working-renter tenant base. Strengths: cost of living A+, housing A+, health & safety A+; Watch: employment D, amenities F, commute F.
- South Brown County (rural): math 28% / reading 26% proficiency, ranked #132 of 169 in KS (top 78%) — low school quality limits family demand, transient renter base, plan for 1-2y turnover.
- Zoned schools: Everest Middle (math 27% / reading 27%, grade F, #94 of 219 statewide, top 44%, 174 students, 58% FRL); Horton High (math 15% / reading 15%, grade F, #249 of 327 statewide, top 79%, 163 students, 59% FRL) — zoned schools at 58% FRL track the district average.
- Market conditions: 16 active listings in the ZIP; 2 units permitted in Brown County in 2024 (0 in 5+ unit buildings).
Forward outlook
- In year one you build about $36 of equity ($615 loan paydown + $-579 appreciation (-0.7% local appreciation)).
- Brown County population projected at -12% by 2050 — secular population decline; favor cash flow + early exit over multi-decade hold.
- At projected returns (-0.7% appreciation + 3.0% rent growth), your $25k cash investment doubles in ~7 years — after that, you're playing with house money.
Negotiation context
- It's been on market 22 days — a 2% lower offer ($88k) is reasonable based on typical stale-listing flexibility.
- 3 sale attempts with the ask held roughly flat each time — persistent listings suggest the price (not the market) is what's stuck; bring a comps-based counter.
- Current owner paid $15k; list at $89k implies a 493% gain — meaningful room to come down on a strong offer.
Risks & watch-outs
- Watch-outs: built in 1895 — expect roof / HVAC / electrical / plumbing capex.
Questions for the listing agent
- Built in 1895 — when were the roof, HVAC, electrical panel, plumbing, and water heater last replaced?
- Is there a deadline driving the sale (1031 exchange, divorce, estate, relocation)? That informs how much negotiation room exists.
- Schools are F-rated, which usually means shorter tenancies and higher turnover. Who's the typical renter profile here, and what's been the actual vacancy rate?
- What's the average days-on-market for RENTAL listings here right now (not sales)? A rising rental-DOM trend means longer vacancies and softer asking-rent achievability than the comps imply.
- What's the recent tenant-quality profile in this submarket — average credit score on applications, eviction rate, late-payment / NSF rate, and stable-employment percentage? A property-management company in the area should have these aggregated.
- How much new for-sale + rental construction is in the pipeline within 1–3 miles? Heavy new supply typically softens prices + rents 12–24 months out; constrained supply supports both.
Investment metrics
- 1% rule
- 1.17% ✓
- Cap rate
- 9.37%
- Cash-on-cash
- 11.00%
- DSCR
- 1.49
- GRM
- 7.1
CMA / ARV
- ARV (on-the-fly)
- $123,152
- Comps found
- 2
Show comp detail 2 sales within ~0.75 mi
| Address | Dist | Beds/Ba | Sqft | Sold | Price | $/sf | Match |
|---|---|---|---|---|---|---|---|
| 245 E 7th St | 0.62mi | 3/1.0 (+1) | 1,374 (-4%) | 12mo | $28,000 | $20 | 48 |
| 640 W 15th St | 0.53mi | 3/1.0 (+1) | 1,275 (-11%) | 7mo | $110,000 | $86 | 44 |
Match score weights: distance 35% · size 25% · config 20% · recency 20%. Top-matched comps best support the ARV.
Projected returns pro-forma
-0.65% appreciation · 3.0% rent growth · sell at horizon
- IRR
- 8.1%
- Equity multiple
- 1.37×
- Total profit
- $9,260
- Equity at exit
- $22,987
- IRR
- 13.9%
- Equity multiple
- 2.43×
- Total profit
- $35,541
- Equity at exit
- $25,445
Cash invested: $24,920 (down + closing). Projections, not guarantees.
Landlord ↔ Tenant lean methodology
- Overall (STATE)
- 83 Strongly Landlord-Friendly
- State Kansas
- 83 Strongly Landlord-Friendly · R+10
- County
- — inherits STATE
- City
- — inherits STATE
ZIP-level market 66439
- Home prices YoY
- -0.3%
- Active inventory
- 16
- Price-to-rent
- 7.1×
Monthly cashflow live
- Estimated rent
- $1,045 medium interval (Pro) →
- Mortgage (P&I)
- −$467
- Tax from tax record
- −$93 /mo · $1,121/yr
- Insurance
- −$37
- HOA
- −$0
- Vacancy / Maint / Mgmt
- −$219
- Net cashflow
- $228
Break-even live
UW: 25.0% down · 7.5% · 30yr · 1.5% tax · 5.0% vac · 8.0% maint · 8.0% mgmt
Financing live
Cash to close
- Down payment
- $22,250
- Closing costs
- $2,670
- Reserves months
- —
- Total cash needed
- —
Loan-product check · same deal, 3 products live
Conventional
25% down · 7.5% · 30yr
- Down + closing
- —
- Monthly P&I
- —
- Monthly cashflow
- —
- DSCR
- —
- Eligible?
- —
Personal DTI + credit; lowest rate.
DSCR
20% down · 8.5% · 30yr
- Down + closing
- —
- Monthly P&I
- —
- Monthly cashflow
- —
- DSCR
- —
- Eligible?
- —
No personal income docs; deal must DSCR.
Hard money
10% down · 12.0% · 12mo
- Down + closing
- —
- Monthly P&I
- —
- Monthly cashflow
- —
- DSCR
- —
- Eligible?
- —
Short-term bridge; refi at stabilization.
Listing history 26 events
-
2026-06-18days on market $89,000 Active 22 DOM
-
2026-06-17days on market $89,000 Active 21 DOM
-
2026-06-16days on market $89,000 Active 20 DOM
-
2026-06-15days on market $89,000 Active 19 DOM
-
2026-06-13days on market $89,000 Active 17 DOM
-
2026-06-12days on market $89,000 Active 16 DOM
-
2026-06-09days on market $89,000 Active 13 DOM
-
2026-06-08days on market $89,000 Active 12 DOM
-
2026-06-07days on market $89,000 Active 11 DOM
-
2026-06-05days on market $89,000 Active 9 DOM
-
2026-06-04days on market $89,000 Active 7 DOM
-
2026-06-02days on market $89,000 Active 6 DOM
-
2026-06-01days on market $89,000 Active 5 DOM
-
2026-05-31days on market $89,000 Active 4 DOM
-
2026-05-31days on market $89,000 Active 3 DOM
-
2026-05-27$89,000 Active
-
2025-12-29historical
-
2025-10-20price $123,000
-
2025-10-02price $127,000
-
2025-09-10price $129,000
-
2025-08-19status Active
-
2025-08-15status Pending
-
2025-07-28price $137,000
-
2025-06-23$153,000 Active
-
2007-11-01soldstatus $15,000
-
2002-03-01soldstatus $35,000
ⓘ Source: listings_history table (triggers on properties + properties_extension) + one-shot
backfill from property_details.listing_events for pre-trigger history.
Tax reassessment forecast KS · Resets to sale price
- Current annual tax
- $1,121 · $93/mo
- Projected year-2 tax
- $1,255 · $105/mo
- Expected delta
- +$134/yr (+$11/mo · 11.9%)
ⓘ Screening estimate from a state-policy table — verify with the county assessor before closing.
Climate risk First Street
- Flood 1/10 Low FEMA zone X (unshaded) · 0% chance over 30 yrs
- Wildfire 4/10 Moderate
- Heat 4/10 Moderate 7 d/yr ≥109°F today · 17 d/yr by 30 yrs out
- Wind 2/10 Low
- Air quality 2/10 Low 1 unhealthy d/yr today · 1 by 30 yrs out
Nearby sold comps map
Loading sold comps map…
Walkable amenities ~0.75 mi
Loading nearby amenities…
Taxation est. · year 1
- Rental income
- $12,541
- − Mortgage interest
- −$4,985
- − Property taxes
- −$1,121
- − Insurance
- −$445
- − Repairs & maintenance
- −$1,003
- − Management
- −$1,003
- − Depreciation
- −$2,589
- Taxable income
- $1,393
- Est. tax owed @ 24.0%
- −$334
- After-tax cash flow
- $2,406/yr
For passive investors: Depreciation is non-cash, so a rental often shows a tax loss while cash-flowing — sheltering income. Rental losses are passive: they offset passive income freely, and up to $25,000/yr can offset ordinary (W-2) income if you actively participate and your MAGI is under $100k (phasing out to $0 by $150k); unused losses carry forward. On sale, claimed depreciation is recaptured at up to 25%, and gains may owe capital-gains tax (a 1031 exchange can defer both). Figures are a year-1 estimate at your 24.0% rate — not tax advice; consult a CPA.
Schools (NCES district)
- District
- South Brown County
- NCES district ID
- 2007470
- Math proficiency
- 28% ▲ 4.00%
- Reading proficiency
- 26% ▲ 1.00%
- Median HH income
- $38,473
- Composite
- 22.63/100
- National rank
- #8063
- State rank
- #132 of 169 in KS
Livability — Horton
- Score
- 69/100
- State rank
- #177
- US rank
- #8157
Category grades
Schools grade is shown separately in the Schools card above.
Census & demographics
- Census place
- Horton, KS
- Population (ZIP)
- 2,585
Population outlook (Brown County) Hauer SSP2
- Today (2025)
- 9,357 people
- By 2030
- 9,119 · -2.5%
- By 2040
- 8,629 · -7.8%
- By 2050
- 8,188 · -12.5%
- By 2075
- 7,138 · -23.7%
- By 2100
- 5,586 · -40.3%
Race, ethnicity, and origin ACS 2023
- Neighborhood character
- Diverse neighborhood (Simpson 0.55)
- Race & ethnicity
- White 66% Native American 18% Hispanic / Latino 11% Two or more races 10% Black 1%
- Hispanic origin (detail)
- Mexican 10%
- Common ancestry
- Portuguese 5% Iranian 2% Lithuanian 2%
- Foreign-born
- 1% · Canada
- Languages at home
- 97% English-only · Spanish 2%
Political lean MEDSL · Brown
- 2024 margin
- Solid R (+47.9) · D 25.0% · R 73.0% · Other 2.0%
- 2008→2024 swing
- -9.8pp toward R · 2008: -38.1pp · 2024: -47.9pp
- All cycles
- 2024: R+47.9 2020: R+48.2 2016: R+50.8 2012: R+44.0 2008: R+38.1
Not yet ingested
- Civics
- —
Market trends
- HPI YoY
- ▼ -0.65%
- Current HPI
- 208.4621
- Rent YoY
- —
- Metro
- —
- State GDP YoY
- —
- F500 in state
- 0
Price history
+154.3% since first listed11 events — show timeline
- 2026-05-27 Listed $89,000 Sunflower MLS as distributed by MLS GRID
- 2025-12-29 Listing Removed — Heartland MLS as Distributed by MLS Grid
- 2025-10-20 Price Changed $123,000 Heartland MLS as Distributed by MLS Grid
- 2025-10-02 Price Changed $127,000 Heartland MLS as Distributed by MLS Grid
- 2025-09-10 Price Changed $129,000 Heartland MLS as Distributed by MLS Grid
- 2025-08-19 Relisted — Heartland MLS as Distributed by MLS Grid
- 2025-08-15 Pending — Heartland MLS as Distributed by MLS Grid
- 2025-07-28 Price Changed $137,000 Heartland MLS as Distributed by MLS Grid
- 2025-06-23 Listed $153,000 Heartland MLS as Distributed by MLS Grid
- 2007-11-01 Sold (Public Records) $15,000 Public Records
- 2002-03-01 Sold (Public Records) $35,000 Public Records
Property tax history
+5.1%/yrLatest (2025): $1,121 · +10.6% YoY. Source: county tax records.
Cash-flow waterfall
monthlySold comps — $/sqft
last 12 mo · ≤1 miLoading sold comps…