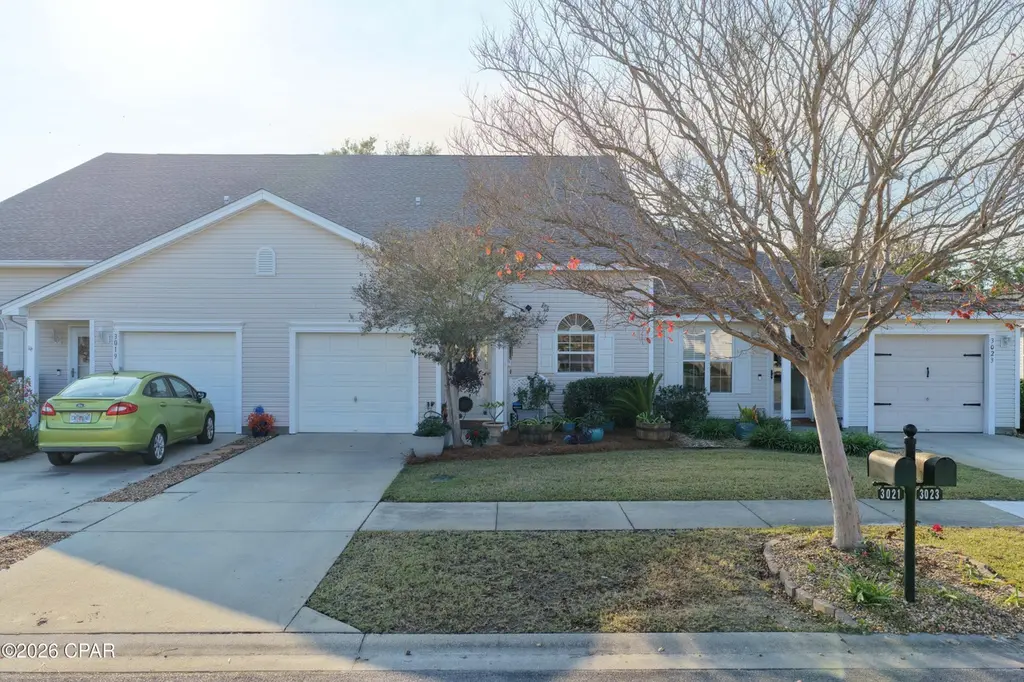
3021 Meadow St · Lynn Haven, FL
Flood risk 1/10 · Minimal
- FEMA flood zone
- X (unshaded)
- Chance of flooding over 30 yrs
- 0.0%
- Est. flood insurance / yr
- $507 – $1,088
Fire risk 4/10 · Minor
- Est. fire insurance / yr
- $947 – $1,759
Heat risk 10/10 · Severe
- Hot days now (above 105°F)
- 7 days/yr
- Hot days in 30 yrs
- 22 days/yr
Wind risk 9/10 · Severe
- Chance of severe wind over 30 yrs
- 99.0%
Air-quality risk 1/10 · Minimal
- Unhealthy air days now
- 0 days/yr
- Unhealthy air days in 30 yrs
- 0 days/yr
Risk factors via First Street. Map © Google.
Why this score? — see what drove the C- grade
The composite is a weighted blend of 9 inputs, each scored 0–100. Each bar is that input's sub-score; the figure is the points it added to the 100-point composite (weight × sub-score).
- Cash flow +19.3/30.0
- ARV discount +7.5/15.0
- DSCR +6.1/10.0
- 1% rule +4.3/10.0
- Schools +4.3/10.0
- Livability +4.0/5.0
- Rent growth +3.1/5.0
- Condition / age +2.5/5.0
- Appreciation +0.0/10.0
$255,000
🖨 Deal sheet 📄 Offer letter ✓ Due diligence
Listing remarks MLS
Ideally located in The Hammocks of Lynn Haven. This townhome is 1,938 sq. ft. has 3 bedrooms, 2 1/2 baths, 1 car garage, enclosed tiled Florida sunroom, large bonus/loft area and is just minutes from Mosley High School and 20 minutes from Tyndall AFB. Home is centrally located and close to shopping, restaurants and the areas best schools. * All measurements are approximate *
Key facts
- Garage
- Community pool
- Built 2005
Property features AI
Finance
- HOA & community: Homeowners association present; Community pool access
Exterior
- Parking: Detached or attached garage with space for 1 vehicle
- Utilities: Cable connected
- Home design: Multi-family zoning
- Exterior features: Community pool; In-ground community pool
Interior
- Bedrooms: Two bedrooms (both on the second level; approx. 12 x 11 and 14 x 11)
- Flooring: Luxury vinyl plank
- Bathrooms: Two full bathrooms and one half bathroom
- Interior features: Luxury vinyl plank flooring
Neighborhood map
What this means for you Summary
Snapshot
- This is a 3-bed/3.0-bath townhouse listed at $255k.
Deal economics
- At list price, monthly cash flow is $278 ($3k/yr) — positive.
- The deal already cash-flows at list — no discount required.
- To meet the 1% rule (rent ≥ 1% of price), the offer needs to be $238k (6.6% below list).
- Recommended offer: $238k (6.6% below list) — sets the bar for 1% rule.
- Cap rate 7.6% vs local median 3.5% in Lynn Haven — top-decile yield for the area; either an underpriced asset or a hidden risk that comps aren't pricing in. Stress-test before assuming the spread holds.
Location & tenants
- Location reads 81/100 on livability (#96 in FL, #1,472 nationally) — a professional / high-income tenant draw. Strengths: crime A+, housing A+, health & safety A+; Watch: amenities D+, commute F.
- Bay (suburban): math 51% / reading 51% proficiency, ranked #29 of 73 in FL (top 40%) — acceptable for families but not a draw, mixed tenant base, ~2y average lease.
- Market conditions: Rents rising (+2.5%/yr); 196 active listings in the ZIP; 9 comparable units currently listed for rent nearby; rentals at typical pace (median 21d on market — plan ~3-4 weeks tenant-placement turnaround); solid renter incomes; 2,473 units permitted in Bay County in 2024 (559 in 5+ unit buildings).
- This rent runs 34% of the median local income ($83k/yr) — at the standard rent-burdened threshold; future hikes will face affordability resistance.
Forward outlook
- Local home prices are declining (-3.0%/yr); year-one equity from $2k of loan paydown is wiped out by about $8k of value loss. Plan a longer hold.
- Bay County population projected at +24% by 2050 — long-run rental-demand tailwind backs the buy-and-hold thesis.
Negotiation context
- Only 1 days on market — expect competitive offers; lowballing is unlikely to land.
- 6 sale attempts since 22y ago with the ask held roughly flat each time — persistent listings suggest the price (not the market) is what's stuck; bring a comps-based counter.
Risks & watch-outs
- Climate carrying-cost: severe wind risk, 99% chance of damaging wind over 30y; extreme-heat days projected 7→22/yr by 2055 (HVAC capex compounding) — expect insurance premiums to compound above CPI over the hold.
Questions for the listing agent
- Is there a deadline driving the sale (1031 exchange, divorce, estate, relocation)? That informs how much negotiation room exists.
- Schools are B-rated — typically a magnet for longer-tenancy family renters. What's the average tenant stay here, and is there a school-zone premium baked into asking?
- What's the average days-on-market for RENTAL listings here right now (not sales)? A rising rental-DOM trend means longer vacancies and softer asking-rent achievability than the comps imply.
- What's the recent tenant-quality profile in this submarket — average credit score on applications, eviction rate, late-payment / NSF rate, and stable-employment percentage? A property-management company in the area should have these aggregated.
- How much new for-sale + rental construction is in the pipeline within 1–3 miles? Heavy new supply typically softens prices + rents 12–24 months out; constrained supply supports both.
Investment metrics
- 1% rule
- 0.93% ✗
- Cap rate
- 7.60%
- Cash-on-cash
- 4.67%
- DSCR
- 1.21
- GRM
- 8.9
CMA / ARV
No comps found within radius.
Projected returns pro-forma
-3.0% appreciation · 2.52% rent growth · sell at horizon
- IRR
- -9.5%
- Equity multiple
- 0.65×
- Total profit
- $-24,825
- Equity at exit
- $38,021
- IRR
- -0.8%
- Equity multiple
- 0.95×
- Total profit
- $-3,725
- Equity at exit
- $22,048
Cash invested: $71,400 (down + closing). Projections, not guarantees.
Landlord ↔ Tenant lean methodology
- Overall (STATE)
- 87 Strongly Landlord-Friendly
- State Florida
- 87 Strongly Landlord-Friendly · R+3
- County
- — inherits STATE
- City
- — inherits STATE
ZIP-level market 32444
- Home prices YoY
- -29.1%
- Rents YoY
- 2.5%
- Active inventory
- 196
- Price-to-rent
- 8.9×
Monthly cashflow live
- Estimated rent
- $2,383 high interval (Pro) →
- Mortgage (P&I)
- −$1,337
- Tax from tax record
- −$161 /mo · $1,932/yr
- Insurance
- −$106
- HOA
- −$0
- Vacancy / Maint / Mgmt
- −$500
- Net cashflow
- $278
Break-even live
UW: 25.0% down · 7.5% · 30yr · 1.5% tax · 5.0% vac · 8.0% maint · 8.0% mgmt
Financing live
Cash to close
- Down payment
- $63,750
- Closing costs
- $7,650
- Reserves months
- —
- Total cash needed
- —
Loan-product check · same deal, 3 products live
Conventional
25% down · 7.5% · 30yr
- Down + closing
- —
- Monthly P&I
- —
- Monthly cashflow
- —
- DSCR
- —
- Eligible?
- —
Personal DTI + credit; lowest rate.
DSCR
20% down · 8.5% · 30yr
- Down + closing
- —
- Monthly P&I
- —
- Monthly cashflow
- —
- DSCR
- —
- Eligible?
- —
No personal income docs; deal must DSCR.
Hard money
10% down · 12.0% · 12mo
- Down + closing
- —
- Monthly P&I
- —
- Monthly cashflow
- —
- DSCR
- —
- Eligible?
- —
Short-term bridge; refi at stabilization.
Rent comps 9 comps
| Address | Beds | Baths | Sqft | Rent | $/sqft | DOM | Units | Dist |
|---|---|---|---|---|---|---|---|---|
| 3209 Pleasant Hill Rd Lynn Haven, FL | 4.0 | 2.0 | 2376 | $2,995 | $1.26 | 20d | 1 | 0.35mi |
| 2305 Minnesota Ave Lynn Haven, FL | 4.0 | 2.0 | 1692 | $1,950 | $1.15 | 13d | 1 | 0.79mi |
| 1713 Jakes Dr Panama City, FL | 3.0 | 2.5 | 1576 | $2,250 | $1.43 | 20d | 1 | 0.98mi |
| 108 Baldwin Rowe Cir Panama City, FL | 3.0 | 2.5 | 1604 | $2,350 | $1.47 | 20d | 1 | 0.99mi |
| 3126 Wood Valley Rd Panama City, FL | 3.0 | 2.0 | 1922 | $2,800 | $1.46 | 20d | 1 | 1.06mi |
| 2416 Camryns Xing Panama City, FL | 4.0 | 2.0 | 1867 | $2,100 | $1.12 | 20d | 1 | 1.06mi |
| 3502 Jenks Ave Panama City, FL | 1.0–3.0 | 1.0–2.0 | 1176 | $1,850 | $1.57 | 13d | 24 | 1.23mi |
| 2950 Harrison Ave Panama City, FL | 1.0–3.0 | 1.0–2.0 | 1199 | $1,725 | $1.44 | 20d | 6 | 1.25mi |
| 2870 Harrison Ave Panama City, FL | 1.0–3.0 | 1.0–2.0 | 1230 | $1,770 | $1.44 | 20d | 1 | 1.34mi |
Listing history 18 events
-
2026-05-06status Pending
-
2026-05-05$255,000 Active
-
2024-01-31soldstatus $275,000
-
2024-01-30soldstatus $275,000 Closed 377-char remark
Show marketing remark (377 chars)
Ideally located in The Hammocks of Lynn Haven. This townhome is 1,938 sq. ft. has 3 bedrooms, 2 1/2 baths, 1 car garage, enclosed tiled Florida sunroom, large bonus/loft area and is just minutes from Mosley High School and 20 minutes from Tyndall AFB. Home is centrally located and close to shopping, restaurants and the areas best schools. * All measurements are approximate *
-
2024-01-23status Pending 377-char remark
Show marketing remark (377 chars)
Ideally located in The Hammocks of Lynn Haven. This townhome is 1,938 sq. ft. has 3 bedrooms, 2 1/2 baths, 1 car garage, enclosed tiled Florida sunroom, large bonus/loft area and is just minutes from Mosley High School and 20 minutes from Tyndall AFB. Home is centrally located and close to shopping, restaurants and the areas best schools. * All measurements are approximate *
-
2023-12-22price $299,000 377-char remark
Show marketing remark (377 chars)
Ideally located in The Hammocks of Lynn Haven. This townhome is 1,938 sq. ft. has 3 bedrooms, 2 1/2 baths, 1 car garage, enclosed tiled Florida sunroom, large bonus/loft area and is just minutes from Mosley High School and 20 minutes from Tyndall AFB. Home is centrally located and close to shopping, restaurants and the areas best schools. * All measurements are approximate *
-
2023-12-11price $330,000 377-char remark
Show marketing remark (377 chars)
Ideally located in The Hammocks of Lynn Haven. This townhome is 1,938 sq. ft. has 3 bedrooms, 2 1/2 baths, 1 car garage, enclosed tiled Florida sunroom, large bonus/loft area and is just minutes from Mosley High School and 20 minutes from Tyndall AFB. Home is centrally located and close to shopping, restaurants and the areas best schools. * All measurements are approximate *
-
2023-11-02$345,000 Active 377-char remark
Show marketing remark (377 chars)
Ideally located in The Hammocks of Lynn Haven. This townhome is 1,938 sq. ft. has 3 bedrooms, 2 1/2 baths, 1 car garage, enclosed tiled Florida sunroom, large bonus/loft area and is just minutes from Mosley High School and 20 minutes from Tyndall AFB. Home is centrally located and close to shopping, restaurants and the areas best schools. * All measurements are approximate *
-
2021-12-14historical
-
2019-07-26soldstatus $228,500
-
2019-07-26soldstatus $228,500
-
2019-05-27$228,500
-
2018-05-16soldstatus $197,000
-
2018-05-15soldstatus $197,000
-
2018-04-10$200,000
-
2014-07-07$173,000
-
2005-08-05soldstatus $174,259
-
2004-11-30$174,259
ⓘ Source: listings_history table (triggers on properties + properties_extension) + one-shot
backfill from property_details.listing_events for pre-trigger history.
Tax reassessment forecast FL · Resets to sale price
- Current annual tax
- $1,932 · $161/mo
- Projected year-2 tax
- $2,116 · $176/mo
- Expected delta
- +$185/yr (+$15/mo · 9.6%)
ⓘ Screening estimate from a state-policy table — verify with the county assessor before closing.
Climate risk First Street
- Flood 1/10 Low FEMA zone X (unshaded) · 0% chance over 30 yrs
- Wildfire 4/10 Moderate
- Heat 10/10 Extreme 7 d/yr ≥105°F today · 22 d/yr by 30 yrs out
- Wind 9/10 Extreme 99% chance of damaging wind over 30 yrs
- Air quality 1/10 Low 0 unhealthy d/yr today · 0 by 30 yrs out
Nearby sold comps map
Loading sold comps map…
Walkable amenities ~0.75 mi
Loading nearby amenities…
Taxation est. · year 1
- Rental income
- $28,594
- − Mortgage interest
- −$14,284
- − Property taxes
- −$1,932
- − Insurance
- −$1,275
- − Repairs & maintenance
- −$2,287
- − Management
- −$2,287
- − Depreciation
- −$7,418
- Taxable loss
- −$890
- Est. tax savings @ 24.0%
- +$214
- After-tax cash flow
- $3,549/yr
For passive investors: Depreciation is non-cash, so a rental often shows a tax loss while cash-flowing — sheltering income. Rental losses are passive: they offset passive income freely, and up to $25,000/yr can offset ordinary (W-2) income if you actively participate and your MAGI is under $100k (phasing out to $0 by $150k); unused losses carry forward. On sale, claimed depreciation is recaptured at up to 25%, and gains may owe capital-gains tax (a 1031 exchange can defer both). Figures are a year-1 estimate at your 24.0% rate — not tax advice; consult a CPA.
Schools (NCES district)
- District
- Bay
- NCES district ID
- 1200090
- Math proficiency
- 51% ▼ -8.00%
- Reading proficiency
- 51% ▼ -7.00%
- Median HH income
- $47,740
- Composite
- 43.41/100
- National rank
- #3014
- State rank
- #29 of 73 in FL
Livability — Lynn Haven
- Score
- 81/100
- State rank
- #96
- US rank
- #1472
Category grades
Schools grade is shown separately in the Schools card above.
Census & demographics
- Census place
- Lynn Haven, FL
- County
- Bay County · 163,593 people
- City population
- 21,459
- Metro
- Panama City, FL
- Population (ZIP)
- 21,459
- Household income
- $83,160
- Rent vs Own
- Severe rent burden
- 430.0
Population outlook (Bay County) Hauer SSP2
- Today (2025)
- 206,264 people
- By 2030
- 217,740 · +5.6%
- By 2040
- 238,738 · +15.7%
- By 2050
- 255,545 · +23.9%
- By 2075
- 288,295 · +39.8%
- By 2100
- 288,638 · +39.9%
Race, ethnicity, and origin ACS 2023
- Neighborhood character
- Predominantly White (75%)
- Race & ethnicity
- White 75% Two or more races 11% Hispanic / Latino 10% Black 6% Asian 3%
- Hispanic origin (detail)
- Mexican 2% Puerto Rican 2%
- Common ancestry
- Lithuanian 3% Romanian 3% Serbian 2%
- Foreign-born
- 10% · Canada, Vietnam, South Korea
- Languages at home
- 87% English-only · Spanish 8% Russian/Polish/Slavic 1% Other Indo-European 1%
Political lean MEDSL · Bay
- 2024 margin
- Solid R (+47.4) · D 25.8% · R 73.1% · Other 1.1%
- 2008→2024 swing
- -6.6pp toward R · 2008: -40.7pp · 2024: -47.4pp
- All cycles
- 2024: R+47.4 2020: R+43.5 2016: R+46.3 2012: R+43.6 2008: R+40.7
Not yet ingested
- Civics
- —
Market trends
- HPI YoY
- ▼ -108.08%
- Current HPI
- 263.5418
- Rent YoY
- ▲ 2.52%
- Metro
- Panama City, FL
- State GDP YoY
- ▲ 3.28%
- F500 in state
- 36
Industry mix (Fortune 500 HQ in FL)
| Industry | F500 HQs | Revenue |
|---|---|---|
| Industrial Technology | 2 | $29B |
|
||
| Insurance | 2 | $17B |
|
||
| Retail | 1 | $60B |
|
||
| Technology Distribution | 1 | $58B |
|
||
| Homebuilding | 1 | $35B |
|
||
| Technology Manufacturing | 1 | $35B |
|
||
Price history
+46.3% since first listed18 events — show timeline
- 2026-05-06 Pending — CPARMLS
- 2026-05-05 Listed $255,000 CPARMLS
- 2024-01-31 Sold (Public Records) $275,000 Public Records
- 2024-01-30 Sold (MLS) $275,000 CPARMLS
- 2024-01-23 Pending — CPARMLS
- 2023-12-22 Price Changed $299,000 CPARMLS
- 2023-12-11 Price Changed $330,000 CPARMLS
- 2023-11-02 Listed $345,000 CPARMLS
- 2021-12-14 Listing Removed — CPARMLS
- 2019-07-26 Sold (Public Records) $228,500 Public Records
- 2019-07-26 Sold (MLS) $228,500 CPARMLS
- 2019-05-27 Listed $228,500 CPARMLS
- 2018-05-16 Sold (Public Records) $197,000 Public Records
- 2018-05-15 Sold (MLS) $197,000 CPARMLS
- 2018-04-10 Listed $200,000 CPARMLS
- 2014-07-07 Listed $173,000 CPARMLS
- 2005-08-05 Sold (MLS) $174,259 CPARMLS
- 2004-11-30 Listed $174,259 CPARMLS
Property tax history
+1.6%/yrLatest (2025): $1,932 · -50.1% YoY. Source: county tax records.
Cash-flow waterfall
monthlySold comps — $/sqft
last 12 mo · ≤1 miLoading sold comps…