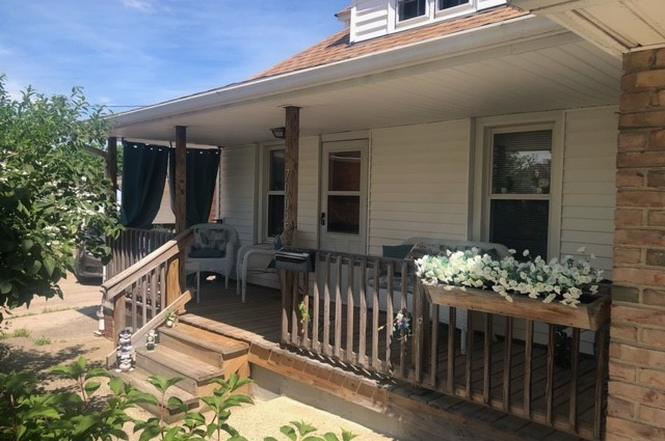
7002 Flowerdale Ave · Cleveland, OH
Flood risk 1/10 · Minimal
- FEMA flood zone
- X (unshaded)
- Chance of flooding over 30 yrs
- 0.0%
- Est. flood insurance / yr
- $473 – $860
Fire risk 1/10 · Minimal
- Est. fire insurance / yr
- $713 – $1,323
Heat risk 3/10 · Minor
- Hot days now (above 95°F)
- 7 days/yr
- Hot days in 30 yrs
- 17 days/yr
Wind risk 1/10 · Minimal
- Chance of severe wind over 30 yrs
- —
Air-quality risk 3/10 · Minor
- Unhealthy air days now
- 2 days/yr
- Unhealthy air days in 30 yrs
- 4 days/yr
Risk factors via First Street. Map © Google.
Why this score? — see what drove the B- grade
The composite is a weighted blend of 9 inputs, each scored 0–100. Each bar is that input's sub-score; the figure is the points it added to the 100-point composite (weight × sub-score).
- Cash flow +22.9/30.0
- ARV discount +15.0/15.0
- DSCR +7.4/10.0
- 1% rule +6.7/10.0
- Schools +5.0/10.0
- Livability +3.6/5.0
- Rent growth +2.5/5.0
- Condition / age +2.5/5.0
- Appreciation +0.0/10.0
$126,900
🖨 Deal sheet 📄 Offer letter ✓ Due diligence
Listing remarks MLS
Nice Clean Recently Painted interior in Neutral Colors, Some newer Windows, Attached Garage but no entrance direct into house, 2 Driveways
Key facts
- First-floor bedroom
- Attached garage
- Full bathroom
Tags
Property features AI
Finance
- Financial info: Annual taxes listed (see public record)
- HOA & community: Access to public transportation
Exterior
- Parking: Attached 1-car garage; Driveway parking; Paved parking
- Utilities: Public water; Public sewer
- Home design: 2-story home; Brick/mortar foundation; Home warranty included
- Construction: Built (year per public records); Aluminum siding; Brick veneer; Stone veneer; Asphalt/fiberglass roof
- Exterior features: Front porch; Lot approximately 0.12 acres (52 x 100)
Interior
- Bedrooms: 1 main-level bedroom
- Bathrooms: 1 full bathroom (main level)
- Heating & cooling: Forced air heating (gas); Ceiling fans; Window cooling units
- Interior features: Full, unfinished basement; 6 total rooms
- Laundry & utility: Laundry in basement
Neighborhood map
What this means for you Summary
Snapshot
- This is a 3-bed/1.0-bath single-family listed at $127k.
Deal economics
- At list price, monthly cash flow is $223 ($3k/yr) — positive.
- The deal already cash-flows at list — no discount required.
- Meets the 1% rule at list price ($1k rent vs $127k).
- Cap rate 8.4% vs local median 3.6% in Cleveland — top-decile yield for the area; either an underpriced asset or a hidden risk that comps aren't pricing in. Stress-test before assuming the spread holds.
Location & tenants
- Location reads 71/100 on livability (#403 in OH) — a middle-class / working-renter tenant base. Strengths: amenities A+, cost of living A+, housing A+; Watch: schools D-, crime F, employment F.
- Market conditions: 35 active listings in the ZIP; 12 comparable units currently listed for rent nearby; rentals leasing fast (median 7d on market — plan ~1-2 weeks tenant-placement turnaround); 1,441 units permitted in Cuyahoga County in 2024 (700 in 5+ unit buildings).
Forward outlook
- Local home prices are declining (-3.0%/yr); year-one equity from $877 of loan paydown is wiped out by about $4k of value loss. Plan a longer hold.
- Cuyahoga County population projected to shrink 8% by 2050 — rents likely to lag national; underwrite the cash flow, not the appreciation.
Negotiation context
- Only 4 days on market — expect competitive offers; lowballing is unlikely to land.
- 2 sale attempts since 10y ago with the ask held roughly flat each time — persistent listings suggest the price (not the market) is what's stuck; bring a comps-based counter.
- Current owner paid $41k; list at $127k implies a 210% gain — meaningful room to come down on a strong offer.
Risks & watch-outs
- Watch-outs: built in 1924 — expect roof / HVAC / electrical / plumbing capex.
Questions for the listing agent
- Built in 1924 — when were the roof, HVAC, electrical panel, plumbing, and water heater last replaced?
- Is there a deadline driving the sale (1031 exchange, divorce, estate, relocation)? That informs how much negotiation room exists.
- Schools are D-rated, which usually means shorter tenancies and higher turnover. Who's the typical renter profile here, and what's been the actual vacancy rate?
- Crime grade is F in this area — have there been break-ins, vandalism, or insurance claims at this property in the last 3 years? What carrier currently insures it and at what premium?
- What's the average days-on-market for RENTAL listings here right now (not sales)? A rising rental-DOM trend means longer vacancies and softer asking-rent achievability than the comps imply.
- What's the recent tenant-quality profile in this submarket — average credit score on applications, eviction rate, late-payment / NSF rate, and stable-employment percentage? A property-management company in the area should have these aggregated.
- How much new for-sale + rental construction is in the pipeline within 1–3 miles? Heavy new supply typically softens prices + rents 12–24 months out; constrained supply supports both.
Investment metrics
- 1% rule
- 1.17% ✓
- Cap rate
- 8.40%
- Cash-on-cash
- 7.53%
- DSCR
- 1.34
- GRM
- 7.1
CMA / ARV
- ARV (on-the-fly)
- $202,124
- Comps found
- 12
Show comp detail 12 sales within ~0.75 mi
| Address | Dist | Beds/Ba | Sqft | Sold | Price | $/sf | Match |
|---|---|---|---|---|---|---|---|
| 7428 Ira Ave | 0.36mi | 3/2.0 | 1,131 (-5%) | 4mo | $240,000 | $212 | 66 |
| 4649 Pelham Dr | 0.42mi | 3/2.5 | 1,153 (-4%) | 4mo | $216,500 | $188 | 65 |
| 6707 Vandalia Ave | 0.21mi | 3/2.5 | 1,328 (+11%) | 3mo | $190,000 | $143 | 63 |
| 7707 Liberty Ave | 0.50mi | 3/1.0 | 1,092 (-9%) | 4mo | $185,000 | $169 | 59 |
| 5515 Merkle Ave | 0.63mi | 3/2.5 | 1,170 (-2%) | 2mo | $262,000 | $224 | 59 |
| 5910 Velma Ave | 0.58mi | 3/1.0 | 1,092 (-9%) | 2mo | $147,900 | $135 | 57 |
| 6707 Laverne Ave | 0.63mi | 3/1.0 | 1,092 (-9%) | 4mo | $157,500 | $144 | 52 |
| 5803 Merkle Ave | 0.58mi | 3/1.5 | 1,057 (-12%) | 1mo | $158,000 | $149 | 51 |
| 4716 Forest Edge Dr | 0.74mi | 3/1.5 | 1,290 (+8%) | 2mo | $255,000 | $198 | 49 |
| 6011 Luelda Ave | 0.63mi | 3/1.0 | 1,054 (-12%) | 5mo | $170,000 | $161 | 47 |
| 5227 W 52nd St | 0.72mi | 3/2.0 | 1,326 (+11%) | 2mo | $220,000 | $166 | 42 |
| 5702 Luelda Ave | 0.67mi | 3/2.0 | 1,062 (-11%) | 4mo | $213,500 | $201 | 42 |
Match score weights: distance 35% · size 25% · config 20% · recency 20%. Top-matched comps best support the ARV.
Projected returns pro-forma
-3.0% appreciation · 3.0% rent growth · sell at horizon
- IRR
- -4.7%
- Equity multiple
- 0.82×
- Total profit
- $-6,289
- Equity at exit
- $18,921
- IRR
- 5.0%
- Equity multiple
- 1.37×
- Total profit
- $13,091
- Equity at exit
- $10,972
Cash invested: $35,532 (down + closing). Projections, not guarantees.
Landlord ↔ Tenant lean methodology
- Overall (STATE)
- 73 Landlord-Friendly
- State Ohio
- 73 Landlord-Friendly · R+6
- County
- — inherits STATE
- City
- — inherits STATE
ZIP-level market 44144
- Active inventory
- 35
- Price-to-rent
- 7.1×
Monthly cashflow live
- Estimated rent
- $1,484 high interval (Pro) →
- Mortgage (P&I)
- −$665
- Tax from tax record
- −$231 /mo · $2,775/yr
- Insurance
- −$53
- HOA
- −$0
- Vacancy / Maint / Mgmt
- −$312
- Net cashflow
- $223
Break-even live
UW: 25.0% down · 7.5% · 30yr · 1.5% tax · 5.0% vac · 8.0% maint · 8.0% mgmt
Financing live
Cash to close
- Down payment
- $31,725
- Closing costs
- $3,807
- Reserves months
- —
- Total cash needed
- —
Loan-product check · same deal, 3 products live
Conventional
25% down · 7.5% · 30yr
- Down + closing
- —
- Monthly P&I
- —
- Monthly cashflow
- —
- DSCR
- —
- Eligible?
- —
Personal DTI + credit; lowest rate.
DSCR
20% down · 8.5% · 30yr
- Down + closing
- —
- Monthly P&I
- —
- Monthly cashflow
- —
- DSCR
- —
- Eligible?
- —
No personal income docs; deal must DSCR.
Hard money
10% down · 12.0% · 12mo
- Down + closing
- —
- Monthly P&I
- —
- Monthly cashflow
- —
- DSCR
- —
- Eligible?
- —
Short-term bridge; refi at stabilization.
Rent comps 12 comps
| Address | Beds | Baths | Sqft | Rent | $/sqft | DOM | Units | Dist |
|---|---|---|---|---|---|---|---|---|
| 6227 Traymore Ave Cleveland, OH | 3.0 | 2.0 | 1221 | $1,575 | $1.29 | 1d | 1 | 0.32mi |
| 6007 Merkle Ave Unit Down Parma, OH | 3.0 | 1.0 | 1250 | $1,399 | $1.12 | 1d | 1 | 0.55mi |
| 5406 Merkle Ave Cleveland, OH | 2.0 | 1.0 | 958 | $1,300 | $1.36 | 7d | 1 | 0.66mi |
| 5406 Merkle Ave Cleveland, OH | 2.0 | 1.0 | 946 | $1,300 | $1.37 | 4d | 1 | 0.66mi |
| 4606 Roadoan Rd Unit 1496094P Brooklyn, OH | 2.0 | 1.5 | 1065 | $3,537 | $3.32 | 14d | 1 | 0.78mi |
| 5252 W 45th St Unit 1496134P Parma, OH | 3.0 | 2.0 | 1065 | $5,388 | $5.06 | 14d | 1 | 0.97mi |
| 5220 W 44th St #2 Parma, OH | 2.0 | 1.0 | 1156 | $1,400 | $1.21 | 23d | 1 | 0.99mi |
| 8326 Fernhill Ave Cleveland, OH | 3.0 | 1.0 | 1350 | $1,700 | $1.26 | 43d | 1 | 1.00mi |
| 4606 Lincoln Ave Cleveland, OH | 3.0 | 2.0 | 1418 | $1,995 | $1.41 | 1d | 1 | 1.06mi |
| 5253 Hauserman Rd Parma, OH | 1.0–2.0 | 1.0 | 755 | $1,150 | $1.52 | 4d | 3 | 1.34mi |
| 6505 Snow Rd Unit REAR Parma, OH | 3.0 | 1.5 | 1312 | $1,599 | $1.22 | 7d | 1 | 1.35mi |
| 4000 Westbrook Dr Cleveland, OH | 1.0–2.0 | 1.0–2.0 | 882 | $1,103 | $1.25 | 1d | 1 | 1.44mi |
Listing history 5 events
-
2026-06-16status $126,900 Pending 4 DOM
-
2026-06-15days on market $126,900 Active 4 DOM
-
2026-06-13days on market $126,900 Active 2 DOM
-
2026-06-13remarks 699-char remark
-
2026-06-13$126,900 Active 1 DOM
ⓘ Source: listings_history table (triggers on properties + properties_extension) + one-shot
backfill from property_details.listing_events for pre-trigger history.
Tax reassessment forecast OH · Partial reset (capped growth)
- Current annual tax
- $2,775 · $231/mo
- Projected year-2 tax
- $2,775 · $231/mo
- Expected delta
- $0/yr ($0/mo · 0.0%)
ⓘ Screening estimate from a state-policy table — verify with the county assessor before closing.
Climate risk First Street
- Flood 1/10 Low FEMA zone X (unshaded) · 0% chance over 30 yrs
- Wildfire 1/10 Low
- Heat 3/10 Moderate 7 d/yr ≥95°F today · 17 d/yr by 30 yrs out
- Wind 1/10 Low
- Air quality 3/10 Moderate 2 unhealthy d/yr today · 4 by 30 yrs out
Nearby sold comps map
Loading sold comps map…
Walkable amenities ~0.75 mi
Loading nearby amenities…
Taxation est. · year 1
- Rental income
- $17,813
- − Mortgage interest
- −$7,108
- − Property taxes
- −$2,775
- − Insurance
- −$634
- − Repairs & maintenance
- −$1,425
- − Management
- −$1,425
- − Depreciation
- −$3,692
- Taxable income
- $753
- Est. tax owed @ 24.0%
- −$181
- After-tax cash flow
- $2,496/yr
For passive investors: Depreciation is non-cash, so a rental often shows a tax loss while cash-flowing — sheltering income. Rental losses are passive: they offset passive income freely, and up to $25,000/yr can offset ordinary (W-2) income if you actively participate and your MAGI is under $100k (phasing out to $0 by $150k); unused losses carry forward. On sale, claimed depreciation is recaptured at up to 25%, and gains may owe capital-gains tax (a 1031 exchange can defer both). Figures are a year-1 estimate at your 24.0% rate — not tax advice; consult a CPA.
Schools (NCES district)
No district data.
Livability — Cleveland
- Score
- 71/100
- State rank
- #403
- US rank
- #6673
Category grades
Schools grade is shown separately in the Schools card above.
Census & demographics
- Census place
- Cleveland, OH
- County
- Cuyahoga County · 1,090,369 people
- City population
- 326,883
- Metro
- Cleveland-Elyria, OH
- Population (ZIP)
- 21,394
- Household income
- $60,223
- Rent vs Own
- Severe rent burden
- 644.0
Population outlook (Cuyahoga County) Hauer SSP2
- Today (2025)
- 1,244,621 people
- By 2030
- 1,230,093 · -1.2%
- By 2040
- 1,189,108 · -4.5%
- By 2050
- 1,145,706 · -7.9%
- By 2075
- 1,076,557 · -13.5%
- By 2100
- 978,987 · -21.3%
Race, ethnicity, and origin ACS 2023
- Neighborhood character
- Diverse neighborhood (Simpson 0.59)
- Race & ethnicity
- White 60% Hispanic / Latino 21% Two or more races 10% Black 9% Asian 6%
- Hispanic origin (detail)
- Mexican 3% Puerto Rican 14% Dominican 1%
- Common ancestry
- Romanian 7% Subsaharan African 2% Slovak 2%
- Foreign-born
- 11% · Canada, India, South Korea
- Languages at home
- 75% English-only · Spanish 14% Other Indo-European 4% Russian/Polish/Slavic 2%
Political lean MEDSL · Cuyahoga
- 2024 margin
- Solid D (+31.5) · D 65.4% · R 33.9%
- 2008→2024 swing
- -7.4pp toward R · 2008: 38.9pp · 2024: 31.5pp
- All cycles
- 2024: D+31.5 2020: D+34.1 2016: D+35.0 2012: D+38.7 2008: D+38.9
Not yet ingested
- Civics
- —
Market trends
- HPI YoY
- ▼ -143.16%
- Current HPI
- 195.4778
- Rent YoY
- —
- Metro
- Cleveland-Elyria, OH
- State GDP YoY
- ▲ 1.98%
- F500 in state
- 48
Industry mix (Fortune 500 HQ in OH)
| Industry | F500 HQs | Revenue |
|---|---|---|
| Insurance | 3 | $145B |
|
||
| Industrial Machinery | 3 | $49B |
|
||
| Financial Services | 3 | $24B |
|
||
| Consumer Goods | 2 | $93B |
|
||
| Aerospace / Defense | 2 | $47B |
|
||
| Utilities | 2 | $33B |
|
||
Price history
+154.3% since first listed5 events — show timeline
- 2026-06-11 Listed $126,900 MLSNOW
- 2016-12-05 Sold (MLS) $41,000 MLSNOW
- 2016-11-28 Pending — MLSNOW
- 2016-10-24 Contingent — MLSNOW
- 2016-10-18 Listed $49,900 MLSNOW
Property tax history
+5.2%/yrLatest (2025): $2,775 · +0.0% YoY. Source: county tax records.
Cash-flow waterfall
monthlySold comps — $/sqft
last 12 mo · ≤1 miLoading sold comps…