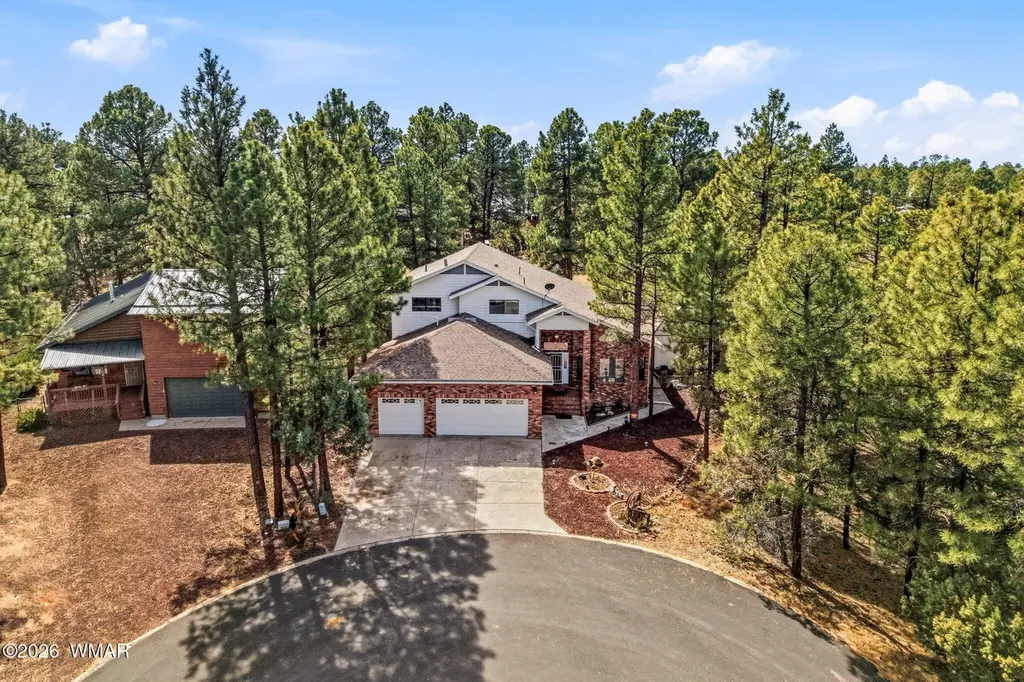
320 N 34th Dr · Show Low, AZ
Flood risk 1/10 · Minimal
- FEMA flood zone
- X (unshaded)
- Chance of flooding over 30 yrs
- 0.0%
- Est. flood insurance / yr
- $507 – $1,088
Fire risk 6/10 · Moderate
- Est. fire insurance / yr
- $610 – $1,132
Heat risk 2/10 · Minimal
- Hot days now (above 89°F)
- 7 days/yr
- Hot days in 30 yrs
- 19 days/yr
Wind risk 1/10 · Minimal
- Chance of severe wind over 30 yrs
- —
Air-quality risk 2/10 · Minimal
- Unhealthy air days now
- 1 days/yr
- Unhealthy air days in 30 yrs
- 1 days/yr
Risk factors via First Street. Map © Google.
Why this score? — see what drove the C- grade
The composite is a weighted blend of 9 inputs, each scored 0–100. Each bar is that input's sub-score; the figure is the points it added to the 100-point composite (weight × sub-score).
- Cash flow +20.5/30.0
- ARV discount +12.0/15.0
- DSCR +6.5/10.0
- 1% rule +4.3/10.0
- Livability +3.2/5.0
- Schools +3.0/10.0
- Rent growth +2.5/5.0
- Condition / age +2.5/5.0
- Appreciation +0.0/10.0
$749,000
🖨 Deal sheet 📄 Offer letter ✓ Due diligence
Listing remarks MLS
Golf course living with space for everyone! This 3,200+ sq ft home has 5 bedrooms, 3.5 baths plus half bath in the garage, & a desirable layout. The main level features open-concept living area with soaring ceilings & abundant natural light, along with the primary suite with walk-in closet, dual vanities, jetted tub, & separate shower. A second bedroom, full bath, & large laundry room are also on the main level. Upstairs includes three additional bedrooms, two with a Jack-&-Jill bath & a fifth bedroom with ensuite & attached bonus room--ideal for an office, nursery, or storage. Large 3 car garage! The exterior has a screened deck, fenced yard, tall pines, & no HOA. A 15x24 detached building with mini split offers great potential for a game room, man cave, she-shack or modify into a guest
Key facts
- Dual vanities
- Walk-in closet
- Primary suite
Tags
Neighborhood map
What this means for you Summary
Snapshot
- This is a 5-bed/3.5-bath single-family listed at $749k.
Deal economics
- At list price, monthly cash flow is $993 ($12k/yr) — positive.
- The deal already cash-flows at list — no discount required.
- To meet the 1% rule (rent ≥ 1% of price), the offer needs to be $700k (6.5% below list).
- Recommended offer: $682k (9.0% below list) — sets the bar for market timing.
- Cap rate 7.9% vs local median 3.3% in Show Low — top-decile yield for the area; either an underpriced asset or a hidden risk that comps aren't pricing in. Stress-test before assuming the spread holds.
Location & tenants
- Location reads 65/100 on livability (#90 in AZ) — a middle-class / working-renter tenant base. Strengths: cost of living A+, housing A+; Watch: employment D, crime F, amenities F.
- Show Low Unified District (4393) (rural): math 32% / reading 39% proficiency, ranked #89 of 249 in AZ (top 36%) — families likely to look elsewhere, expect single-tenant / working-renter base with shorter leases.
- Market conditions: 891 active listings in the ZIP; 1 comparable units currently listed for rent nearby; 485 units permitted in Navajo County in 2024 (11 in 5+ unit buildings).
Forward outlook
- Local home prices are declining (-3.0%/yr); year-one equity from $5k of loan paydown is wiped out by about $22k of value loss. Plan a longer hold.
- Navajo County population projected at -16% by 2050 — secular population decline; favor cash flow + early exit over multi-decade hold.
Negotiation context
- It's been on market 107 days — a 9% lower offer ($682k) is reasonable based on typical stale-listing flexibility.
- Current owner paid $318k; list at $749k implies a 136% gain — meaningful room to come down on a strong offer.
Risks & watch-outs
- Climate carrying-cost: major wildfire risk — expect insurance premiums to compound above CPI over the hold.
Questions for the listing agent
- It's been on market 107 days. Have you received any prior offers? Is the seller open to a 9% concession, seller financing, or rate buy-down credit?
- Why hasn't it sold? Are there any deal-killer items the seller is aware of (foundation, flood, title, zoning, code violations)?
- Is there a deadline driving the sale (1031 exchange, divorce, estate, relocation)? That informs how much negotiation room exists.
- Schools are B-rated — typically a magnet for longer-tenancy family renters. What's the average tenant stay here, and is there a school-zone premium baked into asking?
- Crime grade is F in this area — have there been break-ins, vandalism, or insurance claims at this property in the last 3 years? What carrier currently insures it and at what premium?
- What's the average days-on-market for RENTAL listings here right now (not sales)? A rising rental-DOM trend means longer vacancies and softer asking-rent achievability than the comps imply.
- What's the recent tenant-quality profile in this submarket — average credit score on applications, eviction rate, late-payment / NSF rate, and stable-employment percentage? A property-management company in the area should have these aggregated.
- How much new for-sale + rental construction is in the pipeline within 1–3 miles? Heavy new supply typically softens prices + rents 12–24 months out; constrained supply supports both.
Investment metrics
- 1% rule
- 0.93% ✗
- Cap rate
- 7.88%
- Cash-on-cash
- 5.68%
- DSCR
- 1.25
- GRM
- 8.9
CMA / ARV
- ARV (median comp)
- $832,465
- List price
- $749,000
- Delta
- -10.03%
- Verdict
- UNDERPRICED
- Comps
- 20 within 1.0 mi
Show comp detail 10 sales within ~0.75 mi
| Address | Dist | Beds/Ba | Sqft | Sold | Price | $/sf | Match |
|---|---|---|---|---|---|---|---|
| 3401 W Hansen -- | 0.35mi | 4/3.0 (-1) | 3,245 (-0%) | 10mo | $560,000 | $173 | 68 |
| 710 N 39th Dr | 0.43mi | 5/3.5 | 3,422 (+5%) | 10mo | $830,000 | $243 | 63 |
| 3031 W Alpine Ridge Rd | 0.54mi | 4/3.0 (-1) | 3,038 (-7%) | 2mo | $885,000 | $291 | 54 |
| 3591 W Fairway Ct | 0.64mi | 5/3.0 | 3,093 (-5%) | 8mo | $839,333 | $271 | 53 |
| 101 S Falling Leaf Rd | 0.51mi | 4/4.0 (-1) | 3,081 (-6%) | 17mo | $1,150,000 | $373 | 46 |
| 2400 W Bench Rd | 0.56mi | 4/3.0 (-1) | 2,867 (-12%) | 4mo | $1,000,000 | $349 | 44 |
| 4270 W Sugar Pine Loop | 0.68mi | 4/4.0 (-1) | 3,372 (+4%) | 16mo | $1,125,000 | $334 | 43 |
| 4191 W Hawthorn Rd | 0.62mi | 5/4.0 | 3,495 (+7%) | 21mo | $1,140,000 | $326 | 39 |
| 20 S Golden Rod Ln | 0.69mi | 5/4.0 | 2,954 (-9%) | 18mo | $985,000 | $333 | 35 |
| 1260 N 36th Dr | 0.67mi | 4/4.0 (-1) | 2,984 (-8%) | 21mo | $390,000 | $131 | 30 |
Match score weights: distance 35% · size 25% · config 20% · recency 20%. Top-matched comps best support the ARV.
Projected returns pro-forma
-3.0% appreciation · 3.0% rent growth · sell at horizon
- IRR
- -7.6%
- Equity multiple
- 0.72×
- Total profit
- $-58,424
- Equity at exit
- $111,678
- IRR
- 2.0%
- Equity multiple
- 1.14×
- Total profit
- $29,381
- Equity at exit
- $64,760
Cash invested: $209,720 (down + closing). Projections, not guarantees.
Landlord ↔ Tenant lean methodology
- Overall (STATE)
- 87 Strongly Landlord-Friendly
- State Arizona
- 87 Strongly Landlord-Friendly · R+3
- County
- — inherits STATE
- City
- — inherits STATE
ZIP-level market 85901
- Home prices YoY
- -14.5%
- Active inventory
- 891
- Price-to-rent
- 8.9×
Monthly cashflow live
- Estimated rent
- $7,000 medium interval (Pro) →
- Mortgage (P&I)
- −$3,928
- Tax from tax record
- −$297 /mo · $3,567/yr
- Insurance
- −$312
- HOA
- −$0
- Vacancy / Maint / Mgmt
- −$1,470
- Net cashflow
- $993
Break-even live
UW: 25.0% down · 7.5% · 30yr · 1.5% tax · 5.0% vac · 8.0% maint · 8.0% mgmt
Financing live
Cash to close
- Down payment
- $187,250
- Closing costs
- $22,470
- Reserves months
- —
- Total cash needed
- —
Loan-product check · same deal, 3 products live
Conventional
25% down · 7.5% · 30yr
- Down + closing
- —
- Monthly P&I
- —
- Monthly cashflow
- —
- DSCR
- —
- Eligible?
- —
Personal DTI + credit; lowest rate.
DSCR
20% down · 8.5% · 30yr
- Down + closing
- —
- Monthly P&I
- —
- Monthly cashflow
- —
- DSCR
- —
- Eligible?
- —
No personal income docs; deal must DSCR.
Hard money
10% down · 12.0% · 12mo
- Down + closing
- —
- Monthly P&I
- —
- Monthly cashflow
- —
- DSCR
- —
- Eligible?
- —
Short-term bridge; refi at stabilization.
Rent comps 1 comps
| Address | Beds | Baths | Sqft | Rent | $/sqft | DOM | Units | Dist |
|---|---|---|---|---|---|---|---|---|
| 4500 W Hackberry Ln #161 Show Low, AZ | 4.0 | 3.5 | 2761 | $7,000 | $2.54 | 43d | 1 | 0.93mi |
Listing history 22 events
-
2026-06-19days on market $749,000 Active 107 DOM
-
2026-06-18days on market $749,000 Active 106 DOM
-
2026-06-17days on market $749,000 Active 105 DOM
-
2026-06-16days on market $749,000 Active 104 DOM
-
2026-06-15days on market $749,000 Active 103 DOM
-
2026-06-14days on market $749,000 Active 101 DOM
-
2026-06-12days on market $749,000 Active 100 DOM
-
2026-06-09days on market $749,000 Active 97 DOM
-
2026-06-08days on market $749,000 Active 96 DOM
-
2026-06-07days on market $749,000 Active 95 DOM
-
2026-06-07days on market $749,000 Active 94 DOM
-
2026-06-04days on market $749,000 Active 91 DOM
-
2026-06-02days on market $749,000 Active 90 DOM
-
2026-06-01days on market $749,000 Active 89 DOM
-
2026-05-31days on market $749,000 Active 88 DOM
-
2026-05-31days on market $749,000 Active 87 DOM
-
2026-03-04$799,000 Active 832-char remark
Show marketing remark (832 chars)
Golf course living with space for everyone! This 3,200+ sq ft home has 5 bedrooms, 3.5 baths plus half bath in the garage, & a desirable layout. The main level features open-concept living area with soaring ceilings & abundant natural light, along with the primary suite with walk-in closet, dual vanities, jetted tub, & separate shower. A second bedroom, full bath, & large laundry room are also on the main level. Upstairs includes three additional bedrooms, two with a Jack-&-Jill bath & a fifth bedroom with ensuite & attached bonus room--ideal for an office, nursery, or storage. Large 3 car garage! The exterior has a screened deck, fenced yard, tall pines, & no HOA. A 15x24 detached building with mini split offers great potential for a game room, man cave, she-shack or modify into a guest
-
2022-04-05price $889,000
-
2013-10-30soldstatus $318,000
-
2013-10-30soldstatus $318,000
-
1995-11-13soldstatus $36,000
-
1994-09-29soldstatus $32,000
ⓘ Source: listings_history table (triggers on properties + properties_extension) + one-shot
backfill from property_details.listing_events for pre-trigger history.
Tax reassessment forecast AZ · Resets to sale price
- Current annual tax
- $3,567 · $297/mo
- Projected year-2 tax
- $4,943 · $412/mo
- Expected delta
- +$1,376/yr (+$115/mo · 38.6%)
ⓘ Screening estimate from a state-policy table — verify with the county assessor before closing.
Climate risk First Street
- Flood 1/10 Low FEMA zone X (unshaded) · 0% chance over 30 yrs
- Wildfire 6/10 Major
- Heat 2/10 Low 7 d/yr ≥89°F today · 19 d/yr by 30 yrs out
- Wind 1/10 Low
- Air quality 2/10 Low 1 unhealthy d/yr today · 1 by 30 yrs out
Nearby sold comps map
Loading sold comps map…
Walkable amenities ~0.75 mi
Loading nearby amenities…
Taxation est. · year 1
- Rental income
- $84,000
- − Mortgage interest
- −$41,956
- − Property taxes
- −$3,567
- − Insurance
- −$3,745
- − Repairs & maintenance
- −$6,720
- − Management
- −$6,720
- − Depreciation
- −$21,789
- Taxable loss
- −$497
- Est. tax savings @ 24.0%
- +$119
- After-tax cash flow
- $12,033/yr
For passive investors: Depreciation is non-cash, so a rental often shows a tax loss while cash-flowing — sheltering income. Rental losses are passive: they offset passive income freely, and up to $25,000/yr can offset ordinary (W-2) income if you actively participate and your MAGI is under $100k (phasing out to $0 by $150k); unused losses carry forward. On sale, claimed depreciation is recaptured at up to 25%, and gains may owe capital-gains tax (a 1031 exchange can defer both). Figures are a year-1 estimate at your 24.0% rate — not tax advice; consult a CPA.
Schools (NCES district)
- District
- Show Low Unified District (4393)
- NCES district ID
- 0407700
- Math proficiency
- 32% ▼ -9.00%
- Reading proficiency
- 39% ▼ -4.00%
- Median HH income
- $41,240
- Composite
- 29.9/100
- National rank
- #6387
- State rank
- #89 of 249 in AZ
Livability — Show Low
- Score
- 65/100
- State rank
- #90
- US rank
- #13573
Category grades
Schools grade is shown separately in the Schools card above.
Census & demographics
- Census place
- Show Low, AZ
- City population
- 18,821
- Population (ZIP)
- 18,821
Population outlook (Navajo County) Hauer SSP2
- Today (2025)
- 105,760 people
- By 2030
- 103,301 · -2.3%
- By 2040
- 97,070 · -8.2%
- By 2050
- 88,850 · -16.0%
- By 2075
- 65,180 · -38.4%
- By 2100
- 37,281 · -64.7%
Race, ethnicity, and origin ACS 2023
- Neighborhood character
- Predominantly White (77%)
- Race & ethnicity
- White 77% Hispanic / Latino 16% Two or more races 11% Native American 2%
- Hispanic origin (detail)
- Mexican 12%
- Common ancestry
- Slovak 2% Lithuanian 2% Italian 2%
- Foreign-born
- 4% · Canada
- Languages at home
- 92% English-only · Spanish 7% Tagalog/Filipino 1%
Political lean MEDSL · Navajo
- 2024 margin
- R (+17.2) · D 40.9% · R 58.1%
- 2008→2024 swing
- -5.5pp toward R · 2008: -11.7pp · 2024: -17.2pp
- All cycles
- 2024: R+17.2 2020: R+8.2 2016: R+7.9 2012: R+8.4 2008: R+11.7
Not yet ingested
- Civics
- —
Market trends
- HPI YoY
- ▼ -65.52%
- Current HPI
- 386.3007
- Rent YoY
- —
- Metro
- —
- State GDP YoY
- ▲ 4.54%
- F500 in state
- 20
Industry mix (Fortune 500 HQ in AZ)
| Industry | F500 HQs | Revenue |
|---|---|---|
| Technology | 2 | $13B |
|
||
| Mining / Metals | 1 | $23B |
|
||
| Environmental Services | 1 | $16B |
|
||
| Metals / Steel | 1 | $14B |
|
||
| Technology Distribution | 1 | $9B |
|
||
| Homebuilding | 1 | $8B |
|
||
Price history
+2396.9% since first listed6 events — show timeline
- 2026-03-04 Listed $799,000 WMMLS
- 2022-04-05 Price Changed $889,000 WMMLS
- 2013-10-30 Sold (Public Records) $318,000 Public Records
- 2013-10-30 Sold (MLS) $318,000 WMMLS
- 1995-11-13 Sold (Public Records) $36,000 Public Records
- 1994-09-29 Sold (Public Records) $32,000 Public Records
Property tax history
+4.1%/yrLatest (2025): $3,567 · +4.8% YoY. Source: county tax records.
Cash-flow waterfall
monthlySold comps — $/sqft
last 12 mo · ≤1 miLoading sold comps…