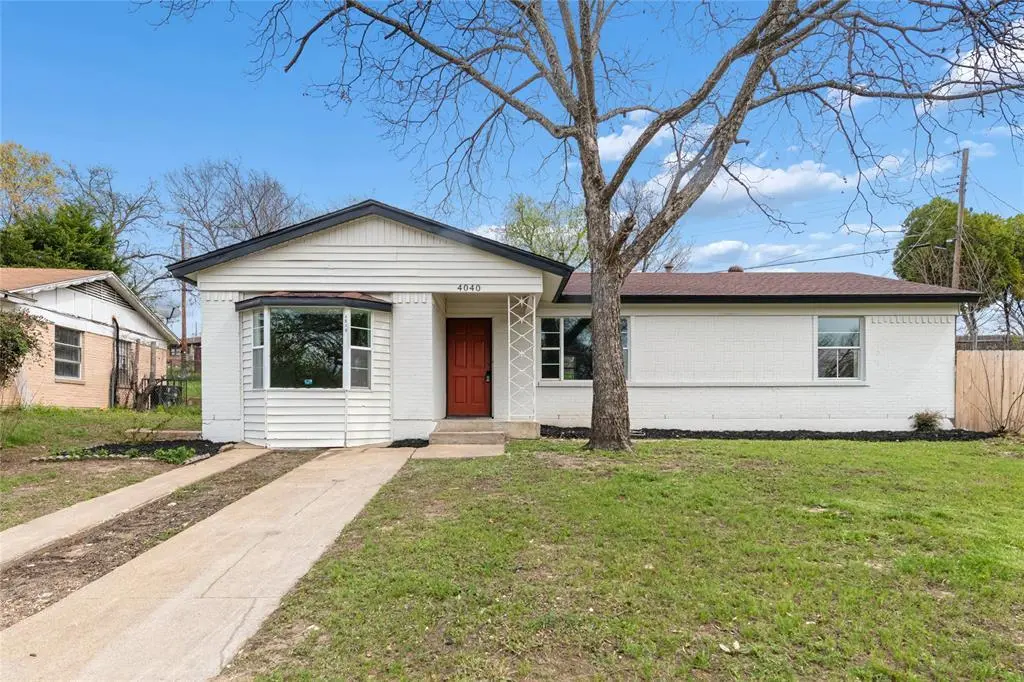
4040 Wind River Dr · Dallas, TX
Flood risk 1/10 · Minimal
- FEMA flood zone
- X (unshaded)
- Chance of flooding over 30 yrs
- 0.0%
- Est. flood insurance / yr
- $507 – $1,088
Fire risk 1/10 · Minimal
- Est. fire insurance / yr
- $1,222 – $2,270
Heat risk 7/10 · Major
- Hot days now (above 110°F)
- 7 days/yr
- Hot days in 30 yrs
- 25 days/yr
Wind risk 6/10 · Moderate
- Chance of severe wind over 30 yrs
- 27.0%
Air-quality risk 2/10 · Minimal
- Unhealthy air days now
- 1 days/yr
- Unhealthy air days in 30 yrs
- 2 days/yr
Risk factors via First Street. Map © Google.
Why this score? — see what drove the F grade
The composite is a weighted blend of 9 inputs, each scored 0–100. Each bar is that input's sub-score; the figure is the points it added to the 100-point composite (weight × sub-score).
- Cash flow +9.5/30.0
- ARV discount +5.9/15.0
- Livability +4.0/5.0
- Rent growth +3.6/5.0
- 1% rule +3.2/10.0
- Schools +2.8/10.0
- DSCR +2.7/10.0
- Condition / age +2.5/5.0
- Appreciation +0.0/10.0
$243,000
🖨 Deal sheet 📄 Offer letter ✓ Due diligence
Listing remarks
BEAUTIFULLY RENOVATED HOME nestled in Dallas! This stunning 4-bedroom, 2-bath home offers modern style and comfortable living in one perfect package. The spacious open-concept floor plan is ideal for both relaxing and entertaining, featuring luxury vinyl plank flooring throughout the main areas. The fully updated kitchen shines with 42-inch cabinets, sleek quartz countertops, and modern appliances, while fresh interior and exterior paint give the entire home a bright, move-in-ready feel. A sunroom adds incredible versatility as a bonus space, perfect for a playroom. Enjoy peaceful surroundings with easy access to shopping, dining, and everything Downtown Dallas has to offer—schedule y
Key facts
- Quartz countertops
- 42-inch cabinets
- Modern appliances
Tags
Property features AI
Finance
- Other: No known restrictions
- Financial info: Treat as clear loan type; No second mortgage indicated
- HOA & community: No association
Exterior
- Parking: Driveway (no garage, no covered or carport spaces listed)
- Security: Owned security system; Smoke detector(s)
- Utilities: City water; City sewer; Electricity connected; Individual gas meter; Individual water meter; No municipal utility district
- Home design: Single family residence; One story; Residential property; Not attached to other units
- Construction: Built in 1956; Asphalt shingle roof; Concrete perimeter foundation; Slab foundation
- Exterior features: Lot less than 0.5 acre; Subdivision: MARSALIS PARK 2; See GPS for directions
Interior
- Kitchen: Granite countertops; Built-in cabinets; Dishwasher; Disposal; Electric cooktop; Electric oven; Microwave; Gas water heater
- Bedrooms: 4 bedrooms (all on the main level); Primary bedroom with ensuite bath and walk-in closet (17 x 10); Bedroom (11 x 13); Bedroom (10 x 10); Bedroom (10 x 10)
- Flooring: Carpet; Luxury vinyl plank
- Bathrooms: 2 full bathrooms
- Heating & cooling: Central heating; Central air; Ceiling fan(s)
- Interior features: Built-in features; Granite counters; Open floorplan; Walk-in closet(s); One living area; One dining area; 7 total rooms; Living room (17 x 11)
- Laundry & utility: No dedicated laundry appliances listed
Neighborhood map
What this means for you Summary
Snapshot
- This is a 3-bed/1.0-bath single-family listed at $243k.
Deal economics
- At list price, monthly cash flow is $-170 ($-2k/yr) — negative.
- To cash-flow at today's rent, offer at most $213k (12.4% below list).
- To meet the 1% rule (rent ≥ 1% of price), the offer needs to be $199k (18.0% below list).
- Recommended offer: $199k (18.0% below list) — sets the bar for 1% rule.
- Cap rate 5.5% vs local median 2.3% in Dallas — top-decile yield for the area; either an underpriced asset or a hidden risk that comps aren't pricing in. Stress-test before assuming the spread holds.
Location & tenants
- Location reads 81/100 on livability (#24 in TX, #1,380 nationally) — a professional / high-income tenant draw. Strengths: amenities A+, commute A+, housing A+; Watch: crime F.
- Dallas ISD (urban): math 31% / reading 36% proficiency, ranked #559 of 826 in TX (top 68%) — families likely to look elsewhere, expect single-tenant / working-renter base with shorter leases; 83% free/reduced lunch — lower-income household profile, screen leases tightly.
- Zoned schools: Clara Oliver El (math 27% / reading 37%, grade F, #2,268 of 4,322 statewide, top 55%, 204 students, 92% FRL).
- Market conditions: Rents rising fast (+4.2%/yr); 249 active listings in the ZIP; 30 comparable units currently listed for rent nearby; rentals at typical pace (median 15d on market — plan ~3-4 weeks tenant-placement turnaround); lower-income renter base — watch delinquency; 12,577 units permitted in Dallas County in 2024 (6,829 in 5+ unit buildings).
- At $1,993/mo this rent would consume 58% of the median local household income ($41k/yr) (locally 2465% of renters already pay >50% of income on rent) — very limited rent-growth headroom before tenants either downsize or default.
Forward outlook
- Local home prices are declining (-3.0%/yr); year-one equity from $2k of loan paydown is wiped out by about $7k of value loss. Plan a longer hold.
- Dallas County population projected at +35% by 2050 — long-run rental-demand tailwind backs the buy-and-hold thesis.
Negotiation context
- It's been on market 43 days — a 3% lower offer ($236k) is reasonable based on typical stale-listing flexibility.
Risks & watch-outs
- Watch-outs: built in 1956 — expect roof / HVAC / electrical / plumbing capex.
- Climate carrying-cost: major wind risk, 27% chance of damaging wind over 30y; extreme-heat days projected 7→25/yr by 2055 (HVAC capex compounding) — expect insurance premiums to compound above CPI over the hold.
Questions for the listing agent
- What do current leases actually rent for vs. the listed asking? Can we see a recent rent roll and the last 12 months of T-12 income?
- It's been on market 43 days. Have you received any prior offers? Is the seller open to a 18% concession, seller financing, or rate buy-down credit?
- Built in 1956 — when were the roof, HVAC, electrical panel, plumbing, and water heater last replaced?
- Is there a deadline driving the sale (1031 exchange, divorce, estate, relocation)? That informs how much negotiation room exists.
- Crime grade is F in this area — have there been break-ins, vandalism, or insurance claims at this property in the last 3 years? What carrier currently insures it and at what premium?
- The area grade is low — what's the realistic commute time and amenity access for the typical tenant pool here? Any planned neighborhood developments (good or bad) we should know about?
- What's the average days-on-market for RENTAL listings here right now (not sales)? A rising rental-DOM trend means longer vacancies and softer asking-rent achievability than the comps imply.
- What's the recent tenant-quality profile in this submarket — average credit score on applications, eviction rate, late-payment / NSF rate, and stable-employment percentage? A property-management company in the area should have these aggregated.
- How much new for-sale + rental construction is in the pipeline within 1–3 miles? Heavy new supply typically softens prices + rents 12–24 months out; constrained supply supports both.
Investment metrics
- 1% rule
- 0.82% ✗
- Cap rate
- 5.45%
- Cash-on-cash
- -3.00%
- DSCR
- 0.87
- GRM
- 10.2
CMA / ARV
- ARV (on-the-fly)
- $234,490
- Comps found
- 12
Show comp detail 12 sales within ~0.75 mi
| Address | Dist | Beds/Ba | Sqft | Sold | Price | $/sf | Match |
|---|---|---|---|---|---|---|---|
| 3916 Vanette Ln | 0.14mi | 3/2.0 | 1,328 (+1%) | 6mo | $280,000 | $211 | 82 |
| 4045 Wind River Dr | 0.03mi | 4/2.0 (+1) | 1,355 (+3%) | 4mo | $249,990 | $184 | 80 |
| 3924 Vanette Ln | 0.13mi | 3/2.0 | 1,196 (-9%) | 2mo | $260,000 | $217 | 74 |
| 4009 Summitt Ridge Dr | 0.13mi | 3/2.0 | 1,416 (+8%) | 7mo | $249,900 | $176 | 71 |
| 1226 Grinnell St | 0.70mi | 3/1.5 | 1,314 (+0%) | 2mo | $175,000 | $133 | 63 |
| 4231 Maryland Ave | 0.38mi | 3/1.0 | 1,160 (-12%) | 4mo | $137,000 | $118 | 60 |
| 4417 Utah Ave | 0.67mi | 3/1.0 | 1,246 (-5%) | 2mo | $189,900 | $152 | 59 |
| 4507 S Ewing Ave | 0.64mi | 4/2.0 (+1) | 1,336 (+2%) | 5mo | $249,900 | $187 | 54 |
| 3535 Michigan Ave | 0.39mi | 3/2.0 | 1,150 (-12%) | 10mo | $250,000 | $217 | 50 |
| 3811 Malden Ln | 0.71mi | 4/2.0 (+1) | 1,400 (+7%) | 2mo | $250,000 | $179 | 45 |
| 3715 Kushla Ave | 0.64mi | 4/2.0 (+1) | 1,476 (+13%) | 8mo | $255,000 | $173 | 34 |
| 3413 Utah Ave | 0.75mi | 4/2.0 (+1) | 1,147 (-12%) | 10mo | $205,000 | $179 | 27 |
Match score weights: distance 35% · size 25% · config 20% · recency 20%. Top-matched comps best support the ARV.
Projected returns pro-forma
-3.0% appreciation · 4.2% rent growth · sell at horizon
- IRR
- -19.9%
- Equity multiple
- 0.30×
- Total profit
- $-47,705
- Equity at exit
- $36,232
- IRR
- -10.3%
- Equity multiple
- 0.34×
- Total profit
- $-44,968
- Equity at exit
- $21,010
Cash invested: $68,040 (down + closing). Projections, not guarantees.
Landlord ↔ Tenant lean methodology
- Overall (STATE)
- 87 Strongly Landlord-Friendly
- State Texas
- 87 Strongly Landlord-Friendly · R+5
- County
- — inherits STATE
- City
- — inherits STATE
ZIP-level market 75216
- Home prices YoY
- -29.7%
- Rents YoY
- 4.2%
- Active inventory
- 249
- Price-to-rent
- 10.2×
Monthly cashflow live
- Estimated rent
- $1,993 high interval (Pro) →
- Mortgage (P&I)
- −$1,274
- Tax from tax record
- −$369 /mo · $4,426/yr
- Insurance
- −$101
- HOA
- −$0
- Vacancy / Maint / Mgmt
- −$418
- Net cashflow
- $-170
Break-even live
UW: 25.0% down · 7.5% · 30yr · 1.5% tax · 5.0% vac · 8.0% maint · 8.0% mgmt
Financing live
Cash to close
- Down payment
- $60,750
- Closing costs
- $7,290
- Reserves months
- —
- Total cash needed
- —
Loan-product check · same deal, 3 products live
Conventional
25% down · 7.5% · 30yr
- Down + closing
- —
- Monthly P&I
- —
- Monthly cashflow
- —
- DSCR
- —
- Eligible?
- —
Personal DTI + credit; lowest rate.
DSCR
20% down · 8.5% · 30yr
- Down + closing
- —
- Monthly P&I
- —
- Monthly cashflow
- —
- DSCR
- —
- Eligible?
- —
No personal income docs; deal must DSCR.
Hard money
10% down · 12.0% · 12mo
- Down + closing
- —
- Monthly P&I
- —
- Monthly cashflow
- —
- DSCR
- —
- Eligible?
- —
Short-term bridge; refi at stabilization.
Rent comps 30 comps
| Address | Beds | Baths | Sqft | Rent | $/sqft | DOM | Units | Dist |
|---|---|---|---|---|---|---|---|---|
| 4117 S Marsalis Ave Dallas, TX | 3.0 | 2.0 | 1296 | $2,200 | $1.70 | 7d | 1 | 0.24mi |
| 3608 S Marsalis Ave Dallas, TX | 2.0 | 1.0 | 907 | $1,400 | $1.54 | 43d | 1 | 0.46mi |
| 3828 Morning Springs Trl Dallas, TX | 3.0 | 2.0 | 1399 | $2,200 | $1.57 | 21d | 1 | 0.73mi |
| 3702 Conway St Dallas, TX | 2.0–3.0 | 1.5–2.0 | 1033 | $1,595 | $1.54 | 1d | 5 | 0.73mi |
| 3806 Morning Springs Trl Dallas, TX | 3.0 | 2.0 | 1512 | $2,300 | $1.52 | 18d | 1 | 0.74mi |
| 625 W Pentagon Parkway Cir Dallas, TX | 3.0 | 2.0 | 1371 | $2,150 | $1.57 | 7d | 1 | 0.80mi |
| 1334 Marfa Ave Dallas, TX | 3.0 | 2.0 | 1100 | $1,475 | $1.34 | 43d | 1 | 0.86mi |
| 621 Tarryall Dr Dallas, TX | 4.0 | 2.0 | 1756 | $2,200 | $1.25 | 7d | 1 | 0.89mi |
| 4918 Rockport Dr Dallas, TX | 3.0 | 2.0 | 1673 | $1,800 | $1.08 | 7d | 1 | 0.91mi |
| 3504 Fawn Valley Dr Dallas, TX | 1.0–3.0 | 1.0–2.0 | 790 | $1,350 | $1.71 | 15d | 1 | 0.91mi |
| 1214 Adelaide Dr Dallas, TX | 3.0 | 1.0 | 1200 | $1,875 | $1.56 | 1d | 1 | 0.98mi |
| 1214 Adelaide Dr Dallas, TX | 3.0 | 1.0 | 1040 | $2,350 | $2.26 | 7d | 1 | 0.98mi |
| 3523 Fawn Valley Dr Dallas, TX | 1.0–2.0 | 1.0–1.5 | 796 | $1,200 | $1.51 | 15d | 1 | 1.00mi |
| 3212 S Llewellyn Ave Dallas, TX | 2.0 | 2.0 | 1040 | $1,750 | $1.68 | 43d | 1 | 1.10mi |
| 1618 Marfa Ave Dallas, TX | 3.0 | 2.0 | 1100 | $1,900 | $1.73 | 43d | 1 | 1.12mi |
| 1510 Maywood Ave Dallas, TX | 4.0 | 2.5 | 1869 | $2,220 | $1.19 | 43d | 1 | 1.12mi |
| 3311 S Vernon Ave Dallas, TX | 1.0–2.0 | 1.0–1.5 | 929 | $1,325 | $1.43 | 1d | 15 | 1.15mi |
| 2844 S Marsalis Ave Dallas, TX | 3.0 | 3.5 | 1788 | $2,300 | $1.29 | 43d | 1 | 1.18mi |
| 2842 S Marsalis Ave Dallas, TX | 3.0 | 3.5 | 1788 | $2,300 | $1.29 | 43d | 1 | 1.18mi |
| 2826 Alaska Ave Dallas, TX | 3.0 | 2.0 | 1190 | $1,795 | $1.51 | 24d | 1 | 1.20mi |
| 2819 Alabama Ave Dallas, TX | 3.0 | 2.0 | 1218 | $1,925 | $1.58 | 43d | 1 | 1.20mi |
| 620 Lacewood Dr Dallas, TX | 3.0 | 1.0 | 1218 | $1,750 | $1.44 | 2d | 1 | 1.21mi |
| 3930 S Denley Dr Dallas, TX | 3.0 | 2.0 | 1135 | $1,900 | $1.67 | 7d | 1 | 1.26mi |
| 3288 S Polk St Dallas, TX | 1.0–3.0 | 1.0 | 861 | $1,300 | $1.51 | 43d | 1 | 1.36mi |
| 1135 Holly Glen Cir Dallas, TX | 3.0 | 2.0 | 1707 | $3,400 | $1.99 | 7d | 1 | 1.41mi |
| 3702 Legendary Ln Dallas, TX | 1.0–3.0 | 1.0–2.0 | 990 | $1,099 | $1.11 | 3d | 6 | 1.42mi |
| 2634 Seevers Ave Dallas, TX | 3.0 | 2.0 | 1000 | $1,800 | $1.80 | 24d | 1 | 1.43mi |
| 4417 S Lancaster Rd Dallas, TX | 2.0 | 1.0–2.0 | 874 | $1,595 | $1.82 | 2d | 1 | 1.44mi |
| 4921 Jade Dr Dallas, TX | 3.0 | 2.0 | 1720 | $1,800 | $1.05 | 7d | 1 | 1.47mi |
| 4318 Lashley Dr Dallas, TX | 3.0 | 2.0 | 1562 | $2,100 | $1.34 | 5d | 1 | 1.48mi |
Listing history 6 events
-
2026-05-02status Pending
-
2026-04-21historical Active Option Contract
-
2026-04-08price $243,000
-
2026-03-20$249,000 Active
-
2025-04-30soldstatus
-
2025-04-28soldstatus
ⓘ Source: listings_history table (triggers on properties + properties_extension) + one-shot
backfill from property_details.listing_events for pre-trigger history.
Tax reassessment forecast TX · Resets to sale price
- Current annual tax
- $4,426 · $369/mo
- Projected year-2 tax
- $4,447 · $371/mo
- Expected delta
- +$21/yr (+$2/mo · 0.5%)
ⓘ Screening estimate from a state-policy table — verify with the county assessor before closing.
Climate risk First Street
- Flood 1/10 Low FEMA zone X (unshaded) · 0% chance over 30 yrs
- Wildfire 1/10 Low
- Heat 7/10 Severe 7 d/yr ≥110°F today · 25 d/yr by 30 yrs out
- Wind 6/10 Major 27% chance of damaging wind over 30 yrs
- Air quality 2/10 Low 1 unhealthy d/yr today · 2 by 30 yrs out
Nearby sold comps map
Loading sold comps map…
Walkable amenities ~0.75 mi
Loading nearby amenities…
Taxation est. · year 1
- Rental income
- $23,913
- − Mortgage interest
- −$13,612
- − Property taxes
- −$4,426
- − Insurance
- −$1,215
- − Repairs & maintenance
- −$1,913
- − Management
- −$1,913
- − Depreciation
- −$7,069
- Taxable loss
- −$6,235
- Est. tax savings @ 24.0%
- +$1,496
- After-tax cash flow
- $-545/yr
For passive investors: Depreciation is non-cash, so a rental often shows a tax loss while cash-flowing — sheltering income. Rental losses are passive: they offset passive income freely, and up to $25,000/yr can offset ordinary (W-2) income if you actively participate and your MAGI is under $100k (phasing out to $0 by $150k); unused losses carry forward. On sale, claimed depreciation is recaptured at up to 25%, and gains may owe capital-gains tax (a 1031 exchange can defer both). Figures are a year-1 estimate at your 24.0% rate — not tax advice; consult a CPA.
Schools (NCES district)
- District
- Dallas ISD
- NCES district ID
- 4816230
- Math proficiency
- 31% ▼ -16.00%
- Reading proficiency
- 36% ▼ -4.00%
- Median HH income
- $42,881
- Composite
- 28.41/100
- National rank
- #6763
- State rank
- #559 of 826 in TX
Livability — Dallas
- Score
- 81/100
- State rank
- #24
- US rank
- #1380
Category grades
Schools grade is shown separately in the Schools card above.
Census & demographics
- Census place
- Dallas, TX
- County
- Dallas County · 2,612,404 people
- City population
- 1,168,437
- Metro
- Dallas-Fort Worth-Arlington, TX
- Population (ZIP)
- 55,894
- Household income
- $41,386
- Rent vs Own
- Severe rent burden
- 2465.0
Population outlook (Dallas County) Hauer SSP2
- Today (2025)
- 2,979,839 people
- By 2030
- 3,191,823 · +7.1%
- By 2040
- 3,619,611 · +21.5%
- By 2050
- 4,026,915 · +35.1%
- By 2075
- 4,957,073 · +66.4%
- By 2100
- 5,508,725 · +84.9%
Race, ethnicity, and origin ACS 2023
- Neighborhood character
- Majority Black (51%)
- Race & ethnicity
- Black 51% Hispanic / Latino 44% Two or more races 14% White 3%
- Hispanic origin (detail)
- Mexican 40%
- Common ancestry
- Hispanic 1%
- Foreign-born
- 17% · Canada
- Languages at home
- 62% English-only · Spanish 37%
Political lean MEDSL · Dallas
- 2024 margin
- Strong D (+22.2) · D 60.2% · R 38.0% · Other 1.8%
- 2008→2024 swing
- +6.9pp toward D · 2008: 15.3pp · 2024: 22.2pp
- All cycles
- 2024: D+22.2 2020: D+31.6 2016: D+26.2 2012: D+15.4 2008: D+15.3
Not yet ingested
- Civics
- —
Market trends
- HPI YoY
- ▼ -126.35%
- Current HPI
- 299.1825
- Rent YoY
- ▲ 4.20%
- Metro
- Dallas-Fort Worth-Arlington, TX
- State GDP YoY
- ▲ 3.95%
- F500 in state
- 110
Industry mix (Fortune 500 HQ in TX)
| Industry | F500 HQs | Revenue |
|---|---|---|
| Energy | 16 | $1,198B |
|
||
| Technology | 5 | $198B |
|
||
| Engineering / Construction | 4 | $72B |
|
||
| Energy Services | 3 | $60B |
|
||
| Utilities | 3 | $41B |
|
||
| Healthcare | 2 | $330B |
|
||
Price history
-2.4% since first listed6 events — show timeline
- 2026-05-02 Pending — NTREIS
- 2026-04-21 Contingent — NTREIS
- 2026-04-08 Price Changed $243,000 NTREIS
- 2026-03-20 Listed $249,000 NTREIS
- 2025-04-30 Sold (Public Records) — Public Records
- 2025-04-28 Sold (Public Records) — Public Records
Property tax history
+8.9%/yrLatest (2025): $4,426 · -0.4% YoY. Source: county tax records.
Cash-flow waterfall
monthlySold comps — $/sqft
last 12 mo · ≤1 miLoading sold comps…