 Duplex
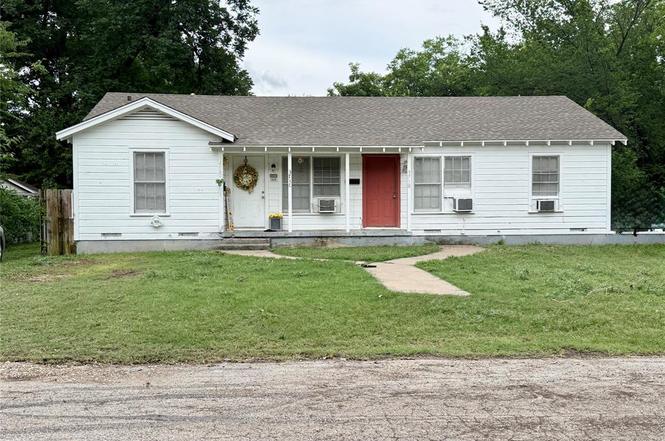
3716 Ethel Ave · Waco, TX
Flood risk 6/10 · Moderate
- FEMA flood zone
- AE
- Chance of flooding over 30 yrs
- 0.71%
- Est. flood insurance / yr
- $1,737 – $8,500
Fire risk 4/10 · Minor
- Est. fire insurance / yr
- $1,222 – $2,270
Heat risk 7/10 · Major
- Hot days now (above 109°F)
- 7 days/yr
- Hot days in 30 yrs
- 24 days/yr
Wind risk 6/10 · Moderate
- Chance of severe wind over 30 yrs
- 59.0%
Air-quality risk 2/10 · Minimal
- Unhealthy air days now
- 0 days/yr
- Unhealthy air days in 30 yrs
- 1 days/yr
Risk factors via First Street. Map © Google.
Why this score? — see what drove the C grade
The composite is a weighted blend of 9 inputs, each scored 0–100. Each bar is that input's sub-score; the figure is the points it added to the 100-point composite (weight × sub-score).
- Cash flow +24.9/30.0
- DSCR +8.1/10.0
- ARV discount +7.5/15.0
- 1% rule +6.0/10.0
- Livability +3.7/5.0
- Rent growth +2.8/5.0
- Condition / age +2.5/5.0
- Schools +1.8/10.0
- Appreciation +0.0/10.0
$215,000
🖨 Deal sheet 📄 Offer letter ✓ Due diligence
Multi-family units
County records classify this as Multi-Family (2-4 Unit). Listing-text estimate: 2 units. confirmed
Listing remarks MLS
These 2 bedroom 1 bath units are easy to keep rented. Both feature fenced in back yards and the window AC units, and wall heaters belong to the owner (all convey). 3716 has a 2 car garage in the back yard. Home is in the floodplain and requires insurance. Just renewed for $500 for the year (very affordable). Currently bringing in 1350 a month in income!
Key facts
- Fenced in back yards
- Electrical replaced
- 2 car garage
Tags
Property features AI
Finance
- Other: Tenancy terms include short-term (6 months or less) and over 9 months; Parcel number 480337000059001
- Financial info: Designed as residential income (duplex); 2 total units with 100% occupancy; Gross annual income reported: $22,200; Gross annual expenses reported: $6,526; Insurance expense: $2,000; Net operating income: $15,674; Operating expenses include insurance and professional management; Capitalization rate: 7.29%
- HOA & community: No homeowners association
Exterior
- Parking: Assigned parking; Garage; 2-car garage (2 garage spaces); Total of 4 parking spaces
- Utilities: City water; City sewer; Electricity connected; Individual gas meter; Not in a municipal utility district
- Home design: Duplex residential income property; 1 building with 2 units; Built in 1951; Preowned condition
- Construction: Siding exterior; Composition roof; Pillar/post/pier foundation
- Exterior features: Lot in Princess Place subdivision; Will not subdivide
Interior
- Kitchen: Electric range; Refrigerator
- Bedrooms: 4 bedrooms
- Flooring: Ceramic tile; Luxury vinyl plank
- Bathrooms: 2 full bathrooms
- Heating & cooling: Wall furnace heating; Wall/window cooling units (multiple)
- Interior features: One-level layout; Other interior features
Neighborhood map
What this means for you Summary
Snapshot
- This is a 2 × 2.0-bed/1.0-bath units multifamily listed at $215k.
Deal economics
- At list price, monthly cash flow is $35 ($425/yr) — positive. Per door: $18/mo.
- The deal already cash-flows at list — no discount required.
- Meets the 1% rule at list price ($2k rent vs $215k).
- Cap rate 8.9% vs local median 3.9% in Waco — top-decile yield for the area; either an underpriced asset or a hidden risk that comps aren't pricing in. Stress-test before assuming the spread holds.
Location & tenants
- Location reads 74/100 on livability (#166 in TX, #4,378 nationally) — a middle-class / working-renter tenant base. Strengths: cost of living A+, housing A+, health & safety A+; Watch: crime D, commute F, employment D-.
- Waco ISD (urban): math 20% / reading 24% proficiency, ranked #773 of 826 in TX (top 94%) — low school quality limits family demand, transient renter base, plan for 1-2y turnover; 81% free/reduced lunch — lower-income household profile, screen leases tightly.
- Zoned schools: Crestview El (math 17% / reading 17%, grade F, #3,836 of 4,322 statewide, top 91%, 451 students, 94% FRL).
- Market conditions: Rents rising (+1.1%/yr); 144 active listings in the ZIP; 36 comparable units currently listed for rent nearby; rentals at typical pace (median 21d on market — plan ~3-4 weeks tenant-placement turnaround); lower-income renter base — watch delinquency; 1,014 units permitted in McLennan County in 2024 (200 in 5+ unit buildings).
- At $2,364/mo this rent would consume 70% of the median local household income ($40k/yr) (locally 704% of renters already pay >50% of income on rent) — very limited rent-growth headroom before tenants either downsize or default.
Forward outlook
- Local home prices are declining (-3.0%/yr); year-one equity from $1k of loan paydown is wiped out by about $6k of value loss. Plan a longer hold.
- McLennan County population projected at +17% by 2050 — long-run rental-demand tailwind backs the buy-and-hold thesis.
Negotiation context
- Only 2 days on market — expect competitive offers; lowballing is unlikely to land.
- 4 sale attempts since 6y ago with the ask held roughly flat each time — persistent listings suggest the price (not the market) is what's stuck; bring a comps-based counter.
- Current owner paid $62k; list at $215k implies a 247% gain — meaningful room to come down on a strong offer.
Risks & watch-outs
- Watch-outs: flood insurance adds $427/mo; built in 1951 — expect roof / HVAC / electrical / plumbing capex.
- Climate carrying-cost: in FEMA flood zone AE (mandatory federal flood insurance); major wind risk, 59% chance of damaging wind over 30y; extreme-heat days projected 7→24/yr by 2055 (HVAC capex compounding) — expect insurance premiums to compound above CPI over the hold.
Questions for the listing agent
- Can we see the unit-by-unit rent roll, current vacancy, and any below-market leases? What's the average tenancy length?
- What capital expenditures (roof, boiler, parking lot, exteriors) have been made in the last 5 years, and what's planned in the next 2?
- Built in 1951 — when were the roof, HVAC, electrical panel, plumbing, and water heater last replaced?
- What's the actual annual flood-insurance premium (NFIP or private), and is the property in a SFHA with mandatory coverage?
- Is there a deadline driving the sale (1031 exchange, divorce, estate, relocation)? That informs how much negotiation room exists.
- Schools are D-rated, which usually means shorter tenancies and higher turnover. Who's the typical renter profile here, and what's been the actual vacancy rate?
- Crime grade is D in this area — have there been break-ins, vandalism, or insurance claims at this property in the last 3 years? What carrier currently insures it and at what premium?
- What's the average days-on-market for RENTAL listings here right now (not sales)? A rising rental-DOM trend means longer vacancies and softer asking-rent achievability than the comps imply.
- What's the recent tenant-quality profile in this submarket — average credit score on applications, eviction rate, late-payment / NSF rate, and stable-employment percentage? A property-management company in the area should have these aggregated.
- How much new apartment / multifamily construction is in the pipeline within 1–3 miles? Heavy new supply (>2% of stock underway) typically softens rents 12–24 months out; light construction supports rent growth.
Investment metrics
- 1% rule
- 1.10% ✓
- Cap rate
- 8.87%
- Cash-on-cash
- 9.21%
- DSCR
- 1.41
- GRM
- 7.6
CMA / ARV
No comps found within radius.
Projected returns pro-forma
-3.0% appreciation · 1.14% rent growth · sell at horizon
- IRR
- -17.6%
- Equity multiple
- 0.39×
- Total profit
- $-36,680
- Equity at exit
- $32,057
- IRR
- -14.5%
- Equity multiple
- 0.25×
- Total profit
- $-45,199
- Equity at exit
- $18,589
Cash invested: $60,200 (down + closing). Projections, not guarantees.
Landlord ↔ Tenant lean methodology
- Overall (STATE)
- 87 Strongly Landlord-Friendly
- State Texas
- 87 Strongly Landlord-Friendly · R+5
- County
- — inherits STATE
- City
- — inherits STATE
ZIP-level market 76707
- Rents YoY
- 1.1%
- Active inventory
- 144
- Price-to-rent
- 15.2×
Monthly cashflow live
- Estimated rent
- $2,364 high interval (Pro) →
- Mortgage (P&I)
- −$1,127
- Tax from tax record
- −$189 /mo · $2,263/yr
- Insurance
- −$90
- Flood insurance flood zone
- −$427 /mo · $5,118/yr
- HOA
- −$0
- Vacancy / Maint / Mgmt
- −$496
- Net cashflow
- $35
Break-even live
2-unit breakdown (identical units grouped — click to expand)
| Units | Beds | Baths | Est. rent |
|---|---|---|---|
| 2× units | 2.0 | 1 | $2,364 |
| #1 | 2.0 | 1 | $1,182 |
| #2 | 2.0 | 1 | $1,182 |
| Total (2 units) | $2,364 | ||
UW: 25.0% down · 7.5% · 30yr · 1.5% tax · 5.0% vac · 8.0% maint · 8.0% mgmt
Financing live
Cash to close
- Down payment
- $53,750
- Closing costs
- $6,450
- Reserves months
- —
- Total cash needed
- —
Loan-product check · same deal, 3 products live
Conventional
25% down · 7.5% · 30yr
- Down + closing
- —
- Monthly P&I
- —
- Monthly cashflow
- —
- DSCR
- —
- Eligible?
- —
Personal DTI + credit; lowest rate.
DSCR
20% down · 8.5% · 30yr
- Down + closing
- —
- Monthly P&I
- —
- Monthly cashflow
- —
- DSCR
- —
- Eligible?
- —
No personal income docs; deal must DSCR.
Hard money
10% down · 12.0% · 12mo
- Down + closing
- —
- Monthly P&I
- —
- Monthly cashflow
- —
- DSCR
- —
- Eligible?
- —
Short-term bridge; refi at stabilization.
Rent comps 36 comps
| Address | Beds | Baths | Sqft | Rent | $/sqft | DOM | Units | Dist |
|---|---|---|---|---|---|---|---|---|
| 1309 Sunset St Waco, TX | 2.0 | 1.0 | 1102 | $1,295 | $1.18 | 21d | 1 | 0.23mi |
| 1300 N 43rd St Waco, TX | 2.0 | 1.0 | 1109 | $860 | $0.78 | 21d | 1 | 0.31mi |
| 3821 Lasker Ave Waco, TX | 3.0 | 2.0 | 1209 | $1,850 | $1.53 | 21d | 1 | 0.32mi |
| 3125 Ethel Ave Waco, TX | 3.0 | 2.0 | 1760 | $1,900 | $1.08 | 21d | 1 | 0.49mi |
| 3116 Bosque Blvd Waco, TX | 2.0 | 1.0 | 1100 | $1,250 | $1.14 | 13d | 1 | 0.50mi |
| 3121 Colonial Ave Waco, TX | 3.0 | 2.0 | 1085 | $1,600 | $1.47 | 21d | 1 | 0.51mi |
| 3121 Colonial Ave Waco, TX | 3.0 | 2.0 | 1085 | $1,600 | $1.47 | 43d | 1 | 0.51mi |
| 1113 N New Rd Waco, TX | 3.0 | 2.0 | 1326 | $1,620 | $1.22 | 21d | 1 | 0.58mi |
| 3532 Windsor Ave Waco, TX | 3.0 | 2.0 | 1100 | $1,475 | $1.34 | 13d | 1 | 0.58mi |
| 3621 Gorman Ave Waco, TX | 3.0 | 1.5 | 1086 | $1,950 | $1.80 | 13d | 1 | 0.62mi |
| 3007 Parrott Ave Unit 1 Waco, TX | 3.0 | 2.0 | 1458 | $1,650 | $1.13 | 21d | 1 | 0.66mi |
| 2100 N 33rd St Waco, TX | 3.0 | 3.0 | 1858 | $2,200 | $1.18 | 43d | 1 | 0.71mi |
| 2213 N 41st St Waco, TX | 3.0 | 1.5 | 1299 | $1,550 | $1.19 | 13d | 1 | 0.73mi |
| 3825 Kimberly Dr Waco, TX | 2.0 | 2.0 | 1233 | $1,250 | $1.01 | 21d | 1 | 0.73mi |
| 2724 Bosque Blvd Waco, TX | 2.0 | 1.0 | 1120 | $1,100 | $0.98 | 21d | 1 | 0.80mi |
| 1901 N 28th St Waco, TX | 3.0 | 2.0 | 1794 | $1,950 | $1.09 | 21d | 1 | 0.86mi |
| 4320 Guthrie Cir Waco, TX | 3.0 | 1.0 | 1069 | $1,700 | $1.59 | 21d | 1 | 0.86mi |
| 736 Grice St Waco, TX | 3.0 | 2.0 | 1125 | $1,750 | $1.56 | 43d | 1 | 0.98mi |
| 2511 Parrott Ave Waco, TX | 3.0 | 2.0 | 1463 | $1,695 | $1.16 | 43d | 1 | 1.01mi |
| 2714 Morrow Ave Waco, TX | 2.0 | 1.0 | 1484 | $1,375 | $0.93 | 21d | 1 | 1.02mi |
| 516 N 31st St Waco, TX | 1.0 | 1.0 | 1100 | $1,000 | $0.91 | 21d | 1 | 1.03mi |
| 516 N 31st St Unit 1 Waco, TX | 1.0 | 1.0 | 1100 | $1,000 | $0.91 | 43d | 1 | 1.03mi |
| 5025 Loch Lomond Dr Waco, TX | 3.0 | 2.0 | 1611 | $1,850 | $1.15 | 21d | 1 | 1.06mi |
| 2621 Windsor Ave Waco, TX | 2.0 | 1.0 | 1108 | $1,175 | $1.06 | 21d | 1 | 1.08mi |
| 2704 Herring Ave Waco, TX | 2.0 | 2.0 | 1286 | $1,750 | $1.36 | 21d | 1 | 1.22mi |
| 2324 N 50th St Waco, TX | 3.0 | 2.0 | 1875 | $3,300 | $1.76 | 43d | 1 | 1.25mi |
| 2712 Lyle Ave Waco, TX | 3.0 | 1.0 | 1100 | $1,500 | $1.36 | 43d | 1 | 1.27mi |
| 2712 Lyle Ave Waco, TX | 3.0 | 1.0 | 1100 | $1,500 | $1.36 | 21d | 1 | 1.27mi |
| 2505 Proctor Ave Waco, TX | 3.0 | 2.0 | 1588 | $1,550 | $0.98 | 21d | 1 | 1.29mi |
| 2712 Mitchell Ave Waco, TX | 3.0 | 1.0 | 1120 | $1,300 | $1.16 | 21d | 1 | 1.33mi |
| 608 N 23rd St Waco, TX | 3.0 | 1.0 | 1361 | $1,695 | $1.25 | 21d | 1 | 1.35mi |
| 2001 Bosque Blvd Waco, TX | 3.0 | 1.0 | 1628 | $1,100 | $0.68 | 43d | 1 | 1.39mi |
| 2900 Austin Ave Waco, TX | 2.0 | 2.0 | 1176 | $1,195 | $1.02 | 43d | 1 | 1.40mi |
| 2717 Alexander Ave Waco, TX | 2.0 | 2.0 | 1200 | $2,000 | $1.67 | 21d | 1 | 1.41mi |
| 415 N 23rd St Waco, TX | 3.0 | 2.0 | 1680 | $2,000 | $1.19 | 21d | 1 | 1.44mi |
| 1000 N 19th St Waco, TX | 3.0 | 1.5 | 1800 | $2,050 | $1.14 | 21d | 1 | 1.48mi |
Listing history 3 events
-
2026-06-18days on market $215,000 Active 2 DOM
-
2026-06-16remarks 401-char remark
-
2026-06-16$215,000 Active 1 DOM
ⓘ Source: listings_history table (triggers on properties + properties_extension) + one-shot
backfill from property_details.listing_events for pre-trigger history.
Tax reassessment forecast TX · Resets to sale price
- Current annual tax
- $2,263 · $189/mo
- Projected year-2 tax
- $3,934 · $328/mo
- Expected delta
- +$1,672/yr (+$139/mo · 73.9%)
ⓘ Screening estimate from a state-policy table — verify with the county assessor before closing.
Climate risk First Street
- Flood 6/10 Major FEMA zone AE · 71% chance over 30 yrs
- Wildfire 4/10 Moderate
- Heat 7/10 Severe 7 d/yr ≥109°F today · 24 d/yr by 30 yrs out
- Wind 6/10 Major 59% chance of damaging wind over 30 yrs
- Air quality 2/10 Low 0 unhealthy d/yr today · 1 by 30 yrs out
Nearby sold comps map
Loading sold comps map…
Walkable amenities ~0.75 mi
Loading nearby amenities…
Taxation est. · year 1
- Rental income
- $28,368
- − Mortgage interest
- −$12,043
- − Property taxes
- −$2,263
- − Insurance
- −$6,194
- − Repairs & maintenance
- −$2,269
- − Management
- −$2,269
- − Depreciation
- −$6,255
- Taxable loss
- −$2,925
- Est. tax savings @ 24.0%
- +$702
- After-tax cash flow
- $1,127/yr
For passive investors: Depreciation is non-cash, so a rental often shows a tax loss while cash-flowing — sheltering income. Rental losses are passive: they offset passive income freely, and up to $25,000/yr can offset ordinary (W-2) income if you actively participate and your MAGI is under $100k (phasing out to $0 by $150k); unused losses carry forward. On sale, claimed depreciation is recaptured at up to 25%, and gains may owe capital-gains tax (a 1031 exchange can defer both). Figures are a year-1 estimate at your 24.0% rate — not tax advice; consult a CPA.
Schools (NCES district)
- District
- Waco ISD
- NCES district ID
- 4844280
- Math proficiency
- 20% ▼ -14.00%
- Reading proficiency
- 24% ▼ -6.00%
- Median HH income
- $29,208
- Composite
- 17.57/100
- National rank
- #9043
- State rank
- #773 of 826 in TX
Livability — Waco
- Score
- 74/100
- State rank
- #166
- US rank
- #4378
Category grades
Schools grade is shown separately in the Schools card above.
Census & demographics
- Census place
- Waco, TX
- County
- McLennan County · 213,088 people
- City population
- 125,319
- Metro
- Waco, TX
- Population (ZIP)
- 15,879
- Household income
- $40,443
- Rent vs Own
- Severe rent burden
- 704.0
Population outlook (McLennan County) Hauer SSP2
- Today (2025)
- 264,191 people
- By 2030
- 273,578 · +3.6%
- By 2040
- 291,506 · +10.3%
- By 2050
- 308,044 · +16.6%
- By 2075
- 349,648 · +32.3%
- By 2100
- 364,779 · +38.1%
Race, ethnicity, and origin ACS 2023
- Neighborhood character
- Diverse neighborhood (Simpson 0.64)
- Race & ethnicity
- Hispanic / Latino 47% Black 32% Two or more races 26% White 18%
- Hispanic origin (detail)
- Mexican 43%
- Common ancestry
- Romanian 1% Lithuanian 1% Italian 1%
- Foreign-born
- 15% · Canada
- Languages at home
- 65% English-only · Spanish 34% Tagalog/Filipino 1%
Political lean MEDSL · McLennan
- 2024 margin
- Solid R (+30.9) · D 34.0% · R 64.9% · Other 1.0%
- 2008→2024 swing
- -7.0pp toward R · 2008: -23.9pp · 2024: -30.9pp
- All cycles
- 2024: R+30.9 2020: R+23.4 2016: R+27.1 2012: R+29.8 2008: R+23.9
Not yet ingested
- Civics
- —
Market trends
- HPI YoY
- ▼ -134.95%
- Current HPI
- 239.639
- Rent YoY
- ▲ 1.14%
- Metro
- Waco, TX
- State GDP YoY
- ▲ 3.95%
- F500 in state
- 110
Industry mix (Fortune 500 HQ in TX)
| Industry | F500 HQs | Revenue |
|---|---|---|
| Energy | 16 | $1,198B |
|
||
| Technology | 5 | $198B |
|
||
| Engineering / Construction | 4 | $72B |
|
||
| Energy Services | 3 | $60B |
|
||
| Utilities | 3 | $41B |
|
||
| Healthcare | 2 | $330B |
|
||
Price history
+246.8% since first listed15 events — show timeline
- 2026-06-16 Listed $215,000 NTREIS
- 2025-06-02 Rental Removed $950 APPFOLIO
- 2025-05-15 Price Changed $950 APPFOLIO
- 2025-03-19 Listed for Rent $1,000 APPFOLIO
- 2025-02-09 Rental Removed $1,000 APPFOLIO
- 2025-01-29 Listed for Rent $1,000 APPFOLIO
- 2022-02-20 Price Changed $900 RENT.
- 2020-10-15 Sold (Public Records) — Public Records
- 2020-10-14 Sold (MLS) — NTREIS
- 2020-07-22 Listed $149,500 NTREIS
- 2018-09-04 Sold (Public Records) — Public Records
- 2018-06-04 Sold (Public Records) — Public Records
- 2018-03-14 Sold (Public Records) $62,000 Public Records
- 2015-08-20 Sold (Public Records) — Public Records
- 2002-12-12 Sold (Public Records) — Public Records
Property tax history
+5.5%/yrLatest (2025): $2,263 · +19.6% YoY. Source: county tax records.
Cash-flow waterfall
monthlySold comps — $/sqft
last 12 mo · ≤1 miLoading sold comps…