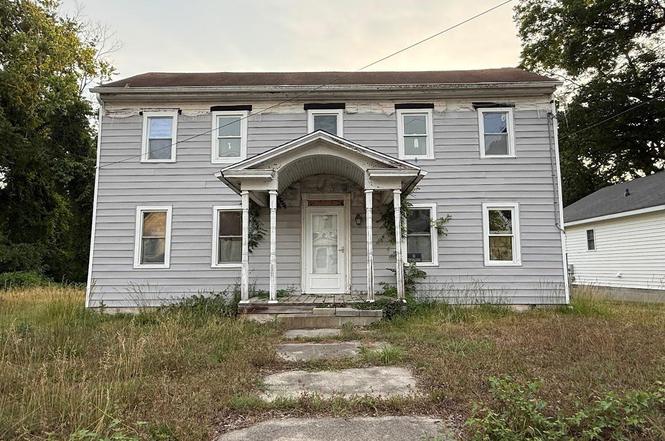
808 2nd St · Pocomoke City, MD
Flood risk 1/10 · Minimal
- FEMA flood zone
- X (unshaded)
- Chance of flooding over 30 yrs
- 0.0%
- Est. flood insurance / yr
- $507 – $1,088
Fire risk 4/10 · Minor
- Est. fire insurance / yr
- $755 – $1,403
Heat risk 8/10 · Major
- Hot days now (above 102°F)
- 7 days/yr
- Hot days in 30 yrs
- 19 days/yr
Wind risk 8/10 · Major
- Chance of severe wind over 30 yrs
- 80.0%
Air-quality risk 2/10 · Minimal
- Unhealthy air days now
- 1 days/yr
- Unhealthy air days in 30 yrs
- 1 days/yr
Risk factors via First Street. Map © Google.
Why this score? — see what drove the B+ grade
The composite is a weighted blend of 9 inputs, each scored 0–100. Each bar is that input's sub-score; the figure is the points it added to the 100-point composite (weight × sub-score).
- Cash flow +30.0/30.0
- ARV discount +15.0/15.0
- 1% rule +10.0/10.0
- DSCR +10.0/10.0
- Livability +3.6/5.0
- Schools +3.3/10.0
- Rent growth +2.5/5.0
- Condition / age +2.5/5.0
- Appreciation +0.0/10.0
$110,000
🖨 Deal sheet (PDF) 📄 Offer letter ✓ Due diligence
Listing remarks MLS
OWNER FINANCING WITH $1,500 DOWN PLUS CLOSING COSTS. LOTS OF POTENTIAL. IN NEED OF SOME REPAIRS. ROOF IS APPROX. 7 YEARS OLD. TO BE SOLD ''AS IS''. CALL LISTING AGENT FOR DETAILS. NICE . 25 ACRE LOT WITH SURVEY.
Key facts
- Convenient access
- Recent improvements
- Partially renovated
Tags
Property features AI
Exterior
- Parking: On-street parking
- Utilities: Public water; Public sewer
- Home design: Detached structure; Above-grade finished area of 1,760 (assessor)
- Construction: Frame/stick-built construction with asbestos materials noted; Block foundation; Other structures listed above and below grade
- Exterior features: Not in a federal flood zone; No tidal water on the property
Interior
- Bedrooms: 4 bedrooms on the main level
- Bathrooms: 2 full bathrooms (both on the main level)
- Interior features: Living area reported by assessor
Neighborhood map
What this means for you Summary
Snapshot
- This is a 4-bed/1.0-bath single-family listed at $110k.
Deal economics
- At list price, monthly cash flow is $844 ($10k/yr) — positive.
- The deal already cash-flows at list — no discount required.
- Meets the 1% rule at list price ($2k rent vs $110k).
- Cap rate 15.5% vs local median 5.6% in Pocomoke City — top-decile yield for the area; either an underpriced asset or a hidden risk that comps aren't pricing in. Stress-test before assuming the spread holds.
Location & tenants
- Location reads 71/100 on livability (#157 in MD) — a middle-class / working-renter tenant base. Strengths: cost of living A+, health & safety A+, housing A-; Watch: employment D+, crime F, amenities F.
- Worcester County Public Schools (town): math 30% / reading 44% proficiency, ranked #6 of 24 in MD (top 25%) — families likely to look elsewhere, expect single-tenant / working-renter base with shorter leases.
- Market conditions: 69 active listings in the ZIP; 5 comparable units currently listed for rent nearby; rentals at typical pace (median 15d on market — plan ~3-4 weeks tenant-placement turnaround); 354 units permitted in Worcester County in 2024 (6 in 5+ unit buildings).
Forward outlook
- Local home prices are declining (-3.0%/yr); year-one equity from $761 of loan paydown is wiped out by about $3k of value loss. Plan a longer hold.
- Worcester County population projected to shrink 4% by 2050 — rents likely to lag national; underwrite the cash flow, not the appreciation.
- At projected returns (-3.0% appreciation + 3.0% rent growth), your $31k cash investment doubles in ~4 years — after that, you're playing with house money.
Negotiation context
- Only 4 days on market — expect competitive offers; lowballing is unlikely to land.
- 3 sale attempts since 17y ago with the ask held roughly flat each time — persistent listings suggest the price (not the market) is what's stuck; bring a comps-based counter.
Risks & watch-outs
- Watch-outs: built in 1900 — expect roof / HVAC / electrical / plumbing capex.
- Climate carrying-cost: severe wind risk, 80% chance of damaging wind over 30y; extreme-heat days projected 7→19/yr by 2055 (HVAC capex compounding) — expect insurance premiums to compound above CPI over the hold.
Questions for the listing agent
- Built in 1900 — when were the roof, HVAC, electrical panel, plumbing, and water heater last replaced?
- Is there a deadline driving the sale (1031 exchange, divorce, estate, relocation)? That informs how much negotiation room exists.
- Crime grade is F in this area — have there been break-ins, vandalism, or insurance claims at this property in the last 3 years? What carrier currently insures it and at what premium?
- What's the average days-on-market for RENTAL listings here right now (not sales)? A rising rental-DOM trend means longer vacancies and softer asking-rent achievability than the comps imply.
- What's the recent tenant-quality profile in this submarket — average credit score on applications, eviction rate, late-payment / NSF rate, and stable-employment percentage? A property-management company in the area should have these aggregated.
- How much new for-sale + rental construction is in the pipeline within 1–3 miles? Heavy new supply typically softens prices + rents 12–24 months out; constrained supply supports both.
Investment metrics
- 1% rule
- 1.77% ✓
- Cap rate
- 15.50%
- Cash-on-cash
- 32.89%
- DSCR
- 2.46
- GRM
- 4.7
CMA / ARV
- ARV (on-the-fly)
- $212,960
- Comps found
- 11
Show comp detail 11 sales within ~0.75 mi
| Address | Dist | Beds/Ba | Sqft | Sold | Price | $/sf | Match |
|---|---|---|---|---|---|---|---|
| 610 Clarke Ave | 0.20mi | 3/1.5 (-1) | 1,799 (+2%) | 5mo | $127,000 | $71 | 75 |
| 606 Clarke Ave | 0.21mi | 4/2.0 | 1,800 (+2%) | 16mo | $60,000 | $33 | 69 |
| 907 2nd | 0.20mi | 4/2.5 | 1,848 (+5%) | 13mo | $211,500 | $114 | 65 |
| 602 Walnut St | 0.34mi | 4/2.0 | 1,728 (-2%) | 17mo | $248,000 | $144 | 63 |
| 615 Walnut St | 0.38mi | 3/2.0 (-1) | 1,862 (+6%) | 10mo | $205,000 | $110 | 56 |
| 709 Walnut St | 0.45mi | 4/2.0 | 1,624 (-8%) | 12mo | $196,000 | $121 | 52 |
| 618 Walnut St | 0.39mi | 3/3.0 (-1) | 1,952 (+11%) | 5mo | $260,000 | $133 | 46 |
| 202 6th St | 0.37mi | 3/2.5 (-1) | 1,596 (-9%) | 13mo | $254,000 | $159 | 45 |
| 512 Young St | 0.21mi | 4/2.5 | 2,000 (+14%) | 19mo | $215,000 | $108 | 45 |
| 509 Market St | 0.39mi | 4/2.0 | 1,990 (+13%) | 22mo | $290,000 | $146 | 38 |
| 1005 Market St | 0.73mi | 3/3.5 (-1) | 1,893 (+8%) | 12mo | $321,000 | $170 | 28 |
Match score weights: distance 35% · size 25% · config 20% · recency 20%. Top-matched comps best support the ARV.
Projected returns pro-forma
-3.0% appreciation · 3.0% rent growth · sell at horizon
- IRR
- 28.0%
- Equity multiple
- 2.17×
- Total profit
- $35,922
- Equity at exit
- $16,401
- IRR
- 35.5%
- Equity multiple
- 4.26×
- Total profit
- $100,451
- Equity at exit
- $9,511
Cash invested: $30,800 (down + closing). Projections, not guarantees.
Landlord ↔ Tenant lean methodology
- Overall (STATE)
- 27 Tenant-Leaning
- State Maryland
- 27 Tenant-Leaning · D+14
- County
- — inherits STATE
- City
- — inherits STATE
ZIP-level market 21851
- Home prices YoY
- -4.0%
- Active inventory
- 69
- Price-to-rent
- 4.7×
Monthly cashflow live
- Estimated rent
- $1,943 high interval (Pro) →
- Mortgage (P&I)
- −$577
- Tax from tax record
- −$68 /mo · $819/yr
- Insurance
- −$46
- HOA
- −$0
- Vacancy / Maint / Mgmt
- −$408
- Net cashflow
- $844
Break-even live
Sensitivity live
| Price | -10% $906 | -5% $875 | +0% $844 | +5% $813 | +10% $782 |
|---|---|---|---|---|---|
| Rent | -10% $691 | -5% $767 | +0% $844 | +5% $921 | +10% $998 |
| Rate | -1.0pp $899 | -0.5pp $872 | base $844 | +0.5pp $816 | +1.0pp $787 |
UW: 25.0% down · 7.5% · 30yr · 1.5% tax · 5.0% vac · 8.0% maint · 8.0% mgmt
Financing live
Cash to close
- Down payment
- $27,500
- Closing costs
- $3,300
- Reserves months
- —
- Total cash needed
- —
Loan-product check · same deal, 3 products live
Conventional
25% down · 7.5% · 30yr
- Down + closing
- —
- Monthly P&I
- —
- Monthly cashflow
- —
- DSCR
- —
- Eligible?
- —
Personal DTI + credit; lowest rate.
DSCR
20% down · 8.5% · 30yr
- Down + closing
- —
- Monthly P&I
- —
- Monthly cashflow
- —
- DSCR
- —
- Eligible?
- —
No personal income docs; deal must DSCR.
Hard money
10% down · 12.0% · 12mo
- Down + closing
- —
- Monthly P&I
- —
- Monthly cashflow
- —
- DSCR
- —
- Eligible?
- —
Short-term bridge; refi at stabilization.
Rent comps 5 comps
| Address | Beds | Baths | Sqft | Rent | $/sqft | DOM | Units | Dist |
|---|---|---|---|---|---|---|---|---|
| 621 Cedar St Pocomoke City, MD | 3.0 | 2.5 | 1352 | $2,195 | $1.62 | 14d | 1 | 0.38mi |
| 242 Morgans Ct Pocomoke City, MD | 3.0 | 2.5 | 1304 | $1,795 | $1.38 | 14d | 1 | 0.80mi |
| 241 Morgans Ct Pocomoke City, MD | 3.0 | 2.5 | 1304 | $1,795 | $1.38 | 14d | 1 | 0.80mi |
| 202 Carsons Ct Pocomoke City, MD | 3.0 | 2.0 | 1472 | $1,695 | $1.15 | 14d | 1 | 0.85mi |
| 1513 Princess Anne Ln Pocomoke City, MD | 3.0 | 2.0 | 1542 | $1,950 | $1.26 | 45d | 1 | 1.18mi |
Listing history 5 events
-
2026-06-18days on market $110,000 Active 4 DOM
-
2026-06-17days on market $110,000 Active 3 DOM
-
2026-06-16days on market $110,000 Active 2 DOM
-
2026-06-15remarks 699-char remark
-
2026-06-15$110,000 Active 1 DOM
ⓘ Source: listings_history table (triggers on properties + properties_extension) + one-shot
backfill from property_details.listing_events for pre-trigger history.
Tax reassessment forecast MD · Partial reset (capped growth)
- Current annual tax
- $819 · $68/mo
- Projected year-2 tax
- $1,009 · $84/mo
- Expected delta
- +$190/yr (+$16/mo · 23.2%)
ⓘ Screening estimate from a state-policy table — verify with the county assessor before closing.
Climate risk First Street
- Flood 1/10 Low FEMA zone X (unshaded) · 0% chance over 30 yrs
- Wildfire 4/10 Moderate
- Heat 8/10 Severe 7 d/yr ≥102°F today · 19 d/yr by 30 yrs out
- Wind 8/10 Severe 80% chance of damaging wind over 30 yrs
- Air quality 2/10 Low 1 unhealthy d/yr today · 1 by 30 yrs out
Nearby sold comps map
Loading sold comps map…
Walkable amenities ~0.75 mi
Loading nearby amenities…
Taxation est. · year 1
- Rental income
- $23,317
- − Mortgage interest
- −$6,162
- − Property taxes
- −$819
- − Insurance
- −$550
- − Repairs & maintenance
- −$1,865
- − Management
- −$1,865
- − Depreciation
- −$3,200
- Taxable income
- $8,855
- Est. tax owed @ 24.0%
- −$2,125
- After-tax cash flow
- $8,004/yr
For passive investors: Depreciation is non-cash, so a rental often shows a tax loss while cash-flowing — sheltering income. Rental losses are passive: they offset passive income freely, and up to $25,000/yr can offset ordinary (W-2) income if you actively participate and your MAGI is under $100k (phasing out to $0 by $150k); unused losses carry forward. On sale, claimed depreciation is recaptured at up to 25%, and gains may owe capital-gains tax (a 1031 exchange can defer both). Figures are a year-1 estimate at your 24.0% rate — not tax advice; consult a CPA.
Schools (NCES district)
- District
- Worcester County Public Schools
- NCES district ID
- 2400720
- Math proficiency
- 30% ▼ -25.00%
- Reading proficiency
- 44% ▼ -20.00%
- Median HH income
- $56,748
- Composite
- 32.6/100
- National rank
- #5672
- State rank
- #6 of 24 in MD
Livability — Pocomoke City
- Score
- 71/100
- State rank
- #157
- US rank
- #7066
Category grades
Schools grade is shown separately in the Schools card above.
Census & demographics
- Census place
- Pocomoke City, MD
- Population (ZIP)
- 7,252
Population outlook (Worcester County) Hauer SSP2
- Today (2025)
- 51,363 people
- By 2030
- 51,191 · -0.3%
- By 2040
- 50,459 · -1.8%
- By 2050
- 49,451 · -3.7%
- By 2075
- 48,533 · -5.5%
- By 2100
- 44,223 · -13.9%
Race, ethnicity, and origin ACS 2023
- Neighborhood character
- Diverse neighborhood (Simpson 0.58)
- Race & ethnicity
- White 54% Black 37% Two or more races 5% Asian 2% Hispanic / Latino 2%
- Common ancestry
- Scandinavian 2% Romanian 2% Scotch-Irish 2%
- Foreign-born
- 5% · Canada, Dominican Republic, Mexico
- Languages at home
- 93% English-only · Other Asian/Pacific 1% Spanish 1% Vietnamese 1%
Political lean MEDSL · Worcester
- 2024 margin
- Strong R (+22.0) · D 38.0% · R 60.0% · Other 2.0%
- 2008→2024 swing
- -6.5pp toward R · 2008: -15.5pp · 2024: -22.0pp
- All cycles
- 2024: R+22.0 2020: R+19.0 2016: R+27.9 2012: R+18.3 2008: R+15.5
Not yet ingested
- Civics
- —
Market trends
- HPI YoY
- ▼ -10.03%
- Current HPI
- 243.2329
- Rent YoY
- —
- Metro
- —
- State GDP YoY
- ▲ 2.97%
- F500 in state
- 12
Industry mix (Fortune 500 HQ in MD)
| Industry | F500 HQs | Revenue |
|---|---|---|
| Aerospace / Defense | 1 | $71B |
|
||
| Utilities | 1 | $25B |
|
||
| Hotels | 1 | $24B |
|
||
| Consumer Goods | 1 | $7B |
|
||
| Real Estate | 1 | $6B |
|
||
| Chemicals | 1 | $2B |
|
||
Price history
+685.7% since first listed9 events — show timeline
- 2026-06-15 Listed $110,000 BRIGHT MLS
- 2026-06-14 Coming Soon $110,000 BRIGHT MLS
- 2026-05-15 Sold (Public Records) $197,177 Public Records
- 2009-12-30 Sold (Public Records) $20,000 Public Records
- 2009-12-17 Sold (MLS) $20,000 BRIGHT MLS
- 2009-10-26 Listed $23,900 BRIGHT MLS
- 2009-10-13 Sold (MLS) $9,000 BRIGHT MLS
- 2009-01-05 Listed $18,000 BRIGHT MLS
- 1989-03-20 Sold (Public Records) $14,000 Public Records
Property tax history
+2.2%/yrLatest (2025): $819 · +3.0% YoY. Source: county tax records.
Cash-flow waterfall
monthlySold comps — $/sqft
last 12 mo · ≤1 miLoading sold comps…