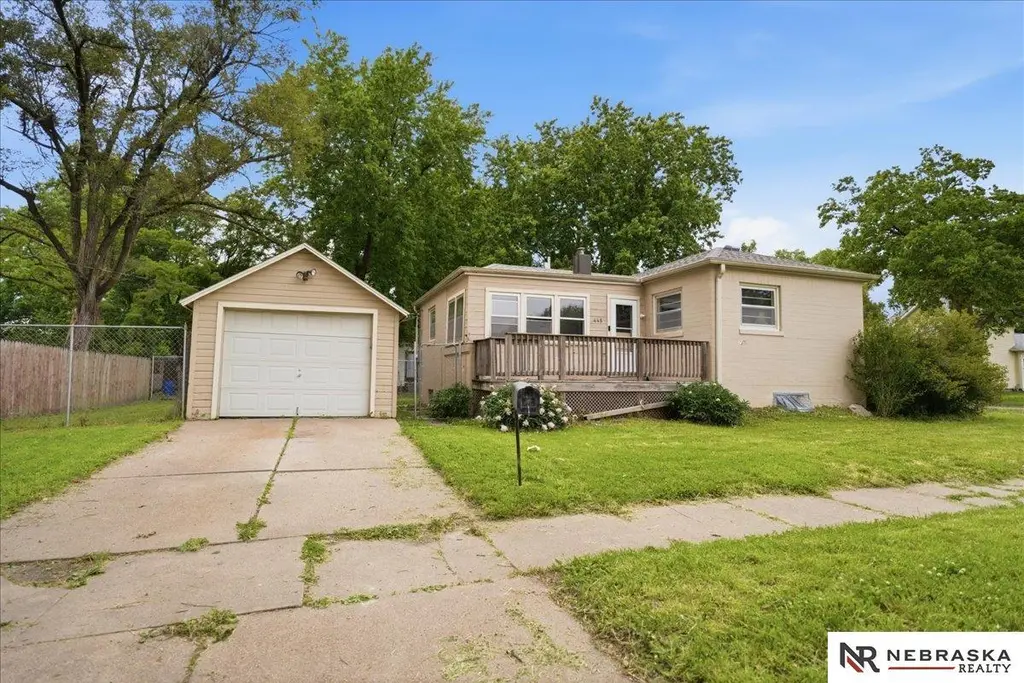
445 N L St · Fremont, NE
Flood risk 3/10 · Minor
- FEMA flood zone
- X (shaded)
- Chance of flooding over 30 yrs
- 0.16%
- Est. flood insurance / yr
- $473 – $860
Fire risk 2/10 · Minimal
- Est. fire insurance / yr
- $1,161 – $2,155
Heat risk 3/10 · Minor
- Hot days now (above 103°F)
- 7 days/yr
- Hot days in 30 yrs
- 16 days/yr
Wind risk 2/10 · Minimal
- Chance of severe wind over 30 yrs
- —
Air-quality risk 1/10 · Minimal
- Unhealthy air days now
- 0 days/yr
- Unhealthy air days in 30 yrs
- 0 days/yr
Risk factors via First Street. Map © Google.
Why this score? — see what drove the D+ grade
The composite is a weighted blend of 9 inputs, each scored 0–100. Each bar is that input's sub-score; the figure is the points it added to the 100-point composite (weight × sub-score).
- ARV discount +15.0/15.0
- Cash flow +14.0/30.0
- DSCR +4.2/10.0
- Livability +3.8/5.0
- 1% rule +3.5/10.0
- Schools +3.0/10.0
- Condition / age +2.5/5.0
- Rent growth +2.0/5.0
- Appreciation +0.0/10.0
$169,000
🖨 Deal sheet 📄 Offer letter ✓ Due diligence
Listing remarks MLS
Newer water heater & furnace, 150 AMP breakers, 16 x 7 porch
Key facts
- Close to schools
- Close to dining
- Extra green space
Tags
Property features AI
Exterior
- Parking: Detached covered garage (1 car); One total parking space
- Utilities: Public water; Public sewer
- Home design: Single-family residence (not new); Below-grade finished area and above-grade finished area
- Construction: Built in 1947; Composition roof; Concrete perimeter foundation
- Exterior features: Porch, enclosed porch, and deck; Chain link fencing; Paved road access; Corner lot
Interior
- Kitchen: Laminate flooring; Range; Refrigerator
- Bedrooms: Main floor primary bedroom with wood flooring; Basement bedrooms with luxury vinyl plank flooring
- Flooring: Wood flooring; Laminate flooring; Luxury vinyl plank
- Bathrooms: Two bathrooms: one full and one three-quarter; at least one on the main level and one below grade
- Heating & cooling: Natural gas forced air heating; Central air conditioning
- Interior features: Finished basement with egress; Sunroom with wall-to-wall carpeting; No fireplaces
- Laundry & utility: Washer and dryer; Laundry area with luxury vinyl plank flooring
Neighborhood map
What this means for you Summary
Snapshot
- This is a 3-bed/1.0-bath single-family listed at $169k.
Deal economics
- At list price, monthly cash flow is $21 ($250/yr) — positive.
- The deal already cash-flows at list — no discount required.
- To meet the 1% rule (rent ≥ 1% of price), the offer needs to be $143k (15.3% below list).
- Recommended offer: $143k (15.3% below list) — sets the bar for 1% rule.
- Cap rate 6.4% vs local median 3.3% in Fremont — top-decile yield for the area; either an underpriced asset or a hidden risk that comps aren't pricing in. Stress-test before assuming the spread holds.
Location & tenants
- Location reads 76/100 on livability (#92 in NE, #3,751 nationally) — a middle-class / working-renter tenant base. Strengths: cost of living A+, housing A+, health & safety A+; Watch: employment D+, commute F.
- Fremont Public Schools (town): math 34% / reading 36% proficiency, ranked #103 of 111 in NE (top 93%) — families likely to look elsewhere, expect single-tenant / working-renter base with shorter leases.
- Zoned schools: Washington Elementary School (math 22% / reading 22%, grade F, #459 of 502 statewide, top 93%, 385 students, 81% FRL); Fremont Middle School (math 38% / reading 40%, grade F, #95 of 128 statewide, top 76%, 744 students, 66% FRL); Fremont Senior High School (math 42% / reading 48%, grade D-, #145 of 261 statewide, top 55%, 1,633 students, 55% FRL) — zoned schools average 67% FRL vs 46% district-wide (21 pts higher); higher-poverty schools than district average — tighter screening recommended.
- Market conditions: Rents soft (-2.1%/yr); 238 active listings in the ZIP; 1 comparable units currently listed for rent nearby; 82 units permitted in Dodge County in 2024 (0 in 5+ unit buildings).
Forward outlook
- Local home prices are declining (-3.0%/yr); year-one equity from $1k of loan paydown is wiped out by about $5k of value loss. Plan a longer hold.
Negotiation context
- It's been on market 18 days — a 2% lower offer ($166k) is reasonable based on typical stale-listing flexibility.
- 8 sale attempts since 16y ago with the ask held roughly flat each time — persistent listings suggest the price (not the market) is what's stuck; bring a comps-based counter.
- Current owner paid $114k; 48% above their basis — modest negotiation headroom, anchor on the comps not their cost.
Risks & watch-outs
- Watch-outs: built in 1947 — expect roof / HVAC / electrical / plumbing capex.
Questions for the listing agent
- Built in 1947 — when were the roof, HVAC, electrical panel, plumbing, and water heater last replaced?
- Is there a deadline driving the sale (1031 exchange, divorce, estate, relocation)? That informs how much negotiation room exists.
- The area grade is low — what's the realistic commute time and amenity access for the typical tenant pool here? Any planned neighborhood developments (good or bad) we should know about?
- What's the average days-on-market for RENTAL listings here right now (not sales)? A rising rental-DOM trend means longer vacancies and softer asking-rent achievability than the comps imply.
- What's the recent tenant-quality profile in this submarket — average credit score on applications, eviction rate, late-payment / NSF rate, and stable-employment percentage? A property-management company in the area should have these aggregated.
- How much new for-sale + rental construction is in the pipeline within 1–3 miles? Heavy new supply typically softens prices + rents 12–24 months out; constrained supply supports both.
Investment metrics
- 1% rule
- 0.85% ✗
- Cap rate
- 6.44%
- Cash-on-cash
- 0.53%
- DSCR
- 1.02
- GRM
- 9.8
CMA / ARV
- ARV (on-the-fly)
- $220,860
- Comps found
- 12
Show comp detail 12 sales within ~0.75 mi
| Address | Dist | Beds/Ba | Sqft | Sold | Price | $/sf | Match |
|---|---|---|---|---|---|---|---|
| 646 W 8th St | 0.23mi | 4/1.5 (+1) | 1,727 (+6%) | 1mo | $217,000 | $126 | 72 |
| 239 W 12 St | 0.55mi | 2/1.0 (-1) | 1,631 (-0%) | 1mo | $220,000 | $135 | 68 |
| 1510 W 9th St | 0.70mi | 3/1.0 | 1,718 (+5%) | 1mo | $245,000 | $143 | 58 |
| 425 W Washington St | 0.56mi | 4/1.0 (+1) | 1,615 (-1%) | 11mo | $200,000 | $124 | 58 |
| 1140 N Main St | 0.67mi | 3/1.0 | 1,704 (+4%) | 5mo | $185,000 | $109 | 58 |
| 231 East 3rd St | 0.53mi | 3/2.0 | 1,523 (-7%) | 4mo | $250,000 | $164 | 56 |
| 606 W 10th St | 0.36mi | 3/2.0 | 1,428 (-13%) | 5mo | $175,000 | $123 | 53 |
| 1455 N H St | 0.71mi | 3/2.0 | 1,591 (-3%) | 8mo | $265,000 | $167 | 52 |
| 1425 N Somers Ave | 0.67mi | 3/2.0 | 1,738 (+6%) | 7mo | $250,000 | $144 | 49 |
| 935 M St | 0.33mi | 2/2.0 (-1) | 1,392 (-15%) | 10mo | $170,000 | $122 | 42 |
| 323 E 4th St | 0.59mi | 4/2.0 (+1) | 1,497 (-8%) | 10mo | $236,000 | $158 | 41 |
| 1115 N Park Ave | 0.59mi | 2/2.0 (-1) | 1,440 (-12%) | 11mo | $177,000 | $123 | 34 |
Match score weights: distance 35% · size 25% · config 20% · recency 20%. Top-matched comps best support the ARV.
Projected returns pro-forma
-3.0% appreciation · 0.0% rent growth · sell at horizon
- IRR
- -18.7%
- Equity multiple
- 0.36×
- Total profit
- $-30,266
- Equity at exit
- $25,198
- IRR
- -18.3%
- Equity multiple
- 0.14×
- Total profit
- $-40,909
- Equity at exit
- $14,612
Cash invested: $47,320 (down + closing). Projections, not guarantees.
Landlord ↔ Tenant lean methodology
- Overall (STATE)
- 83 Strongly Landlord-Friendly
- State Nebraska
- 83 Strongly Landlord-Friendly · R+13
- County
- — inherits STATE
- City
- — inherits STATE
ZIP-level market 68025
- Home prices YoY
- -34.1%
- Rents YoY
- -2.1%
- Active inventory
- 238
- Price-to-rent
- 9.8×
Monthly cashflow live
- Estimated rent
- $1,431 medium interval (Pro) →
- Mortgage (P&I)
- −$886
- Tax from tax record
- −$153 /mo · $1,834/yr
- Insurance
- −$70
- HOA
- −$0
- Vacancy / Maint / Mgmt
- −$300
- Net cashflow
- $21
Break-even live
UW: 25.0% down · 7.5% · 30yr · 1.5% tax · 5.0% vac · 8.0% maint · 8.0% mgmt
Financing live
Cash to close
- Down payment
- $42,250
- Closing costs
- $5,070
- Reserves months
- —
- Total cash needed
- —
Loan-product check · same deal, 3 products live
Conventional
25% down · 7.5% · 30yr
- Down + closing
- —
- Monthly P&I
- —
- Monthly cashflow
- —
- DSCR
- —
- Eligible?
- —
Personal DTI + credit; lowest rate.
DSCR
20% down · 8.5% · 30yr
- Down + closing
- —
- Monthly P&I
- —
- Monthly cashflow
- —
- DSCR
- —
- Eligible?
- —
No personal income docs; deal must DSCR.
Hard money
10% down · 12.0% · 12mo
- Down + closing
- —
- Monthly P&I
- —
- Monthly cashflow
- —
- DSCR
- —
- Eligible?
- —
Short-term bridge; refi at stabilization.
Rent comps 1 comps
| Address | Beds | Baths | Sqft | Rent | $/sqft | DOM | Units | Dist |
|---|---|---|---|---|---|---|---|---|
| 1619 E Military Ave Unit 2301 Fremont, NE | 2.0 | 2.0 | 1100 | $1,195 | $1.09 | 21d | 1 | 1.45mi |
Listing history 15 events
-
2026-06-19days on market $169,000 Active 18 DOM
-
2026-06-18days on market $169,000 Active 17 DOM
-
2026-06-17days on market $169,000 Active 16 DOM
-
2026-06-16days on market $169,000 Active 15 DOM
-
2026-06-15days on market $169,000 Active 14 DOM
-
2026-06-14days on market $169,000 Active 12 DOM
-
2026-06-12days on market $169,000 Active 11 DOM
-
2026-06-09days on market $169,000 Active 8 DOM
-
2026-06-09price $169,000 Active 7 DOM
-
2026-06-08days on market $172,000 Active 7 DOM
-
2026-06-07statusdays on market $172,000 Active 6 DOM
-
2026-06-05days on market $172,000 New 3 DOM
-
2026-06-03days on market $172,000 New 2 DOM
-
2026-06-01remarks 589-char remark
-
2026-06-01$172,000 New 1 DOM
ⓘ Source: listings_history table (triggers on properties + properties_extension) + one-shot
backfill from property_details.listing_events for pre-trigger history.
Tax reassessment forecast NE · Resets to sale price
- Current annual tax
- $1,834 · $153/mo
- Projected year-2 tax
- $2,924 · $244/mo
- Expected delta
- +$1,090/yr (+$91/mo · 59.4%)
ⓘ Screening estimate from a state-policy table — verify with the county assessor before closing.
Climate risk First Street
- Flood 3/10 Moderate FEMA zone X (shaded) · 16% chance over 30 yrs
- Wildfire 2/10 Low
- Heat 3/10 Moderate 7 d/yr ≥103°F today · 16 d/yr by 30 yrs out
- Wind 2/10 Low
- Air quality 1/10 Low 0 unhealthy d/yr today · 0 by 30 yrs out
Nearby sold comps map
Loading sold comps map…
Walkable amenities ~0.75 mi
Loading nearby amenities…
Taxation est. · year 1
- Rental income
- $17,169
- − Mortgage interest
- −$9,467
- − Property taxes
- −$1,834
- − Insurance
- −$845
- − Repairs & maintenance
- −$1,374
- − Management
- −$1,374
- − Depreciation
- −$4,916
- Taxable loss
- −$2,639
- Est. tax savings @ 24.0%
- +$633
- After-tax cash flow
- $883/yr
For passive investors: Depreciation is non-cash, so a rental often shows a tax loss while cash-flowing — sheltering income. Rental losses are passive: they offset passive income freely, and up to $25,000/yr can offset ordinary (W-2) income if you actively participate and your MAGI is under $100k (phasing out to $0 by $150k); unused losses carry forward. On sale, claimed depreciation is recaptured at up to 25%, and gains may owe capital-gains tax (a 1031 exchange can defer both). Figures are a year-1 estimate at your 24.0% rate — not tax advice; consult a CPA.
Schools (NCES district)
- District
- Fremont Public Schools
- NCES district ID
- 3170710
- Math proficiency
- 34% ▼ -8.00%
- Reading proficiency
- 36% ▲ 1.00%
- Median HH income
- $47,111
- Composite
- 30.07/100
- National rank
- #6347
- State rank
- #103 of 111 in NE
Livability — Fremont
- Score
- 76/100
- State rank
- #92
- US rank
- #3751
Category grades
Schools grade is shown separately in the Schools card above.
Census & demographics
- Census place
- Fremont, NE
- County
- Dodge County · 31,658 people
- City population
- 31,658
- Metro
- Fremont, NE
- Population (ZIP)
- 31,658
- Household income
- $72,254
- Rent vs Own
- Severe rent burden
- 893.0
Population outlook (Dodge County) Hauer SSP2
- Today (2025)
- 37,191 people
- By 2030
- 37,238 · +0.1%
- By 2040
- 37,256 · +0.2%
- By 2050
- 37,494 · +0.8%
- By 2075
- 39,165 · +5.3%
- By 2100
- 40,221 · +8.1%
Race, ethnicity, and origin ACS 2023
- Neighborhood character
- Predominantly White (78%)
- Race & ethnicity
- White 78% Hispanic / Latino 18% Two or more races 7% Native American 2%
- Hispanic origin (detail)
- Mexican 10%
- Common ancestry
- Portuguese 2% Lithuanian 2% Romanian 2%
- Foreign-born
- 7% · Canada
- Languages at home
- 84% English-only · Spanish 14%
Political lean MEDSL · Dodge
- 2024 margin
- Solid R (+32.6) · D 33.0% · R 65.7% · Other 1.3%
- 2008→2024 swing
- -20.6pp toward R · 2008: -12.0pp · 2024: -32.6pp
- All cycles
- 2024: R+32.6 2020: R+32.1 2016: R+35.3 2012: R+22.7 2008: R+12.0
Not yet ingested
- Civics
- —
Market trends
- HPI YoY
- ▼ -164.59%
- Current HPI
- 318.3329
- Rent YoY
- ▼ -2.14%
- Metro
- Fremont, NE
- State GDP YoY
- ▲ 0.68%
- F500 in state
- 2
Industry mix (Fortune 500 HQ in NE)
| Industry | F500 HQs | Revenue |
|---|---|---|
| Conglomerate | 1 | $371B |
|
||
Price history
+146.1% since first listed19 events — show timeline
- 2026-06-01 Listed $172,000 GPRMLS
- 2019-05-28 Sold (Public Records) $114,000 Public Records
- 2019-05-28 Sold (MLS) $114,000 GPRMLS
- 2019-05-08 Pending — GPRMLS
- 2019-03-01 Listed $125,000 GPRMLS
- 2019-01-20 Listing Removed — GPRMLS
- 2018-07-19 Listed $125,000 GPRMLS
- 2013-08-06 Listing Removed — GPRMLS
- 2013-05-14 Listed $84,599 GPRMLS
- 2012-11-05 Listing Removed — GPRMLS
- 2012-08-04 Listed $89,495 GPRMLS
- 2012-04-20 Sold (MLS) $50,000 GPRMLS
- 2012-04-17 Sold (Public Records) $50,000 Public Records
- 2012-03-26 Listing Removed — GPRMLS
- 2011-11-29 Listing Removed — GPRMLS
- 2011-11-28 Listed $57,900 GPRMLS
- 2011-05-29 Listing Removed — GPRMLS
- 2011-05-28 Listed $59,900 GPRMLS
- 2010-11-28 Listed $69,900 GPRMLS
Property tax history
+4.3%/yrLatest (2025): $1,834 · +45.2% YoY. Source: county tax records.
Cash-flow waterfall
monthlySold comps — $/sqft
last 12 mo · ≤1 miLoading sold comps…