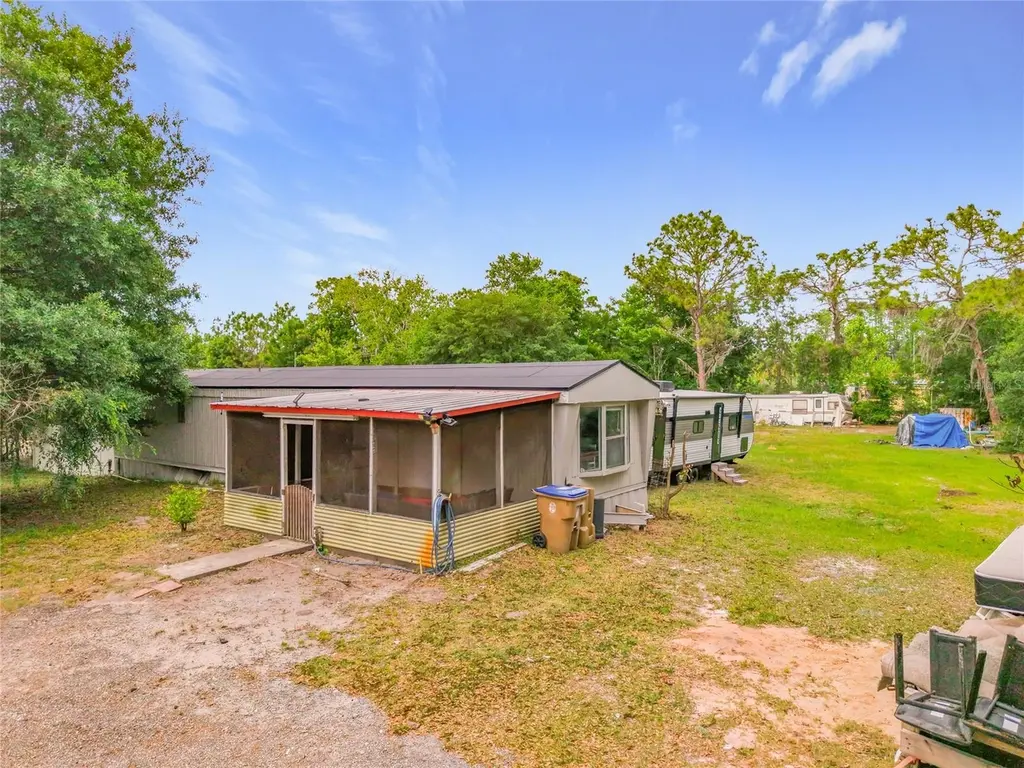
9059 Salem Rd · Saint Cloud, FL
Flood risk 1/10 · Minimal
- FEMA flood zone
- X (unshaded)
- Chance of flooding over 30 yrs
- 0.0%
- Est. flood insurance / yr
- $507 – $1,088
Fire risk 7/10 · Major
- Est. fire insurance / yr
- $947 – $1,759
Heat risk 9/10 · Severe
- Hot days now (above 108°F)
- 7 days/yr
- Hot days in 30 yrs
- 22 days/yr
Wind risk 9/10 · Severe
- Chance of severe wind over 30 yrs
- 99.0%
Air-quality risk 1/10 · Minimal
- Unhealthy air days now
- 0 days/yr
- Unhealthy air days in 30 yrs
- 0 days/yr
Risk factors via First Street. Map © Google.
Why this score? — see what drove the B grade
The composite is a weighted blend of 9 inputs, each scored 0–100. Each bar is that input's sub-score; the figure is the points it added to the 100-point composite (weight × sub-score).
- Cash flow +25.9/30.0
- ARV discount +15.0/15.0
- DSCR +8.7/10.0
- 1% rule +6.6/10.0
- Appreciation +4.8/10.0
- Schools +3.6/10.0
- Rent growth +2.9/5.0
- Livability +2.5/5.0
- Condition / age +2.5/5.0
$200,000
🖨 Deal sheet 📄 Offer letter ✓ Due diligence
Listing remarks
Tucked behind a private gate on one acre, this 2-bedroom, 1-bath manufactured home offers a rare opportunity to enjoy quiet country living with room to spread out. With 784 square feet of living space, the home provides a functional layout and a blank canvas for buyers looking to personalize or invest. The expansive lot delivers privacy, flexibility, and potential—ideal for those seeking space for outdoor living, storage, or future improvements. Located just a short drive from Melbourne Beach, the property also offers convenient access to local schools, shopping, and major roadways, balancing rural tranquility with everyday accessibility. Whether you're a buyer, investor, or someone l
Key facts
- 0.92 acre lot
- Built 1985
- Listed 55 days
Property features AI
Finance
- Other: Property is on approximately 0.92 acres (about 1/2 to less than 1 acre); Road access includes dirt and paved surfaces; One well and one septic on the property; Zoned OPUD
- Financial info: No specific financial details provided
- HOA & community: No HOA/association indicated; Cats and dogs allowed
Exterior
- Parking: Parking details not provided
- Security: No security features listed
- Utilities: Well water; Septic tank; Electricity connected; Cable available
- Home design: Residential manufactured home (single wide); One story; South-facing
- Construction: Vinyl siding; Shingle roof; Crawlspace foundation; Built as a single-wide manufactured home
- Exterior features: Other exterior features
Interior
- Kitchen: Microwave; Range; Refrigerator
- Bedrooms: 2 bedrooms
- Flooring: Tile
- Bathrooms: 1 full bathroom
- Heating & cooling: Central heating; Propane heating; Ductless heating option; Central air conditioning; Wall or window air conditioning units
- Interior features: No special interior features listed
- Laundry & utility: Indoor laundry; Electric water heater
Neighborhood map
What this means for you Summary
Snapshot
- This is a 3-bed/2.0-bath manufactured listed at $200k.
Deal economics
- At list price, monthly cash flow is $492 ($6k/yr) — positive.
- The deal already cash-flows at list — no discount required.
- Meets the 1% rule at list price ($2k rent vs $200k).
- Recommended offer: $194k (3.0% below list) — sets the bar for market timing.
Location & tenants
- Location reads: area grade B — affects rentability + tenant quality, not the cash-flow math above.
- Osceola (suburban): math 39% / reading 45% proficiency, ranked #60 of 73 in FL (top 82%) — families likely to look elsewhere, expect single-tenant / working-renter base with shorter leases; 60% free/reduced lunch — lower-income household profile, screen leases tightly.
- Zoned schools: Harmony Community School (math 70% / reading 64%, grade B+, #450 of 2,144 statewide, top 22%, 1,012 students, 38% FRL); Harmony High School (math 40% / reading 46%, grade F, #255 of 667 statewide, top 39%, 2,822 students, 42% FRL) — zoned schools average 40% FRL vs 60% district-wide (20 pts lower); this property's tenant base skews higher-income than the district average.
- Zoned-school proficiency averages 55% at this address vs 42% district-wide (+13 pts) — the actual schools serving this property are materially stronger than the Osceola average implies; a family-tenant draw the district grade alone would hide.
- Market conditions: Rents rising (+1.8%/yr); 383 active listings in the ZIP; solid renter incomes; 8,813 units permitted in Osceola County in 2024 (3,072 in 5+ unit buildings).
- This rent runs 35% of the median local income ($81k/yr) — at the standard rent-burdened threshold; future hikes will face affordability resistance.
Forward outlook
- In year one you build about $450 of equity ($1k loan paydown + $-933 appreciation (-0.5% local appreciation)).
- Osceola County population projected at +73% by 2050 — long-run rental-demand tailwind backs the buy-and-hold thesis.
- At projected returns (-0.5% appreciation + 1.8% rent growth), your $56k cash investment doubles in ~8 years — after that, you're playing with house money.
Negotiation context
- It's been on market 56 days — a 3% lower offer ($194k) is reasonable based on typical stale-listing flexibility.
- Current owner paid $160k; 25% above their basis — modest negotiation headroom, anchor on the comps not their cost.
Risks & watch-outs
- Climate carrying-cost: severe wind risk, 99% chance of damaging wind over 30y; major wildfire risk; extreme-heat days projected 7→22/yr by 2055 (HVAC capex compounding) — expect insurance premiums to compound above CPI over the hold.
Questions for the listing agent
- It's been on market 56 days. Have you received any prior offers? Is the seller open to a 3% concession, seller financing, or rate buy-down credit?
- Is there a deadline driving the sale (1031 exchange, divorce, estate, relocation)? That informs how much negotiation room exists.
- What's the average days-on-market for RENTAL listings here right now (not sales)? A rising rental-DOM trend means longer vacancies and softer asking-rent achievability than the comps imply.
- What's the recent tenant-quality profile in this submarket — average credit score on applications, eviction rate, late-payment / NSF rate, and stable-employment percentage? A property-management company in the area should have these aggregated.
- How much new for-sale + rental construction is in the pipeline within 1–3 miles? Heavy new supply typically softens prices + rents 12–24 months out; constrained supply supports both.
Investment metrics
- 1% rule
- 1.16% ✓
- Cap rate
- 9.24%
- Cash-on-cash
- 10.54%
- DSCR
- 1.47
- GRM
- 7.2
CMA / ARV
- ARV (on-the-fly)
- $264,992
- Comps found
- 1
Show comp detail 1 sale within ~0.75 mi
| Address | Dist | Beds/Ba | Sqft | Sold | Price | $/sf | Match |
|---|---|---|---|---|---|---|---|
| 9085 Jupiter Dr | 0.62mi | 2/1.5 (-1) | 784 (0%) | 7mo | $265,000 | $338 | 58 |
Match score weights: distance 35% · size 25% · config 20% · recency 20%. Top-matched comps best support the ARV.
Projected returns pro-forma
-0.47% appreciation · 1.79% rent growth · sell at horizon
- IRR
- 7.2%
- Equity multiple
- 1.33×
- Total profit
- $18,352
- Equity at exit
- $53,451
- IRR
- 11.9%
- Equity multiple
- 2.19×
- Total profit
- $66,617
- Equity at exit
- $60,669
Cash invested: $56,000 (down + closing). Projections, not guarantees.
Landlord ↔ Tenant lean methodology
- Overall (STATE)
- 87 Strongly Landlord-Friendly
- State Florida
- 87 Strongly Landlord-Friendly · R+3
- County
- — inherits STATE
- City
- — inherits STATE
ZIP-level market 34773
- Home prices YoY
- -0.2%
- Rents YoY
- 1.8%
- Active inventory
- 383
- Price-to-rent
- 7.2×
Monthly cashflow live
- Estimated rent
- $2,320 medium interval (Pro) →
- Mortgage (P&I)
- −$1,049
- Tax from tax record
- −$209 /mo · $2,506/yr
- Insurance
- −$83
- HOA
- −$0
- Vacancy / Maint / Mgmt
- −$487
- Net cashflow
- $492
Break-even live
UW: 25.0% down · 7.5% · 30yr · 1.5% tax · 5.0% vac · 8.0% maint · 8.0% mgmt
Financing live
Cash to close
- Down payment
- $50,000
- Closing costs
- $6,000
- Reserves months
- —
- Total cash needed
- —
Loan-product check · same deal, 3 products live
Conventional
25% down · 7.5% · 30yr
- Down + closing
- —
- Monthly P&I
- —
- Monthly cashflow
- —
- DSCR
- —
- Eligible?
- —
Personal DTI + credit; lowest rate.
DSCR
20% down · 8.5% · 30yr
- Down + closing
- —
- Monthly P&I
- —
- Monthly cashflow
- —
- DSCR
- —
- Eligible?
- —
No personal income docs; deal must DSCR.
Hard money
10% down · 12.0% · 12mo
- Down + closing
- —
- Monthly P&I
- —
- Monthly cashflow
- —
- DSCR
- —
- Eligible?
- —
Short-term bridge; refi at stabilization.
Listing history 21 events
-
2026-06-18days on market $200,000 Active 56 DOM
-
2026-06-17days on market $200,000 Active 55 DOM
-
2026-06-16days on market $200,000 Active 54 DOM
-
2026-06-15days on market $200,000 Active 53 DOM
-
2026-06-13days on market $200,000 Active 51 DOM
-
2026-06-13days on market $200,000 Active 50 DOM
-
2026-06-09days on market $200,000 Active 47 DOM
-
2026-06-08days on market $200,000 Active 46 DOM
-
2026-06-07days on market $200,000 Active 45 DOM
-
2026-06-04days on market $200,000 Active 42 DOM
-
2026-06-03days on market $200,000 Active 41 DOM
-
2026-06-02days on market $200,000 Active 40 DOM
-
2026-06-01days on market $200,000 Active 39 DOM
-
2026-05-31days on market $200,000 Active 38 DOM
-
2026-05-11price $210,000
-
2026-04-23$220,000 Active
-
2023-12-11soldstatus $160,000
-
2019-03-26soldstatus $67,000
-
2000-03-17soldstatus $32,000
-
1990-04-24soldstatus $6,500
-
1990-04-01soldstatus $6,000
ⓘ Source: listings_history table (triggers on properties + properties_extension) + one-shot
backfill from property_details.listing_events for pre-trigger history.
Tax reassessment forecast FL · Resets to sale price
- Current annual tax
- $2,506 · $209/mo
- Projected year-2 tax
- $2,506 · $209/mo
- Expected delta
- $0/yr ($0/mo · 0.0%)
ⓘ Screening estimate from a state-policy table — verify with the county assessor before closing.
Climate risk First Street
- Flood 1/10 Low FEMA zone X (unshaded) · 0% chance over 30 yrs
- Wildfire 7/10 Severe
- Heat 9/10 Extreme 7 d/yr ≥108°F today · 22 d/yr by 30 yrs out
- Wind 9/10 Extreme 99% chance of damaging wind over 30 yrs
- Air quality 1/10 Low 0 unhealthy d/yr today · 0 by 30 yrs out
Nearby sold comps map
Loading sold comps map…
Walkable amenities ~0.75 mi
Loading nearby amenities…
Taxation est. · year 1
- Rental income
- $27,841
- − Mortgage interest
- −$11,203
- − Property taxes
- −$2,506
- − Insurance
- −$1,000
- − Repairs & maintenance
- −$2,227
- − Management
- −$2,227
- − Depreciation
- −$5,818
- Taxable income
- $2,859
- Est. tax owed @ 24.0%
- −$686
- After-tax cash flow
- $5,217/yr
For passive investors: Depreciation is non-cash, so a rental often shows a tax loss while cash-flowing — sheltering income. Rental losses are passive: they offset passive income freely, and up to $25,000/yr can offset ordinary (W-2) income if you actively participate and your MAGI is under $100k (phasing out to $0 by $150k); unused losses carry forward. On sale, claimed depreciation is recaptured at up to 25%, and gains may owe capital-gains tax (a 1031 exchange can defer both). Figures are a year-1 estimate at your 24.0% rate — not tax advice; consult a CPA.
Schools (NCES district)
- District
- Osceola
- NCES district ID
- 1201470
- Math proficiency
- 39% ▼ -9.00%
- Reading proficiency
- 45% ▼ -4.00%
- Median HH income
- $45,528
- Composite
- 35.7/100
- National rank
- #4865
- State rank
- #60 of 73 in FL
Livability — Saint Cloud
No livability data for this city. (Only ~50 U.S. cities are tracked.)
Census & demographics
- County
- Osceola County · 410,217 people
- City population
- 106,667
- Metro
- Orlando-Kissimmee-Sanford, FL
- Population (ZIP)
- 5,816
- Household income
- $80,524
- Rent vs Own
- Severe rent burden
- 47.0
Population outlook (Osceola County) Hauer SSP2
- Today (2025)
- 447,624 people
- By 2030
- 511,823 · +14.3%
- By 2040
- 642,986 · +43.6%
- By 2050
- 774,552 · +73.0%
- By 2075
- 1,078,144 · +140.9%
- By 2100
- 1,269,660 · +183.6%
Race, ethnicity, and origin ACS 2023
- Neighborhood character
- Majority White (59%)
- Race & ethnicity
- White 59% Hispanic / Latino 33% Two or more races 11%
- Hispanic origin (detail)
- Puerto Rican 20%
- Common ancestry
- Portuguese 5% Slovak 3% Romanian 2%
- Foreign-born
- 12% · Canada, South Korea
- Languages at home
- 67% English-only · Spanish 27% Other Indo-European 4% German/W. Germanic 1%
Political lean MEDSL · Osceola
- 2024 margin
- Toss-up / Even · D 48.7% · R 50.2% · Other 1.1%
- 2008→2024 swing
- -21.2pp toward R · 2008: 19.7pp · 2024: -1.4pp
- All cycles
- 2024: R+1.4 2020: D+13.8 2016: D+25.0 2012: D+24.5 2008: D+19.7
Not yet ingested
- Civics
- —
Market trends
- HPI YoY
- ▼ -0.47%
- Current HPI
- 279.5662
- Rent YoY
- ▲ 1.79%
- Metro
- Orlando-Kissimmee-Sanford, FL
- State GDP YoY
- ▲ 3.28%
- F500 in state
- 36
Industry mix (Fortune 500 HQ in FL)
| Industry | F500 HQs | Revenue |
|---|---|---|
| Industrial Technology | 2 | $29B |
|
||
| Insurance | 2 | $17B |
|
||
| Retail | 1 | $60B |
|
||
| Technology Distribution | 1 | $58B |
|
||
| Homebuilding | 1 | $35B |
|
||
| Technology Manufacturing | 1 | $35B |
|
||
Price history
+3400.0% since first listed7 events — show timeline
- 2026-05-11 Price Changed $210,000 Stellar MLS as Distributed by MLS Grid
- 2026-04-23 Listed $220,000 Stellar MLS as Distributed by MLS Grid
- 2023-12-11 Sold (Public Records) $160,000 Public Records
- 2019-03-26 Sold (Public Records) $67,000 Public Records
- 2000-03-17 Sold (Public Records) $32,000 Public Records
- 1990-04-24 Sold (Public Records) $6,500 Public Records
- 1990-04-01 Sold (Public Records) $6,000 Public Records
Property tax history
+10.2%/yrLatest (2025): $2,506 · +9.7% YoY. Source: county tax records.
Cash-flow waterfall
monthlySold comps — $/sqft
last 12 mo · ≤1 miLoading sold comps…