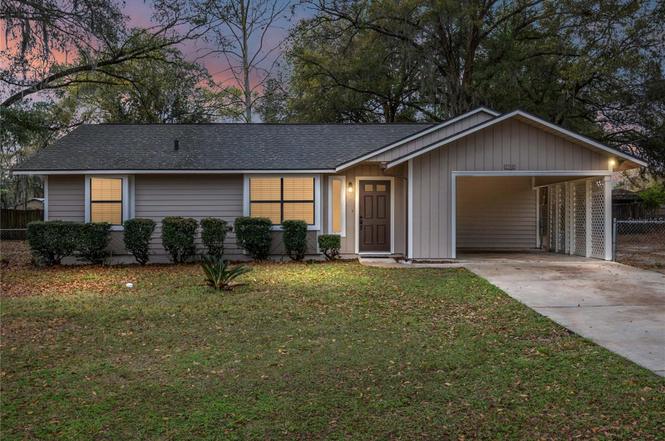
5780 NW 62nd Pl · Ocala, FL
Flood risk 1/10 · Minimal
- FEMA flood zone
- X (unshaded)
- Chance of flooding over 30 yrs
- 0.0%
- Est. flood insurance / yr
- $507 – $1,088
Fire risk 5/10 · Moderate
- Est. fire insurance / yr
- $947 – $1,759
Heat risk 8/10 · Major
- Hot days now (above 107°F)
- 7 days/yr
- Hot days in 30 yrs
- 22 days/yr
Wind risk 9/10 · Severe
- Chance of severe wind over 30 yrs
- 99.0%
Air-quality risk 3/10 · Minor
- Unhealthy air days now
- 4 days/yr
- Unhealthy air days in 30 yrs
- 4 days/yr
Risk factors via First Street. Map © Google.
Why this score? — see what drove the D+ grade
The composite is a weighted blend of 9 inputs, each scored 0–100. Each bar is that input's sub-score; the figure is the points it added to the 100-point composite (weight × sub-score).
- Cash flow +17.7/30.0
- ARV discount +6.2/15.0
- DSCR +5.5/10.0
- Rent growth +5.0/5.0
- 1% rule +4.2/10.0
- Schools +3.6/10.0
- Livability +3.5/5.0
- Condition / age +2.5/5.0
- Appreciation +0.0/10.0
$224,900
🖨 Deal sheet 📄 Offer letter ✓ Due diligence
Listing remarks MLS
Carpet, paint, vinyl and a little TLC will work miracles for this 3/2 home on a large corner lot. Bay windows, kitchen skylight, cathedral ceilings, plant shelves, covered patio, newer roof and water heater and fenced yard make this cedar home an excellent buy. Sold in AS-IS condition.
Key facts
- New hot water heater
- New a/c
- New appliances
Tags
Neighborhood map
What this means for you Summary
Snapshot
- This is a 3-bed/2.0-bath single-family listed at $225k.
Deal economics
- At list price, monthly cash flow is $179 ($2k/yr) — positive.
- The deal already cash-flows at list — no discount required.
- To meet the 1% rule (rent ≥ 1% of price), the offer needs to be $207k (7.8% below list).
- Recommended offer: $207k (7.8% below list) — sets the bar for 1% rule.
- Cap rate 7.2% vs local median 4.2% in Ocala — top-decile yield for the area; either an underpriced asset or a hidden risk that comps aren't pricing in. Stress-test before assuming the spread holds.
Location & tenants
- Location reads 69/100 on livability (#476 in FL) — a middle-class / working-renter tenant base. Strengths: cost of living A+, housing A+, health & safety A+; Watch: crime F, amenities F, commute F.
- Marion (rural): math 42% / reading 43% proficiency, ranked #61 of 73 in FL (top 84%) — families likely to look elsewhere, expect single-tenant / working-renter base with shorter leases; 61% free/reduced lunch — lower-income household profile, screen leases tightly.
- Zoned schools: Fessenden Elementary School (math 37% / reading 37%, grade F, #1,609 of 2,144 statewide, top 77%, 417 students, 79% FRL); North Marion High School (math 20% / reading 32%, grade F, #494 of 667 statewide, top 75%, 1,303 students, 66% FRL).
- Market conditions: Rents rising fast (+11.1%/yr); 663 active listings in the ZIP; 6 comparable units currently listed for rent nearby; rentals at typical pace (median 21d on market — plan ~3-4 weeks tenant-placement turnaround); 7,071 units permitted in Marion County in 2024 (534 in 5+ unit buildings).
- This rent runs 38% of the median local income ($66k/yr) — at the standard rent-burdened threshold; future hikes will face affordability resistance.
Forward outlook
- Local home prices are declining (-3.0%/yr); year-one equity from $2k of loan paydown is wiped out by about $7k of value loss. Plan a longer hold.
- Marion County population projected at +13% by 2050 — modest demand growth; plan on rents tracking national, not racing it.
- At projected returns (-3.0% appreciation + 8.0% rent growth), your $63k cash investment doubles in ~10 years — after that, you're playing with house money.
Negotiation context
- It's been on market 43 days — a 3% lower offer ($218k) is reasonable based on typical stale-listing flexibility.
- 5 sale attempts since 20y ago with the ask held roughly flat each time — persistent listings suggest the price (not the market) is what's stuck; bring a comps-based counter.
- Current owner paid $46k; list at $225k implies a 389% gain — meaningful room to come down on a strong offer.
Risks & watch-outs
- Climate carrying-cost: severe wind risk, 99% chance of damaging wind over 30y; moderate wildfire risk; extreme-heat days projected 7→22/yr by 2055 (HVAC capex compounding) — expect insurance premiums to compound above CPI over the hold.
Questions for the listing agent
- It's been on market 43 days. Have you received any prior offers? Is the seller open to a 8% concession, seller financing, or rate buy-down credit?
- Is there a deadline driving the sale (1031 exchange, divorce, estate, relocation)? That informs how much negotiation room exists.
- Crime grade is F in this area — have there been break-ins, vandalism, or insurance claims at this property in the last 3 years? What carrier currently insures it and at what premium?
- The area grade is low — what's the realistic commute time and amenity access for the typical tenant pool here? Any planned neighborhood developments (good or bad) we should know about?
- What's the average days-on-market for RENTAL listings here right now (not sales)? A rising rental-DOM trend means longer vacancies and softer asking-rent achievability than the comps imply.
- What's the recent tenant-quality profile in this submarket — average credit score on applications, eviction rate, late-payment / NSF rate, and stable-employment percentage? A property-management company in the area should have these aggregated.
- How much new for-sale + rental construction is in the pipeline within 1–3 miles? Heavy new supply typically softens prices + rents 12–24 months out; constrained supply supports both.
Investment metrics
- 1% rule
- 0.92% ✗
- Cap rate
- 7.25%
- Cash-on-cash
- 3.42%
- DSCR
- 1.15
- GRM
- 9.0
CMA / ARV
- ARV (on-the-fly)
- $218,700
- Comps found
- 12
Show comp detail 12 sales within ~0.75 mi
| Address | Dist | Beds/Ba | Sqft | Sold | Price | $/sf | Match |
|---|---|---|---|---|---|---|---|
| 5831 NW 58th Ter | 0.29mi | 3/2.0 | 1,144 (-6%) | 13mo | $227,000 | $198 | 66 |
| 6174 NW 58th Ter | 0.07mi | 3/2.0 | 1,380 (+14%) | 10mo | $239,900 | $174 | 66 |
| 6354 NW 61st Ln | 0.54mi | 3/2.0 | 1,232 (+1%) | 10mo | $225,000 | $183 | 64 |
| 5290 NW 61st Ln | 0.45mi | 3/2.0 | 1,118 (-8%) | 2mo | $175,100 | $157 | 64 |
| 6422 NW 62nd Ave | 0.63mi | 3/2.0 | 1,232 (+1%) | 10mo | $224,000 | $182 | 60 |
| 6276 NW 62nd Ave | 0.41mi | 3/2.0 | 1,380 (+14%) | 1mo | $237,000 | $172 | 57 |
| 5632 NW 57th St | 0.44mi | 3/2.0 | 1,331 (+10%) | 8mo | $239,900 | $180 | 57 |
| 6441 NW 65th Ave | 0.69mi | 3/2.0 | 1,281 (+5%) | 7mo | $212,000 | $165 | 53 |
| 6535 NW 52 Ave | 0.57mi | 3/2.0 | 1,331 (+10%) | 8mo | $239,900 | $180 | 51 |
| 6086 NW 53rd Street Rd | 0.69mi | 3/2.0 | 1,331 (+10%) | 11mo | $239,900 | $180 | 43 |
| 6518 NW 61st St | 0.72mi | 3/2.0 | 1,380 (+14%) | 4mo | $248,900 | $180 | 40 |
| 5430 NW 55th Pl | 0.60mi | 3/2.0 | 1,384 (+14%) | 10mo | $247,000 | $178 | 40 |
Match score weights: distance 35% · size 25% · config 20% · recency 20%. Top-matched comps best support the ARV.
Projected returns pro-forma
-3.0% appreciation · 8.0% rent growth · sell at horizon
- IRR
- -5.7%
- Equity multiple
- 0.78×
- Total profit
- $-14,090
- Equity at exit
- $33,533
- IRR
- 8.9%
- Equity multiple
- 1.83×
- Total profit
- $52,210
- Equity at exit
- $19,445
Cash invested: $62,972 (down + closing). Projections, not guarantees.
Landlord ↔ Tenant lean methodology
- Overall (STATE)
- 87 Strongly Landlord-Friendly
- State Florida
- 87 Strongly Landlord-Friendly · R+3
- County
- — inherits STATE
- City
- — inherits STATE
ZIP-level market 34482
- Rents YoY
- 11.1%
- Active inventory
- 663
- Price-to-rent
- 9.0×
Monthly cashflow live
- Estimated rent
- $2,074 high interval (Pro) →
- Mortgage (P&I)
- −$1,179
- Tax from tax record
- −$186 /mo · $2,232/yr
- Insurance
- −$94
- HOA
- −$0
- Vacancy / Maint / Mgmt
- −$436
- Net cashflow
- $179
Break-even live
UW: 25.0% down · 7.5% · 30yr · 1.5% tax · 5.0% vac · 8.0% maint · 8.0% mgmt
Financing live
Cash to close
- Down payment
- $56,225
- Closing costs
- $6,747
- Reserves months
- —
- Total cash needed
- —
Loan-product check · same deal, 3 products live
Conventional
25% down · 7.5% · 30yr
- Down + closing
- —
- Monthly P&I
- —
- Monthly cashflow
- —
- DSCR
- —
- Eligible?
- —
Personal DTI + credit; lowest rate.
DSCR
20% down · 8.5% · 30yr
- Down + closing
- —
- Monthly P&I
- —
- Monthly cashflow
- —
- DSCR
- —
- Eligible?
- —
No personal income docs; deal must DSCR.
Hard money
10% down · 12.0% · 12mo
- Down + closing
- —
- Monthly P&I
- —
- Monthly cashflow
- —
- DSCR
- —
- Eligible?
- —
Short-term bridge; refi at stabilization.
Rent comps 6 comps
| Address | Beds | Baths | Sqft | Rent | $/sqft | DOM | Units | Dist |
|---|---|---|---|---|---|---|---|---|
| 6175 NW 59th Ave Ocala, FL | 3.0 | 2.0 | 1384 | $1,745 | $1.26 | 21d | 1 | 0.12mi |
| 5907 NW 64th St Ocala, FL | 4.0 | 2.0 | 1313 | $1,699 | $1.29 | 21d | 1 | 0.19mi |
| 5532 NW 57th Pl Ocala, FL | 2.0 | 2.0 | 962 | $1,295 | $1.35 | 13d | 1 | 0.43mi |
| 6425 NW 62nd Ter Ocala, FL | 3.0 | 2.0 | 1349 | $3,000 | $2.22 | 21d | 1 | 0.49mi |
| 5391 NW 55th Ct Ocala, FL | 3.0 | 2.0 | 1332 | $1,650 | $1.24 | 21d | 1 | 0.64mi |
| 6440 NW 66th Ct Ocala, FL | 3.0 | 2.0 | 992 | $1,695 | $1.71 | 13d | 1 | 0.91mi |
Listing history 14 events
-
2026-04-21status Pending
-
2026-04-15price $224,900
-
2026-03-23price $229,900
-
2026-03-09$235,000 Active
-
2008-11-25soldstatus $46,000 286-char remark
Show marketing remark (286 chars)
Carpet, paint, vinyl and a little TLC will work miracles for this 3/2 home on a large corner lot. Bay windows, kitchen skylight, cathedral ceilings, plant shelves, covered patio, newer roof and water heater and fenced yard make this cedar home an excellent buy. Sold in AS-IS condition.
-
2008-08-05$69,900 286-char remark
Show marketing remark (286 chars)
Carpet, paint, vinyl and a little TLC will work miracles for this 3/2 home on a large corner lot. Bay windows, kitchen skylight, cathedral ceilings, plant shelves, covered patio, newer roof and water heater and fenced yard make this cedar home an excellent buy. Sold in AS-IS condition.
-
2008-07-15historical
-
2008-07-15historical
-
2008-07-03$91,900
-
2008-03-24$91,900
-
2006-02-28soldstatus $129,900
-
2006-02-24soldstatus $129,900
-
2006-01-05$129,900
-
1984-10-01soldstatus $44,350
ⓘ Source: listings_history table (triggers on properties + properties_extension) + one-shot
backfill from property_details.listing_events for pre-trigger history.
Tax reassessment forecast FL · Resets to sale price
- Current annual tax
- $2,232 · $186/mo
- Projected year-2 tax
- $2,232 · $186/mo
- Expected delta
- $0/yr ($0/mo · 0.0%)
ⓘ Screening estimate from a state-policy table — verify with the county assessor before closing.
Climate risk First Street
- Flood 1/10 Low FEMA zone X (unshaded) · 0% chance over 30 yrs
- Wildfire 5/10 Major
- Heat 8/10 Severe 7 d/yr ≥107°F today · 22 d/yr by 30 yrs out
- Wind 9/10 Extreme 99% chance of damaging wind over 30 yrs
- Air quality 3/10 Moderate 4 unhealthy d/yr today · 4 by 30 yrs out
Nearby sold comps map
Loading sold comps map…
Walkable amenities ~0.75 mi
Loading nearby amenities…
Taxation est. · year 1
- Rental income
- $24,887
- − Mortgage interest
- −$12,598
- − Property taxes
- −$2,232
- − Insurance
- −$1,124
- − Repairs & maintenance
- −$1,991
- − Management
- −$1,991
- − Depreciation
- −$6,543
- Taxable loss
- −$1,592
- Est. tax savings @ 24.0%
- +$382
- After-tax cash flow
- $2,534/yr
For passive investors: Depreciation is non-cash, so a rental often shows a tax loss while cash-flowing — sheltering income. Rental losses are passive: they offset passive income freely, and up to $25,000/yr can offset ordinary (W-2) income if you actively participate and your MAGI is under $100k (phasing out to $0 by $150k); unused losses carry forward. On sale, claimed depreciation is recaptured at up to 25%, and gains may owe capital-gains tax (a 1031 exchange can defer both). Figures are a year-1 estimate at your 24.0% rate — not tax advice; consult a CPA.
Schools (NCES district)
- District
- Marion
- NCES district ID
- 1201260
- Math proficiency
- 42% ▼ -7.00%
- Reading proficiency
- 43% ▼ -4.00%
- Median HH income
- $40,015
- Composite
- 35.61/100
- National rank
- #4890
- State rank
- #61 of 73 in FL
Livability — Ocala
- Score
- 69/100
- State rank
- #476
- US rank
- #8461
Category grades
Schools grade is shown separately in the Schools card above.
Census & demographics
- County
- Marion County · 315,796 people
- City population
- 263,375
- Metro
- Ocala, FL
- Population (ZIP)
- 22,807
- Household income
- $65,901
- Rent vs Own
- Severe rent burden
- 282.0
Population outlook (Marion County) Hauer SSP2
- Today (2025)
- 365,905 people
- By 2030
- 376,768 · +3.0%
- By 2040
- 396,555 · +8.4%
- By 2050
- 412,723 · +12.8%
- By 2075
- 446,090 · +21.9%
- By 2100
- 436,193 · +19.2%
Race, ethnicity, and origin ACS 2023
- Neighborhood character
- Majority White (63%)
- Race & ethnicity
- White 63% Hispanic / Latino 19% Black 14% Two or more races 12%
- Hispanic origin (detail)
- Mexican 6% Puerto Rican 9% Cuban 2%
- Common ancestry
- Lithuanian 2% Romanian 2% Slovak 2%
- Foreign-born
- 10% · Canada
- Languages at home
- 81% English-only · Spanish 16% Other Indo-European 1%
Political lean MEDSL · Marion
- 2024 margin
- Solid R (+31.6) · D 33.8% · R 65.5%
- 2008→2024 swing
- -20.0pp toward R · 2008: -11.6pp · 2024: -31.6pp
- All cycles
- 2024: R+31.6 2020: R+25.9 2016: R+26.2 2012: R+16.2 2008: R+11.6
Not yet ingested
- Civics
- —
Market trends
- HPI YoY
- ▼ -133.62%
- Current HPI
- 194.3857
- Rent YoY
- ▲ 11.12%
- Metro
- Ocala, FL
- State GDP YoY
- ▲ 3.28%
- F500 in state
- 36
Industry mix (Fortune 500 HQ in FL)
| Industry | F500 HQs | Revenue |
|---|---|---|
| Industrial Technology | 2 | $29B |
|
||
| Insurance | 2 | $17B |
|
||
| Retail | 1 | $60B |
|
||
| Technology Distribution | 1 | $58B |
|
||
| Homebuilding | 1 | $35B |
|
||
| Technology Manufacturing | 1 | $35B |
|
||
Price history
+407.1% since first listed14 events — show timeline
- 2026-04-21 Pending — Stellar MLS as Distributed by MLS Grid
- 2026-04-15 Price Changed $224,900 Stellar MLS as Distributed by MLS Grid
- 2026-03-23 Price Changed $229,900 Stellar MLS as Distributed by MLS Grid
- 2026-03-09 Listed $235,000 Stellar MLS as Distributed by MLS Grid
- 2008-11-25 Sold (MLS) $46,000 Stellar MLS as Distributed by MLS Grid
- 2008-08-05 Listed $69,900 Stellar MLS as Distributed by MLS Grid
- 2008-07-15 Listing Removed — Stellar MLS as Distributed by MLS Grid
- 2008-07-15 Listing Removed — Stellar MLS as Distributed by MLS Grid
- 2008-07-03 Listed $91,900 Stellar MLS as Distributed by MLS Grid
- 2008-03-24 Listed $91,900 Stellar MLS as Distributed by MLS Grid
- 2006-02-28 Sold (Public Records) $129,900 Public Records
- 2006-02-24 Sold (MLS) $129,900 Stellar MLS as Distributed by MLS Grid
- 2006-01-05 Listed $129,900 Stellar MLS as Distributed by MLS Grid
- 1984-10-01 Sold (Public Records) $44,350 Public Records
Property tax history
+8.7%/yrLatest (2025): $2,232 · +10.6% YoY. Source: county tax records.
Cash-flow waterfall
monthlySold comps — $/sqft
last 12 mo · ≤1 miLoading sold comps…