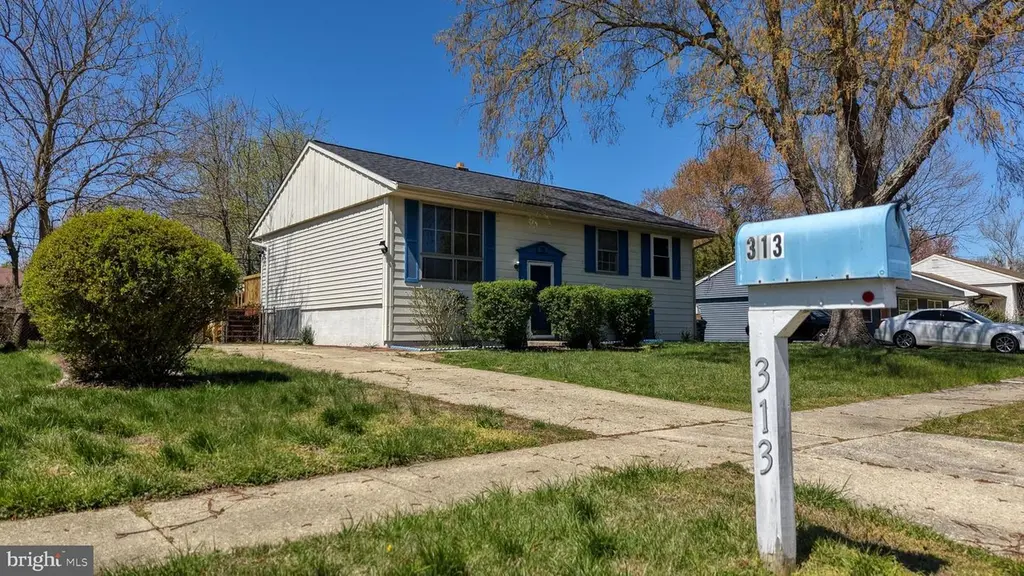
313 Gunning Bedford Dr · Rodney Village, DE
Flood risk 1/10 · Minimal
- FEMA flood zone
- X (unshaded)
- Chance of flooding over 30 yrs
- 0.0%
- Est. flood insurance / yr
- $473 – $860
Fire risk 1/10 · Minimal
- Est. fire insurance / yr
- $476 – $884
Heat risk 8/10 · Major
- Hot days now (above 102°F)
- 7 days/yr
- Hot days in 30 yrs
- 16 days/yr
Wind risk 6/10 · Moderate
- Chance of severe wind over 30 yrs
- 75.0%
Air-quality risk 2/10 · Minimal
- Unhealthy air days now
- 1 days/yr
- Unhealthy air days in 30 yrs
- 2 days/yr
Risk factors via First Street. Map © Google.
Why this score? — see what drove the C+ grade
The composite is a weighted blend of 9 inputs, each scored 0–100. Each bar is that input's sub-score; the figure is the points it added to the 100-point composite (weight × sub-score).
- Cash flow +23.4/30.0
- ARV discount +11.5/15.0
- DSCR +7.5/10.0
- 1% rule +5.1/10.0
- Livability +3.6/5.0
- Rent growth +3.3/5.0
- Schools +3.3/10.0
- Condition / age +2.5/5.0
- Appreciation +0.0/10.0
$255,000
🖨 Deal sheet 📄 Offer letter ✓ Due diligence
Listing remarks MLS
3 Bedroom Raised Rancher With Many Upgrades. Just Price Adjusted With All New Appliances In The Kitchen. "Sellers Say We Want It Sold! New Central Air Is Just One Of The Many Great Things We Have To Offer.
Key facts
- 7,013 sq ft lot
- Built 1960
- Listed 14 days
Neighborhood map
What this means for you Summary
Snapshot
- This is a 3-bed/1.0-bath single-family listed at $255k.
Deal economics
- At list price, monthly cash flow is $472 ($6k/yr) — positive.
- The deal already cash-flows at list — no discount required.
- Meets the 1% rule at list price ($3k rent vs $255k).
Location & tenants
- Location reads 72/100 on livability (#15 in DE) — a middle-class / working-renter tenant base. Strengths: cost of living A+, crime A, housing B+; Watch: amenities F, commute F, employment D-.
- Caesar Rodney School District (suburban): math 26% / reading 49% proficiency, ranked #9 of 26 in DE (top 35%) — families likely to look elsewhere, expect single-tenant / working-renter base with shorter leases.
- Market conditions: Rents rising (+3.3%/yr); 225 active listings in the ZIP; 8 comparable units currently listed for rent nearby; rentals lingering (median 44d on market — plan ~5-8 weeks vacancy on turnover, expect pricing pressure); 100% of comp listings sitting > 30 days — soft ceiling on asking rent; 1,201 units permitted in Kent County in 2024 (116 in 5+ unit buildings).
- At $2,563/mo this rent would consume 46% of the median local household income ($67k/yr) (locally 1500% of renters already pay >50% of income on rent) — very limited rent-growth headroom before tenants either downsize or default.
Forward outlook
- Local home prices are declining (-3.0%/yr); year-one equity from $2k of loan paydown is wiped out by about $8k of value loss. Plan a longer hold.
- Kent County population projected at +22% by 2050 — long-run rental-demand tailwind backs the buy-and-hold thesis.
Negotiation context
- Only 14 days on market — expect competitive offers; lowballing is unlikely to land.
- 3 sale attempts since 29y ago with the ask held roughly flat each time — persistent listings suggest the price (not the market) is what's stuck; bring a comps-based counter.
- Current owner paid $86k; list at $255k implies a 197% gain — meaningful room to come down on a strong offer.
Risks & watch-outs
- Climate carrying-cost: major wind risk, 75% chance of damaging wind over 30y; extreme-heat days projected 7→16/yr by 2055 (HVAC capex compounding) — expect insurance premiums to compound above CPI over the hold.
Questions for the listing agent
- Built in 1960 — when were the roof, HVAC, electrical panel, plumbing, and water heater last replaced?
- Is there a deadline driving the sale (1031 exchange, divorce, estate, relocation)? That informs how much negotiation room exists.
- What's the average days-on-market for RENTAL listings here right now (not sales)? A rising rental-DOM trend means longer vacancies and softer asking-rent achievability than the comps imply.
- What's the recent tenant-quality profile in this submarket — average credit score on applications, eviction rate, late-payment / NSF rate, and stable-employment percentage? A property-management company in the area should have these aggregated.
- How much new for-sale + rental construction is in the pipeline within 1–3 miles? Heavy new supply typically softens prices + rents 12–24 months out; constrained supply supports both.
Investment metrics
- 1% rule
- 1.01% ✓
- Cap rate
- 8.51%
- Cash-on-cash
- 7.93%
- DSCR
- 1.35
- GRM
- 8.3
CMA / ARV
- ARV (median comp)
- $279,676
- List price
- $255,000
- Delta
- -8.82%
- Verdict
- FAIR
- Comps
- 20 within 1.0 mi
Show comp detail 12 sales within ~0.75 mi
| Address | Dist | Beds/Ba | Sqft | Sold | Price | $/sf | Match |
|---|---|---|---|---|---|---|---|
| 274 Samuel Paynter Dr | 0.08mi | 4/1.5 (+1) | 1,924 (+5%) | 12mo | $275,000 | $143 | 71 |
| 118 Lakeview Ave | 0.40mi | 3/2.0 | 1,952 (+6%) | 0mo | $380,000 | $195 | 66 |
| 219 Samuel Paynter Dr | 0.16mi | 3/1.5 | 2,100 (+14%) | 5mo | $200,000 | $95 | 63 |
| 311 Mimosa Ave | 0.42mi | 4/1.5 (+1) | 1,688 (-8%) | 2mo | $335,000 | $198 | 58 |
| 109 Chalet Ct | 0.58mi | 4/1.5 (+1) | 1,856 (+1%) | 8mo | $329,999 | $178 | 58 |
| 60 John Collins Cir | 0.14mi | 3/2.5 | 2,080 (+13%) | 10mo | $325,000 | $156 | 57 |
| 171 Carter Rd | 0.73mi | 3/2.0 | 1,880 (+2%) | 4mo | $235,000 | $125 | 55 |
| 288 Cambridge Rd | 0.53mi | 4/2.5 (+1) | 1,966 (+7%) | 3mo | $377,000 | $192 | 50 |
| 224 Kesselring Ave | 0.51mi | 3/2.0 | 1,651 (-10%) | 11mo | $305,000 | $185 | 46 |
| 302 Kesselring Ave | 0.51mi | 4/2.0 (+1) | 2,010 (+10%) | 9mo | $280,000 | $139 | 44 |
| 142 Carter Ln | 0.55mi | 4/3.0 (+1) | 2,068 (+13%) | 2mo | $353,000 | $171 | 39 |
| 162 Turner Dr | 0.45mi | 3/3.0 | 2,109 (+15%) | 9mo | $352,107 | $167 | 38 |
Match score weights: distance 35% · size 25% · config 20% · recency 20%. Top-matched comps best support the ARV.
Projected returns pro-forma
-3.0% appreciation · 3.3% rent growth · sell at horizon
- IRR
- -4.0%
- Equity multiple
- 0.85×
- Total profit
- $-10,602
- Equity at exit
- $38,021
- IRR
- 6.0%
- Equity multiple
- 1.45×
- Total profit
- $32,279
- Equity at exit
- $22,048
Cash invested: $71,400 (down + closing). Projections, not guarantees.
Landlord ↔ Tenant lean methodology
- Overall (STATE)
- 70 Landlord-Friendly
- State Delaware
- 70 Landlord-Friendly · D+7
- County
- — inherits STATE
- City
- — inherits STATE
ZIP-level market 19904
- Rents YoY
- 3.3%
- Active inventory
- 225
- Price-to-rent
- 8.3×
Monthly cashflow live
- Estimated rent
- $2,563 high interval (Pro) →
- Mortgage (P&I)
- −$1,337
- Tax from tax record
- −$110 /mo · $1,318/yr
- Insurance
- −$106
- HOA
- −$0
- Vacancy / Maint / Mgmt
- −$538
- Net cashflow
- $472
Break-even live
UW: 25.0% down · 7.5% · 30yr · 1.5% tax · 5.0% vac · 8.0% maint · 8.0% mgmt
Financing live
Cash to close
- Down payment
- $63,750
- Closing costs
- $7,650
- Reserves months
- —
- Total cash needed
- —
Loan-product check · same deal, 3 products live
Conventional
25% down · 7.5% · 30yr
- Down + closing
- —
- Monthly P&I
- —
- Monthly cashflow
- —
- DSCR
- —
- Eligible?
- —
Personal DTI + credit; lowest rate.
DSCR
20% down · 8.5% · 30yr
- Down + closing
- —
- Monthly P&I
- —
- Monthly cashflow
- —
- DSCR
- —
- Eligible?
- —
No personal income docs; deal must DSCR.
Hard money
10% down · 12.0% · 12mo
- Down + closing
- —
- Monthly P&I
- —
- Monthly cashflow
- —
- DSCR
- —
- Eligible?
- —
Short-term bridge; refi at stabilization.
Rent comps 8 comps
| Address | Beds | Baths | Sqft | Rent | $/sqft | DOM | Units | Dist |
|---|---|---|---|---|---|---|---|---|
| 541 Ruth Way Dover, DE | 4.0 | 2.5 | 1761 | $3,200 | $1.82 | 44d | 1 | 1.10mi |
| 511 Nickerjack Way Dover, DE | 3.0 | 2.0 | 1569 | $2,800 | $1.78 | 44d | 1 | 1.15mi |
| 502 Horsey Blvd Dover, DE | 3.0 | 2.0 | 1604 | $2,900 | $1.81 | 44d | 1 | 1.18mi |
| 629 Ruth Way Dover, DE | 3.0–4.0 | 2.0–2.5 | 1665 | $2,850 | $1.71 | 44d | 13 | 1.32mi |
| 215 Royal Grant Way Dover, DE | 4.0 | 2.5 | 2028 | $2,500 | $1.23 | 44d | 1 | 1.36mi |
| 300 East St Camden, DE | 1.0–3.0 | 1.0–2.0 | 1272 | $2,695 | $2.12 | 44d | 1 | 1.38mi |
| 424 Ridgely Blvd Dover, DE | 3.0 | 2.5 | 1432 | $2,000 | $1.40 | 44d | 1 | 1.40mi |
| 205 Ridgely Blvd Dover, DE | 3.0 | 2.5 | 1432 | $2,000 | $1.40 | 44d | 1 | 1.47mi |
Listing history 9 events
-
2026-05-15status Active
-
2026-04-24status Pending
-
2026-04-20$255,000 Active
-
2026-04-14historical $255,000
-
1998-07-15soldstatus $86,000
-
1998-07-15soldstatus $86,000
-
1998-06-26soldstatus $86,000 210-char remark
Show marketing remark (210 chars)
3 Bedroom Raised Rancher With Many Upgrades. Just Price Adjusted With All New Appliances In The Kitchen. "Sellers Say We Want It Sold! New Central Air Is Just One Of The Many Great Things We Have To Offer.
-
1998-04-29historical 210-char remark
Show marketing remark (210 chars)
3 Bedroom Raised Rancher With Many Upgrades. Just Price Adjusted With All New Appliances In The Kitchen. "Sellers Say We Want It Sold! New Central Air Is Just One Of The Many Great Things We Have To Offer.
-
1997-09-08$86,000 210-char remark
Show marketing remark (210 chars)
3 Bedroom Raised Rancher With Many Upgrades. Just Price Adjusted With All New Appliances In The Kitchen. "Sellers Say We Want It Sold! New Central Air Is Just One Of The Many Great Things We Have To Offer.
ⓘ Source: listings_history table (triggers on properties + properties_extension) + one-shot
backfill from property_details.listing_events for pre-trigger history.
Tax reassessment forecast DE · Partial reset (capped growth)
- Current annual tax
- $1,318 · $110/mo
- Projected year-2 tax
- $1,398 · $117/mo
- Expected delta
- +$81/yr (+$7/mo · 6.1%)
ⓘ Screening estimate from a state-policy table — verify with the county assessor before closing.
Climate risk First Street
- Flood 1/10 Low FEMA zone X (unshaded) · 0% chance over 30 yrs
- Wildfire 1/10 Low
- Heat 8/10 Severe 7 d/yr ≥102°F today · 16 d/yr by 30 yrs out
- Wind 6/10 Major 75% chance of damaging wind over 30 yrs
- Air quality 2/10 Low 1 unhealthy d/yr today · 2 by 30 yrs out
Nearby sold comps map
Loading sold comps map…
Walkable amenities ~0.75 mi
Loading nearby amenities…
Taxation est. · year 1
- Rental income
- $30,757
- − Mortgage interest
- −$14,284
- − Property taxes
- −$1,318
- − Insurance
- −$1,275
- − Repairs & maintenance
- −$2,461
- − Management
- −$2,461
- − Depreciation
- −$7,418
- Taxable income
- $1,541
- Est. tax owed @ 24.0%
- −$370
- After-tax cash flow
- $5,289/yr
For passive investors: Depreciation is non-cash, so a rental often shows a tax loss while cash-flowing — sheltering income. Rental losses are passive: they offset passive income freely, and up to $25,000/yr can offset ordinary (W-2) income if you actively participate and your MAGI is under $100k (phasing out to $0 by $150k); unused losses carry forward. On sale, claimed depreciation is recaptured at up to 25%, and gains may owe capital-gains tax (a 1031 exchange can defer both). Figures are a year-1 estimate at your 24.0% rate — not tax advice; consult a CPA.
Schools (NCES district)
- District
- Caesar Rodney School District
- NCES district ID
- 1000180
- Math proficiency
- 26% ▼ -21.00%
- Reading proficiency
- 49% ▼ -14.00%
- Median HH income
- $61,187
- Composite
- 33.4/100
- National rank
- #5475
- State rank
- #9 of 26 in DE
Livability — Rodney Village
- Score
- 72/100
- State rank
- #15
- US rank
- #5991
Category grades
Schools grade is shown separately in the Schools card above.
Census & demographics
- Census place
- Rodney Village, DE
- County
- Kent County · 82,184 people
- Metro
- Dover, DE
- Population (ZIP)
- 38,818
- Household income
- $66,908
- Rent vs Own
- Severe rent burden
- 1500.0
Population outlook (Kent County) Hauer SSP2
- Today (2025)
- 194,477 people
- By 2030
- 204,351 · +5.1%
- By 2040
- 222,135 · +14.2%
- By 2050
- 236,483 · +21.6%
- By 2075
- 266,327 · +36.9%
- By 2100
- 275,335 · +41.6%
Race, ethnicity, and origin ACS 2023
- Neighborhood character
- Diverse neighborhood (Simpson 0.64)
- Race & ethnicity
- White 48% Black 35% Two or more races 9% Hispanic / Latino 8% Asian 3%
- Hispanic origin (detail)
- Mexican 1% Puerto Rican 4%
- Common ancestry
- Hispanic 3% Romanian 2% Slovak 2%
- Foreign-born
- 10% · Canada, South Korea
- Languages at home
- 87% English-only · Spanish 5% French/Haitian/Cajun 3% German/W. Germanic 1%
Political lean MEDSL · Kent
- 2024 margin
- Toss-up / Even · D 50.2% · R 48.2% · Other 1.7%
- 2008→2024 swing
- -7.8pp toward R · 2008: 9.8pp · 2024: 2.0pp
- All cycles
- 2024: D+2.0 2020: D+4.1 2016: R+4.9 2012: D+4.9 2008: D+9.8
Not yet ingested
- Civics
- —
Market trends
- HPI YoY
- ▼ -112.03%
- Current HPI
- 187.6879
- Rent YoY
- ▲ 3.30%
- Metro
- Dover, DE
- State GDP YoY
- —
- F500 in state
- 0
Price history
+196.5% since first listed9 events — show timeline
- 2026-05-15 Relisted — BRIGHT MLS
- 2026-04-24 Pending — BRIGHT MLS
- 2026-04-20 Listed $255,000 BRIGHT MLS
- 2026-04-14 Coming Soon $255,000 BRIGHT MLS
- 1998-07-15 Sold (Public Records) $86,000 Public Records
- 1998-07-15 Sold (Public Records) $86,000 Public Records
- 1998-06-26 Sold (MLS) $86,000 BRIGHT MLS
- 1998-04-29 Listing Removed — BRIGHT MLS
- 1997-09-08 Listed $86,000 BRIGHT MLS
Property tax history
+7.1%/yrLatest (2025): $1,318 · +2.7% YoY. Source: county tax records.
Cash-flow waterfall
monthlySold comps — $/sqft
last 12 mo · ≤1 miLoading sold comps…