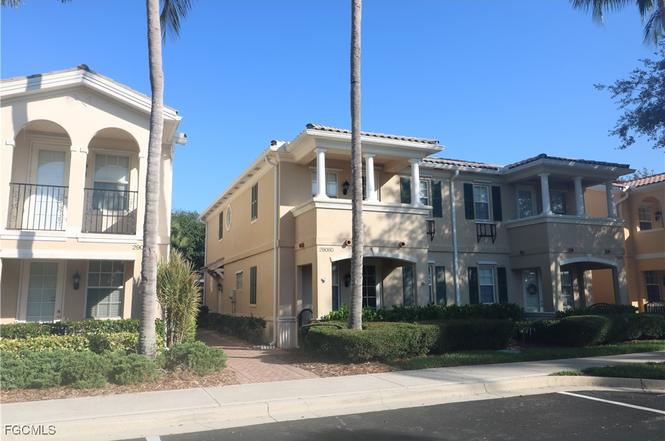
29080 Alessandria Cir · Bonita Springs, FL
Flood risk 1/10 · Minimal
- FEMA flood zone
- X (unshaded)
- Chance of flooding over 30 yrs
- 0.0%
- Est. flood insurance / yr
- $507 – $1,088
Fire risk 6/10 · Moderate
- Est. fire insurance / yr
- $947 – $1,759
Heat risk 10/10 · Severe
- Hot days now (above 108°F)
- 7 days/yr
- Hot days in 30 yrs
- 31 days/yr
Wind risk 10/10 · Severe
- Chance of severe wind over 30 yrs
- 99.0%
Air-quality risk 2/10 · Minimal
- Unhealthy air days now
- 2 days/yr
- Unhealthy air days in 30 yrs
- 2 days/yr
Risk factors via First Street. Map © Google.
Why this score? — see what drove the B- grade
The composite is a weighted blend of 9 inputs, each scored 0–100. Each bar is that input's sub-score; the figure is the points it added to the 100-point composite (weight × sub-score).
- Cash flow +28.8/30.0
- DSCR +10.0/10.0
- 1% rule +9.0/10.0
- ARV discount +7.5/15.0
- Schools +4.1/10.0
- Livability +3.5/5.0
- Condition / age +2.5/5.0
- Rent growth +2.3/5.0
- Appreciation +0.0/10.0
$349,900
🖨 Deal sheet 📄 Offer letter ✓ Due diligence
Listing remarks
Welcome to this beautifully appointed 4-bedroom, 3-bath townhome located in the sought-after, gated community of San Remo in the heart of Estero. Offering almost 1900 square feet of well-designed living space, this two-story home combines comfort, style, and functionality—perfect for full-time residents or seasonal living. The bright and open floor plan features a spacious great room with high ceilings, tile flooring, and sliding glass doors that lead to a private screened lanai—ideal for morning coffee or relaxing evenings. The well-equipped kitchen offers solid surface countertops, ample cabinetry, a breakfast bar, and a cozy dining nook. This versatile layout includes one bed
Key facts
- Gated community
- Fitness center
- Tennis courts
Tags
Property features AI
Finance
- Other: Irrigation included in assessment; PUD zoning; Lot information from appraiser
- HOA & community: Homeowners association (330 units in community); Quarterly association fee; Association services include management, cable TV, irrigation water, legal/accounting, grounds maintenance, pest control, road maintenance and street lights; Community amenities: clubhouse, playground, pickleball, park, pool, sidewalks, tennis courts
Exterior
- Parking: Detached garage with garage door opener; 2 covered garage spaces
- Security: Gated community; Street lights
- Utilities: Public water; Sewer assessment paid; Cable available
- Home design: 2 stories; Entry level is 1; Faces southeast; Northwest exposure
- Construction: Built with block, concrete and stucco; Tile roof; Zero lot line
- Exterior features: Courtyard; Sprinkler/irrigation (automatic); Privacy wall; Balcony; Community pool
Interior
- Kitchen: Dishwasher; Disposal; Icemaker; Microwave; Range; Refrigerator (with ice maker)
- Bedrooms: Bedroom on main level; Guest quarters
- Flooring: Carpet; Tile
- Bathrooms: 3 full bathrooms; Dual sinks; Separate shower; Bathtub
- Heating & cooling: Central heating (electric); Central air conditioning (electric); Ceiling fans
- Interior features: Breakfast bar; Bathtub; Dual sinks; High ceilings; Living/dining room; Separate shower; Cable TV; High speed internet; Single-hung windows; Unfurnished
- Laundry & utility: Washer hookup inside; Dryer hookup inside
Neighborhood map
What this means for you Summary
Snapshot
- This is a 3-bed/3.0-bath condo listed at $350k.
Deal economics
- At list price, monthly cash flow is $1k ($14k/yr) — positive.
- The deal already cash-flows at list — no discount required.
- Meets the 1% rule at list price ($5k rent vs $350k).
- Recommended offer: $308k (12.0% below list) — sets the bar for market timing.
- Cap rate 10.3% vs local median 1.7% in Bonita Springs — top-decile yield for the area; either an underpriced asset or a hidden risk that comps aren't pricing in. Stress-test before assuming the spread holds.
Location & tenants
- Location reads 70/100 on livability (#428 in FL) — a middle-class / working-renter tenant base. Strengths: crime A+, housing A+, employment A; Watch: schools C-, cost of living C-, health & safety D.
- Lee (suburban): math 47% / reading 50% proficiency, ranked #42 of 73 in FL (top 58%) — families likely to look elsewhere, expect single-tenant / working-renter base with shorter leases.
- Market conditions: Rents soft (-0.6%/yr); 835 active listings in the ZIP; 30 comparable units currently listed for rent nearby; rentals at typical pace (median 24d on market — plan ~3-4 weeks tenant-placement turnaround); solid renter incomes; 15,411 units permitted in Lee County in 2024 (4,686 in 5+ unit buildings).
- At $4,886/mo this rent would consume 64% of the median local household income ($91k/yr) (locally 976% of renters already pay >50% of income on rent) — very limited rent-growth headroom before tenants either downsize or default.
Forward outlook
- Local home prices are declining (-3.0%/yr); year-one equity from $2k of loan paydown is wiped out by about $10k of value loss. Plan a longer hold.
- Lee County population projected at +44% by 2050 — long-run rental-demand tailwind backs the buy-and-hold thesis.
Negotiation context
- It's been on market 125 days — a 12% lower offer ($308k) is reasonable based on typical stale-listing flexibility.
- 6 sale attempts since 4y ago; this cycle's ask has dropped $45k (11%) from the opening price — seller is motivated, your offer sets the floor, not the list.
- Current owner paid $270k; 30% above their basis — modest negotiation headroom, anchor on the comps not their cost.
Risks & watch-outs
- Climate carrying-cost: severe wind risk, 99% chance of damaging wind over 30y; major wildfire risk; extreme-heat days projected 7→31/yr by 2055 (HVAC capex compounding) — expect insurance premiums to compound above CPI over the hold.
Questions for the listing agent
- It's been on market 125 days. Have you received any prior offers? Is the seller open to a 12% concession, seller financing, or rate buy-down credit?
- What does the HOA fee cover, when was the last increase, and are there any pending special assessments or reserve-fund shortfalls?
- Any open or pending special assessments — roof, HVAC, plumbing, elevator, façade? What's the per-unit balance and payoff schedule, and is the seller paying it off at close or rolling it to the buyer?
- Why hasn't it sold? Are there any deal-killer items the seller is aware of (foundation, flood, title, zoning, code violations)?
- Is there a deadline driving the sale (1031 exchange, divorce, estate, relocation)? That informs how much negotiation room exists.
- What's the average days-on-market for RENTAL listings here right now (not sales)? A rising rental-DOM trend means longer vacancies and softer asking-rent achievability than the comps imply.
- What's the recent tenant-quality profile in this submarket — average credit score on applications, eviction rate, late-payment / NSF rate, and stable-employment percentage? A property-management company in the area should have these aggregated.
- How much new apartment / multifamily construction is in the pipeline within 1–3 miles? Heavy new supply (>2% of stock underway) typically softens rents 12–24 months out; light construction supports rent growth.
Investment metrics
- 1% rule
- 1.40% ✓
- Cap rate
- 10.32%
- Cash-on-cash
- 14.38%
- DSCR
- 1.64
- GRM
- 6.0
CMA / ARV
No comps found within radius.
Projected returns pro-forma
-3.0% appreciation · 0.0% rent growth · sell at horizon
- IRR
- 1.1%
- Equity multiple
- 1.04×
- Total profit
- $3,971
- Equity at exit
- $52,171
- IRR
- 7.2%
- Equity multiple
- 1.46×
- Total profit
- $45,339
- Equity at exit
- $30,253
Cash invested: $97,972 (down + closing). Projections, not guarantees.
Landlord ↔ Tenant lean methodology
- Overall (STATE)
- 87 Strongly Landlord-Friendly
- State Florida
- 87 Strongly Landlord-Friendly · R+3
- County
- — inherits STATE
- City
- — inherits STATE
ZIP-level market 34135
- Rents YoY
- -0.6%
- Active inventory
- 835
- Price-to-rent
- 6.0×
Monthly cashflow live
- Estimated rent
- $4,886 high interval (Pro) →
- Mortgage (P&I)
- −$1,835
- Tax from tax record
- −$355 /mo · $4,259/yr
- Insurance
- −$146
- HOA
- −$351
- Vacancy / Maint / Mgmt
- −$1,026
- Net cashflow
- $1,174
Break-even live
UW: 25.0% down · 7.5% · 30yr · 1.5% tax · 5.0% vac · 8.0% maint · 8.0% mgmt
Financing live
Cash to close
- Down payment
- $87,475
- Closing costs
- $10,497
- Reserves months
- —
- Total cash needed
- —
Loan-product check · same deal, 3 products live
Conventional
25% down · 7.5% · 30yr
- Down + closing
- —
- Monthly P&I
- —
- Monthly cashflow
- —
- DSCR
- —
- Eligible?
- —
Personal DTI + credit; lowest rate.
DSCR
20% down · 8.5% · 30yr
- Down + closing
- —
- Monthly P&I
- —
- Monthly cashflow
- —
- DSCR
- —
- Eligible?
- —
No personal income docs; deal must DSCR.
Hard money
10% down · 12.0% · 12mo
- Down + closing
- —
- Monthly P&I
- —
- Monthly cashflow
- —
- DSCR
- —
- Eligible?
- —
Short-term bridge; refi at stabilization.
Rent comps 30 comps
| Address | Beds | Baths | Sqft | Rent | $/sqft | DOM | Units | Dist |
|---|---|---|---|---|---|---|---|---|
| 14552 Bellino Ter #201 Bonita Springs, FL | 3.0 | 2.5 | 2297 | $7,500 | $3.27 | 23d | 1 | 0.13mi |
| 28086 Sosta Ln #1 Bonita Springs, FL | 2.0 | 2.0 | 1402 | $2,300 | $1.64 | 3d | 1 | 0.14mi |
| 28050 Boccaccio Way Bonita Springs, FL | 2.0 | 2.0 | 1534 | $2,600 | $1.69 | 23d | 1 | 0.16mi |
| 28008 Sosta Ln #4 Bonita Springs, FL | 3.0 | 2.0 | 1541 | $6,000 | $3.89 | 23d | 1 | 0.18mi |
| 28576 Alessandria Cir Bonita Springs, FL | 3.0 | 3.0 | 1868 | $2,595 | $1.39 | 19d | 1 | 0.20mi |
| 14706 Escalante Way Bonita Springs, FL | 3.0 | 3.0 | 1868 | $2,600 | $1.39 | 23d | 1 | 0.30mi |
| 28719 Alessandria Cir Bonita Springs, FL | 3.0 | 3.0 | 1868 | $2,400 | $1.28 | 23d | 1 | 0.32mi |
| 14099 Tivoli Ter Bonita Springs, FL | 3.0 | 2.0 | 2205 | $3,500 | $1.59 | 13d | 1 | 0.45mi |
| 28000 Quiet Water Way Bonita Springs, FL | 3.0 | 2.0 | 2174 | $6,250 | $2.87 | 23d | 1 | 0.69mi |
| 28068 Cavendish Ct #2310 Bonita Springs, FL | 2.0 | 2.0 | 1339 | $5,500 | $4.11 | 23d | 1 | 0.72mi |
| 28048 Cavendish Ct #5904 Bonita Springs, FL | 2.0 | 2.0 | 1446 | $6,500 | $4.50 | 21d | 1 | 0.78mi |
| 15107 Auk Way Bonita Springs, FL | 3.0 | 3.0 | 1868 | $6,200 | $3.32 | 21d | 1 | 0.87mi |
| 28495 Villagewalk Blvd Bonita Springs, FL | 3.0 | 3.0 | 1868 | $3,500 | $1.87 | 15d | 1 | 0.90mi |
| 28648 San Lucas Ln #102 Bonita Springs, FL | 2.0 | 2.0 | 1940 | $8,000 | $4.12 | 23d | 1 | 0.91mi |
| 15317 Laughing Gull Ln Bonita Springs, FL | 3.0 | 3.0 | 1800 | $6,700 | $3.72 | 23d | 1 | 0.93mi |
| 28751 Xenon Way Bonita Springs, FL | 3.0 | 2.0 | 1661 | $2,650 | $1.60 | 3d | 1 | 0.96mi |
| 13962 Southampton Dr #4404 Bonita Springs, FL | 2.0 | 2.0 | 1446 | $6,500 | $4.50 | 23d | 1 | 0.99mi |
| 13520 Southampton Dr Bonita Springs, FL | 3.0 | 2.0 | 1642 | $8,000 | $4.87 | 23d | 1 | 1.00mi |
| 15369 Laughing Gull Ln Bonita Springs, FL | 3.0 | 3.0 | 1868 | $4,999 | $2.68 | 23d | 1 | 1.01mi |
| 28869 Vermillion Ln Bonita Springs, FL | 2.0 | 2.0 | 1534 | $4,000 | $2.61 | 15d | 1 | 1.03mi |
| 28329 Moray Dr Bonita Springs, FL | 4.0 | 3.0 | 2518 | $3,400 | $1.35 | 23d | 1 | 1.10mi |
| 28207 Islet Trl Bonita Springs, FL | 2.0 | 2.0 | 1534 | $3,300 | $2.15 | 23d | 1 | 1.13mi |
| 13611 Worthington Way #1312 Bonita Springs, FL | 3.0 | 2.0 | 1312 | $5,500 | $4.19 | 23d | 1 | 1.22mi |
| 15561 Latitude Dr Bonita Springs, FL | 3.0 | 3.0 | 1868 | $5,600 | $3.00 | 23d | 1 | 1.26mi |
| 13360 Bridgeford Ave Bonita Springs, FL | 4.0 | 3.0 | 2609 | $12,000 | $4.60 | 3d | 1 | 1.29mi |
| 13270 Sherburne Cir #2903 Bonita Springs, FL | 2.0 | 2.0 | 1487 | $6,000 | $4.03 | 23d | 1 | 1.39mi |
| 13260 Sherburne Cir #2704 Bonita Springs, FL | 2.0 | 2.0 | 1446 | $6,500 | $4.50 | 21d | 1 | 1.39mi |
| 15382 Queen Angel Way Bonita Springs, FL | 2.0 | 2.0 | 1534 | $1,500 | $0.98 | 3d | 1 | 1.39mi |
| 13256 Sherburne Cir #2603 Bonita Springs, FL | 3.0 | 2.0 | 1576 | $6,500 | $4.12 | 23d | 1 | 1.39mi |
| 13231 Sherburne Cir #1504 Bonita Springs, FL | 2.0 | 2.0 | 1446 | $6,500 | $4.50 | 23d | 1 | 1.44mi |
HOA detail condo
- Monthly dues
- $351 · $4,212/yr
- Likely covers
- security
- Assessments
- None detected in remarks — confirm with the listing agent.
Listing history 21 events
-
2026-05-13status Pending
-
2026-05-04price $349,900
-
2026-04-15price $379,900
-
2026-01-29price $384,900
-
2026-01-08$394,900 Active
-
2025-12-31historical
-
2025-07-08$399,900 Active
-
2025-06-30historical
-
2025-04-23price $399,900
-
2025-03-04price $429,900
-
2025-01-08$439,900 Active
-
2024-12-31historical
-
2024-11-11price $439,900
-
2024-06-06$449,900 Active
-
2022-09-26historical
-
2022-08-09status Active
-
2022-07-31historical
-
2022-06-21price $449,900
-
2022-05-26$469,900 Active
-
2005-04-04soldstatus $270,000
-
2002-10-04soldstatus $14,176,400
ⓘ Source: listings_history table (triggers on properties + properties_extension) + one-shot
backfill from property_details.listing_events for pre-trigger history.
Tax reassessment forecast FL · Resets to sale price
- Current annual tax
- $4,259 · $355/mo
- Projected year-2 tax
- $4,259 · $355/mo
- Expected delta
- $0/yr ($0/mo · 0.0%)
ⓘ Screening estimate from a state-policy table — verify with the county assessor before closing.
Climate risk First Street
- Flood 1/10 Low FEMA zone X (unshaded) · 0% chance over 30 yrs
- Wildfire 6/10 Major
- Heat 10/10 Extreme 7 d/yr ≥108°F today · 31 d/yr by 30 yrs out
- Wind 10/10 Extreme 99% chance of damaging wind over 30 yrs
- Air quality 2/10 Low 2 unhealthy d/yr today · 2 by 30 yrs out
Nearby sold comps map
Loading sold comps map…
Walkable amenities ~0.75 mi
Loading nearby amenities…
Taxation est. · year 1
- Rental income
- $58,638
- − Mortgage interest
- −$19,600
- − Property taxes
- −$4,259
- − Insurance
- −$1,750
- − Repairs & maintenance
- −$4,691
- − Management
- −$4,691
- − HOA
- −$4,212
- − Depreciation
- −$10,179
- Taxable income
- $9,256
- Est. tax owed @ 24.0%
- −$2,221
- After-tax cash flow
- $11,862/yr
For passive investors: Depreciation is non-cash, so a rental often shows a tax loss while cash-flowing — sheltering income. Rental losses are passive: they offset passive income freely, and up to $25,000/yr can offset ordinary (W-2) income if you actively participate and your MAGI is under $100k (phasing out to $0 by $150k); unused losses carry forward. On sale, claimed depreciation is recaptured at up to 25%, and gains may owe capital-gains tax (a 1031 exchange can defer both). Figures are a year-1 estimate at your 24.0% rate — not tax advice; consult a CPA.
Schools (NCES district)
- District
- Lee
- NCES district ID
- 1201080
- Math proficiency
- 47% ▼ -11.00%
- Reading proficiency
- 50% ▼ -4.00%
- Median HH income
- $49,518
- Composite
- 41.49/100
- National rank
- #3458
- State rank
- #42 of 73 in FL
Livability — Bonita Springs
- Score
- 70/100
- State rank
- #428
- US rank
- #7576
Category grades
Schools grade is shown separately in the Schools card above.
Census & demographics
- Census place
- Bonita Springs, FL
- County
- Lee County · 788,662 people
- City population
- 31,926
- Metro
- Cape Coral-Fort Myers, FL
- Population (ZIP)
- 48,252
- Household income
- $91,380
- Rent vs Own
- Severe rent burden
- 976.0
Population outlook (Lee County) Hauer SSP2
- Today (2025)
- 871,946 people
- By 2030
- 955,468 · +9.6%
- By 2040
- 1,113,587 · +27.7%
- By 2050
- 1,256,891 · +44.1%
- By 2075
- 1,560,270 · +78.9%
- By 2100
- 1,726,848 · +98.0%
Race, ethnicity, and origin ACS 2023
- Neighborhood character
- Predominantly White (69%)
- Race & ethnicity
- White 69% Hispanic / Latino 26% Two or more races 13% Native American 3% Black 2%
- Hispanic origin (detail)
- Mexican 8% Puerto Rican 4% Cuban 3%
- Common ancestry
- Romanian 5% Lithuanian 2% Slovak 2%
- Foreign-born
- 22% · Canada, Jamaica
- Languages at home
- 74% English-only · Spanish 21% French/Haitian/Cajun 1% Russian/Polish/Slavic 1%
Political lean MEDSL · Lee
- 2024 margin
- Strong R (+28.4) · D 35.5% · R 63.9%
- 2008→2024 swing
- -18.0pp toward R · 2008: -10.4pp · 2024: -28.4pp
- All cycles
- 2024: R+28.4 2020: R+19.2 2016: R+20.4 2012: R+16.6 2008: R+10.4
Not yet ingested
- Civics
- —
Market trends
- HPI YoY
- ▼ -188.86%
- Current HPI
- 243.4153
- Rent YoY
- ▼ -0.61%
- Metro
- Cape Coral-Fort Myers, FL
- State GDP YoY
- ▲ 3.28%
- F500 in state
- 36
Industry mix (Fortune 500 HQ in FL)
| Industry | F500 HQs | Revenue |
|---|---|---|
| Industrial Technology | 2 | $29B |
|
||
| Insurance | 2 | $17B |
|
||
| Retail | 1 | $60B |
|
||
| Technology Distribution | 1 | $58B |
|
||
| Homebuilding | 1 | $35B |
|
||
| Technology Manufacturing | 1 | $35B |
|
||
Price history
-97.5% since first listed21 events — show timeline
- 2026-05-13 Pending — FORTMLS
- 2026-05-04 Price Changed $349,900 FORTMLS
- 2026-04-15 Price Changed $379,900 FORTMLS
- 2026-01-29 Price Changed $384,900 FORTMLS
- 2026-01-08 Listed $394,900 FORTMLS
- 2025-12-31 Listing Removed — FORTMLS
- 2025-07-08 Listed $399,900 FORTMLS
- 2025-06-30 Listing Removed — FORTMLS
- 2025-04-23 Price Changed $399,900 FORTMLS
- 2025-03-04 Price Changed $429,900 FORTMLS
- 2025-01-08 Listed $439,900 FORTMLS
- 2024-12-31 Listing Removed — FORTMLS
- 2024-11-11 Price Changed $439,900 FORTMLS
- 2024-06-06 Listed $449,900 FORTMLS
- 2022-09-26 Listing Removed — FORTMLS
- 2022-08-09 Relisted — FORTMLS
- 2022-07-31 Listing Removed — FORTMLS
- 2022-06-21 Price Changed $449,900 FORTMLS
- 2022-05-26 Listed $469,900 FORTMLS
- 2005-04-04 Sold (Public Records) $270,000 Public Records
- 2002-10-04 Sold (Public Records) $14,176,400 Public Records
Property tax history
+4.4%/yrLatest (2025): $4,259 · -0.9% YoY. Source: county tax records.
Cash-flow waterfall
monthlySold comps — $/sqft
last 12 mo · ≤1 miLoading sold comps…