 18-Plex
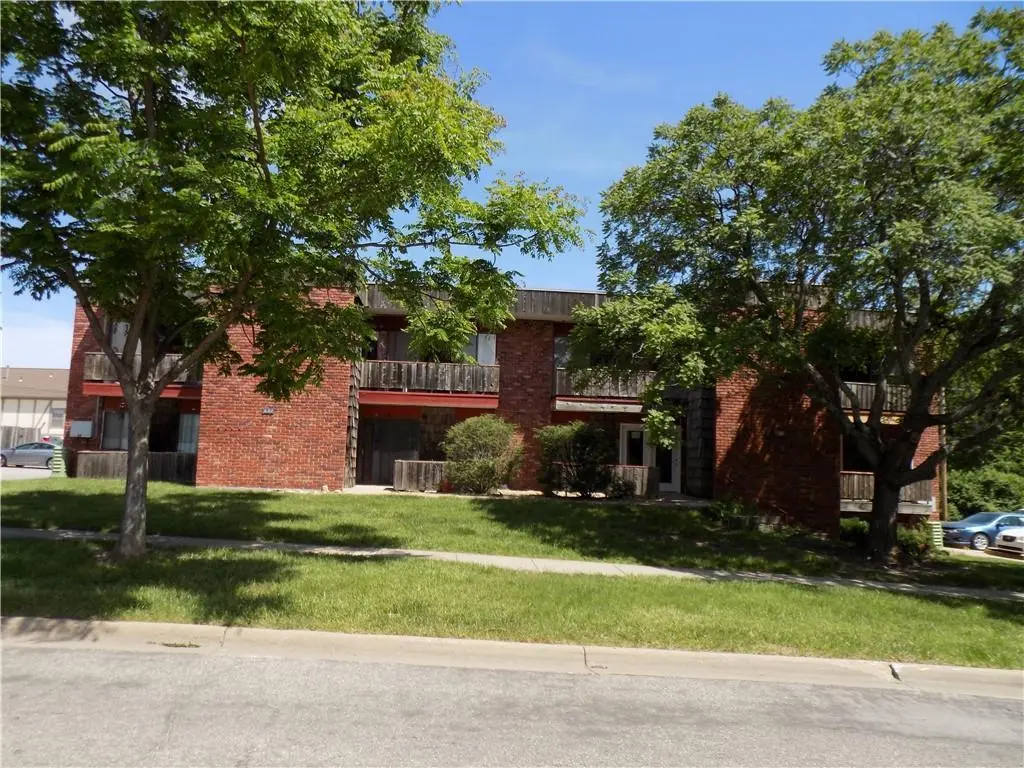
622 Schwarz Rd · Lawrence, KS
Flood risk 1/10 · Minimal
- FEMA flood zone
- X (unshaded)
- Chance of flooding over 30 yrs
- 0.0%
- Est. flood insurance / yr
- $473 – $860
Fire risk 2/10 · Minimal
- Est. fire insurance / yr
- $1,154 – $2,142
Heat risk 4/10 · Minor
- Hot days now (above 110°F)
- 7 days/yr
- Hot days in 30 yrs
- 16 days/yr
Wind risk 2/10 · Minimal
- Chance of severe wind over 30 yrs
- —
Air-quality risk 2/10 · Minimal
- Unhealthy air days now
- 1 days/yr
- Unhealthy air days in 30 yrs
- 2 days/yr
Risk factors via First Street. Map © Google.
Why this score? — see what drove the B grade
The composite is a weighted blend of 9 inputs, each scored 0–100. Each bar is that input's sub-score; the figure is the points it added to the 100-point composite (weight × sub-score).
- Cash flow +30.0/30.0
- 1% rule +10.0/10.0
- DSCR +10.0/10.0
- ARV discount +7.5/15.0
- Livability +4.4/5.0
- Rent growth +3.7/5.0
- Schools +3.2/10.0
- Condition / age +2.5/5.0
- Appreciation +0.0/10.0
$890,000
🖨 Deal sheet 📄 Offer letter ✓ Due diligence
Multi-family units
County records classify this as Multi-Family (5+ Unit). Listing-text estimate: 18 units. confirmed
5+ unit building — per-unit beds/baths from public records are typically unavailable; the breakdown below (if shown) is an estimate from the listing text.
Listing remarks
Great Investment Opportunity! 18 Unit (17 -1 Bedroom/1 Bath and 1 Studio) Apartment Complex ideally located off of 6th Street in Sunset Hills neighborhood. Close to University of Kansas and a growing area in Lawrence for high rental potential. Two story building with a total square footage of 10,143. Apartments are fully leased and under market value, has future potential for higher cash flow. Attached parking area has been resurfaced recently and building has been maintained.
Key facts
- Resurfaced recently
- Apartment complex
- Two story building
Tags
Property features AI
Finance
- Other: Property subtype: Apartment; Total units: 18; Current occupancy over 95%
- Financial info: Gross annual income reported as $99,999; Operating expenses include maintenance, insurance, property management, and real estate tax; Annual tax amount reported
- HOA & community: No association fees; Maintenance provided
Exterior
- Parking: Parking for 26 vehicles
- Utilities: Public water; Public sewer; Individual heating and air
- Home design: Residential income property (apartment); Two-story building; Zoned CS
- Construction: Brick veneer and frame construction; Tar and gravel roof; Built approximately 51–75 years ago
- Exterior features: Paved parking; Not in a flood plain; Lot recorded as 24,000 square feet (per public records)
Interior
- Bedrooms: Seventeen 1-bedroom units; One efficiency unit
- Heating & cooling: Electric heating; Natural gas heating; Electric cooling
- Interior features: Basement present; Central laundry in basement; Individual heating and air systems
- Laundry & utility: Central laundry located in the basement
Neighborhood map
What this means for you Summary
Snapshot
- This is a 18 × 1-bed/1-bath units multifamily listed at $890k.
Deal economics
- At list price, monthly cash flow is $9k ($112k/yr) — positive. Per door: $517/mo.
- The deal already cash-flows at list — no discount required.
- Meets the 1% rule at list price ($19k rent vs $890k).
- Recommended offer: $877k (1.5% below list) — sets the bar for market timing.
- Cap rate 18.8% vs local median 2.7% in Lawrence — top-decile yield for the area; either an underpriced asset or a hidden risk that comps aren't pricing in. Stress-test before assuming the spread holds.
Location & tenants
- Location reads 88/100 on livability (#1 in KS, #237 nationally) — a professional / high-income tenant draw. Strengths: amenities A+, commute A+, cost of living A+; Watch: crime D-.
- Lawrence (urban): math 31% / reading 44% proficiency, ranked #46 of 169 in KS (top 27%) — families likely to look elsewhere, expect single-tenant / working-renter base with shorter leases.
- Market conditions: Rents rising fast (+4.6%/yr); 136 active listings in the ZIP; solid renter incomes; 246 units permitted in Douglas County in 2024 (38 in 5+ unit buildings).
- At $19,405/mo this rent would consume 258% of the median local household income ($90k/yr) (locally 1866% of renters already pay >50% of income on rent) — very limited rent-growth headroom before tenants either downsize or default.
Forward outlook
- Local home prices are declining (-3.0%/yr); year-one equity from $6k of loan paydown is wiped out by about $27k of value loss. Plan a longer hold.
- Douglas County population projected at +39% by 2050 — long-run rental-demand tailwind backs the buy-and-hold thesis.
- At projected returns (-3.0% appreciation + 4.6% rent growth), your $249k cash investment doubles in ~3 years — after that, you're playing with house money.
Negotiation context
- It's been on market 16 days — a 2% lower offer ($877k) is reasonable based on typical stale-listing flexibility.
Questions for the listing agent
- Can we see the unit-by-unit rent roll, current vacancy, and any below-market leases? What's the average tenancy length?
- What capital expenditures (roof, boiler, parking lot, exteriors) have been made in the last 5 years, and what's planned in the next 2?
- Built in 1963 — when were the roof, HVAC, electrical panel, plumbing, and water heater last replaced?
- Is there a deadline driving the sale (1031 exchange, divorce, estate, relocation)? That informs how much negotiation room exists.
- Crime grade is D in this area — have there been break-ins, vandalism, or insurance claims at this property in the last 3 years? What carrier currently insures it and at what premium?
- What's the average days-on-market for RENTAL listings here right now (not sales)? A rising rental-DOM trend means longer vacancies and softer asking-rent achievability than the comps imply.
- What's the recent tenant-quality profile in this submarket — average credit score on applications, eviction rate, late-payment / NSF rate, and stable-employment percentage? A property-management company in the area should have these aggregated.
- How much new apartment / multifamily construction is in the pipeline within 1–3 miles? Heavy new supply (>2% of stock underway) typically softens rents 12–24 months out; light construction supports rent growth.
Investment metrics
- 1% rule
- 2.18% ✓
- Cap rate
- 18.83%
- Cash-on-cash
- 44.79%
- DSCR
- 2.99
- GRM
- 3.8
CMA / ARV
No comps found within radius.
Projected returns pro-forma
-3.0% appreciation · 4.64% rent growth · sell at horizon
- IRR
- 43.7%
- Equity multiple
- 2.93×
- Total profit
- $480,945
- Equity at exit
- $132,702
- IRR
- 50.4%
- Equity multiple
- 6.30×
- Total profit
- $1,320,584
- Equity at exit
- $76,951
Cash invested: $249,200 (down + closing). Projections, not guarantees.
Landlord ↔ Tenant lean methodology
- Overall (STATE)
- 83 Strongly Landlord-Friendly
- State Kansas
- 83 Strongly Landlord-Friendly · R+10
- County
- — inherits STATE
- City
- — inherits STATE
ZIP-level market 66049
- Rents YoY
- 4.6%
- Active inventory
- 136
- Price-to-rent
- 68.8×
Monthly cashflow live
- Estimated rent
- $19,405 high interval (Pro) →
- Mortgage (P&I)
- −$4,667
- Tax from tax record
- −$991 /mo · $11,887/yr
- Insurance
- −$371
- HOA
- −$0
- Vacancy / Maint / Mgmt
- −$4,075
- Net cashflow
- $9,301
Break-even live
18-unit breakdown (identical units grouped — click to expand)
| Units | Beds | Baths | Est. rent |
|---|---|---|---|
| 18× units | 1 | 1 | $19,404 |
| #1 | 1 | 1 | $1,078 |
| #2 | 1 | 1 | $1,078 |
| #3 | 1 | 1 | $1,078 |
| #4 | 1 | 1 | $1,078 |
| #5 | 1 | 1 | $1,078 |
| #6 | 1 | 1 | $1,078 |
| #7 | 1 | 1 | $1,078 |
| #8 | 1 | 1 | $1,078 |
| #9 | 1 | 1 | $1,078 |
| #10 | 1 | 1 | $1,078 |
| #11 | 1 | 1 | $1,078 |
| #12 | 1 | 1 | $1,078 |
| #13 | 1 | 1 | $1,078 |
| #14 | 1 | 1 | $1,078 |
| #15 | 1 | 1 | $1,078 |
| #16 | 1 | 1 | $1,078 |
| #17 | 1 | 1 | $1,078 |
| #18 | 1 | 1 | $1,078 |
| Total (18 units) | $19,405 | ||
UW: 25.0% down · 7.5% · 30yr · 1.5% tax · 5.0% vac · 8.0% maint · 8.0% mgmt
Financing live
Cash to close
- Down payment
- $222,500
- Closing costs
- $26,700
- Reserves months
- —
- Total cash needed
- —
Loan-product check · same deal, 3 products live
Conventional
25% down · 7.5% · 30yr
- Down + closing
- —
- Monthly P&I
- —
- Monthly cashflow
- —
- DSCR
- —
- Eligible?
- —
Personal DTI + credit; lowest rate.
DSCR
20% down · 8.5% · 30yr
- Down + closing
- —
- Monthly P&I
- —
- Monthly cashflow
- —
- DSCR
- —
- Eligible?
- —
No personal income docs; deal must DSCR.
Hard money
10% down · 12.0% · 12mo
- Down + closing
- —
- Monthly P&I
- —
- Monthly cashflow
- —
- DSCR
- —
- Eligible?
- —
Short-term bridge; refi at stabilization.
Listing history 2 events
-
2026-05-08$890,000 Active
-
1977-01-12soldstatus
ⓘ Source: listings_history table (triggers on properties + properties_extension) + one-shot
backfill from property_details.listing_events for pre-trigger history.
Tax reassessment forecast KS · Resets to sale price
- Current annual tax
- $11,887 · $991/mo
- Projected year-2 tax
- $12,549 · $1,046/mo
- Expected delta
- +$662/yr (+$55/mo · 5.6%)
ⓘ Screening estimate from a state-policy table — verify with the county assessor before closing.
Climate risk First Street
- Flood 1/10 Low FEMA zone X (unshaded) · 0% chance over 30 yrs
- Wildfire 2/10 Low
- Heat 4/10 Moderate 7 d/yr ≥110°F today · 16 d/yr by 30 yrs out
- Wind 2/10 Low
- Air quality 2/10 Low 1 unhealthy d/yr today · 2 by 30 yrs out
Nearby sold comps map
Loading sold comps map…
Walkable amenities ~0.75 mi
Loading nearby amenities…
Taxation est. · year 1
- Rental income
- $232,860
- − Mortgage interest
- −$49,854
- − Property taxes
- −$11,887
- − Insurance
- −$4,450
- − Repairs & maintenance
- −$18,629
- − Management
- −$18,629
- − Depreciation
- −$25,891
- Taxable income
- $103,521
- Est. tax owed @ 24.0%
- −$24,845
- After-tax cash flow
- $86,770/yr
For passive investors: Depreciation is non-cash, so a rental often shows a tax loss while cash-flowing — sheltering income. Rental losses are passive: they offset passive income freely, and up to $25,000/yr can offset ordinary (W-2) income if you actively participate and your MAGI is under $100k (phasing out to $0 by $150k); unused losses carry forward. On sale, claimed depreciation is recaptured at up to 25%, and gains may owe capital-gains tax (a 1031 exchange can defer both). Figures are a year-1 estimate at your 24.0% rate — not tax advice; consult a CPA.
Schools (NCES district)
- District
- Lawrence
- NCES district ID
- 2008400
- Math proficiency
- 31% ▼ -7.00%
- Reading proficiency
- 44% ▬ 0.00%
- Median HH income
- $46,259
- Composite
- 32.02/100
- National rank
- #5826
- State rank
- #46 of 169 in KS
Livability — Lawrence
- Score
- 88/100
- State rank
- #1
- US rank
- #237
Category grades
Schools grade is shown separately in the Schools card above.
Census & demographics
- Census place
- Lawrence, KS
- County
- Douglas County · 100,966 people
- City population
- 100,966
- Metro
- Lawrence, KS
- Population (ZIP)
- 32,015
- Household income
- $90,147
- Rent vs Own
- Severe rent burden
- 1866.0
Population outlook (Douglas County) Hauer SSP2
- Today (2025)
- 136,863 people
- By 2030
- 147,255 · +7.6%
- By 2040
- 167,760 · +22.6%
- By 2050
- 190,593 · +39.3%
- By 2075
- 253,850 · +85.5%
- By 2100
- 314,741 · +130.0%
Race, ethnicity, and origin ACS 2023
- Neighborhood character
- Predominantly White (77%)
- Race & ethnicity
- White 77% Two or more races 9% Asian 5% Black 4% Hispanic / Latino 4%
- Common ancestry
- Slovak 3% Italian 3% Lithuanian 2%
- Foreign-born
- 7% · China, Canada, Vietnam
- Languages at home
- 90% English-only · Chinese 2% Other Asian/Pacific 2% Arabic 2%
Political lean MEDSL · Douglas
- 2024 margin
- Solid D (+38.0) · D 68.2% · R 30.2% · Other 1.6%
- 2008→2024 swing
- +7.2pp toward D · 2008: 30.8pp · 2024: 38.0pp
- All cycles
- 2024: D+38.0 2020: D+39.5 2016: D+32.7 2012: D+23.7 2008: D+30.8
Not yet ingested
- Civics
- —
Market trends
- HPI YoY
- ▼ -189.19%
- Current HPI
- 221.5047
- Rent YoY
- ▲ 4.64%
- Metro
- Lawrence, KS
- State GDP YoY
- —
- F500 in state
- 0
Price history
2 events — show timeline
- 2026-05-08 Listed $890,000 Heartland MLS as Distributed by MLS Grid
- 1977-01-12 Sold (Public Records) — Public Records
Property tax history
+5.7%/yrLatest (2025): $11,887 · +22.4% YoY. Source: county tax records.
Cash-flow waterfall
monthlySold comps — $/sqft
last 12 mo · ≤1 miLoading sold comps…