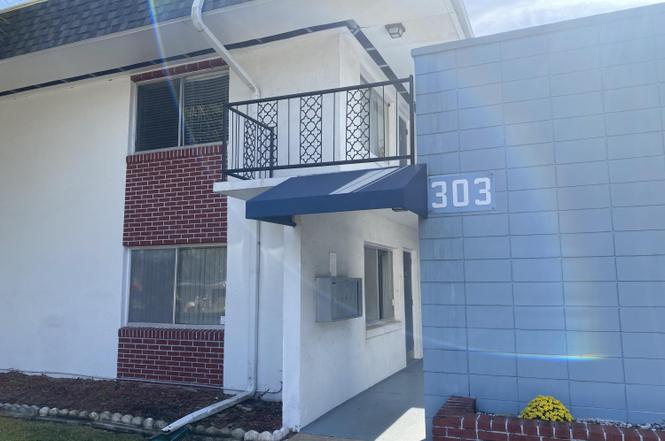
303 Ridge Blvd #1060 · South Daytona, FL
Flood risk 7/10 · Major
- FEMA flood zone
- X (unshaded)
- Chance of flooding over 30 yrs
- 0.97%
- Est. flood insurance / yr
- $507 – $1,088
Fire risk 1/10 · Minimal
- Est. fire insurance / yr
- $947 – $1,759
Heat risk 10/10 · Severe
- Hot days now (above 105°F)
- 7 days/yr
- Hot days in 30 yrs
- 21 days/yr
Wind risk 10/10 · Severe
- Chance of severe wind over 30 yrs
- 99.0%
Air-quality risk 2/10 · Minimal
- Unhealthy air days now
- 2 days/yr
- Unhealthy air days in 30 yrs
- 2 days/yr
Risk factors via First Street. Map © Google.
Why this score? — see what drove the B- grade
The composite is a weighted blend of 9 inputs, each scored 0–100. Each bar is that input's sub-score; the figure is the points it added to the 100-point composite (weight × sub-score).
- Cash flow +26.2/30.0
- 1% rule +10.0/10.0
- DSCR +8.9/10.0
- ARV discount +7.5/15.0
- Livability +4.0/5.0
- Schools +3.9/10.0
- Condition / age +2.5/5.0
- Rent growth +2.0/5.0
- Appreciation +0.0/10.0
$79,900
🖨 Deal sheet (PDF) 📄 Offer letter ✓ Due diligence
Listing remarks
MOTIVATED SELLER - NEWLY UPDATED - Well Maintained 2-bedroom, 1-bath first-floor condo featuring brand-new flooring in the living and dining areas. Also Freshly painted with updated kitchen. This conveniently located home offers easy access to shopping, restaurants, beaches, and hospitals--perfect for comfortable everyday living or a low-maintenance investment property. Enjoy a functional layout, abundant natural light, and a prime location close to everything you need. All information is deemed accurate but must be verified by buyer and buyers agent
Key facts
- Brand-new flooring
- Updated kitchen
- Functional layout
Tags
Property features AI
Finance
- Other: Pets allowed with breed, number, and size restrictions; Subdivision: Sun Place Condo
- Financial info: Tax amount listed (not included per instructions)
- HOA & community: Homeowners association with monthly fee of $420; HOA covers insurance, grounds maintenance, structure maintenance, pest control, sewer, trash, and water
Exterior
- Parking: Detached carport (1 space)
- Security: No security features listed
- Utilities: Public water; Public sewer; Electricity connected; Water connected; Sewer connected; Cable available and connected
- Home design: Residential condominium; 2 stories; Current use: Residential
- Construction: Block construction; Slab foundation
- Exterior features: Public maintained road; City street frontage
Interior
- Kitchen: Refrigerator; Electric range
- Bedrooms: Total rooms: 3
- Flooring: Carpet; Vinyl
- Bathrooms: 1 full bathroom
- Heating & cooling: Central heating; Central air; Ceiling fan(s)
- Interior features: Ceiling fans
- Laundry & utility: Washer/dryer info not provided
Neighborhood map
What this means for you Summary
Snapshot
- This is a 2-bed/1.0-bath condo listed at $80k.
Deal economics
- At list price, monthly cash flow is $138 ($2k/yr) — positive.
- The deal already cash-flows at list — no discount required.
- Meets the 1% rule at list price ($1k rent vs $80k).
- Recommended offer: $70k (12.0% below list) — sets the bar for market timing.
Location & tenants
- Location reads 80/100 on livability (#114 in FL, #1,755 nationally) — a professional / high-income tenant draw. Strengths: amenities A+, cost of living A+, housing A+; Watch: schools D, employment D, commute F.
- Volusia (suburban): math 44% / reading 49% proficiency, ranked #47 of 73 in FL (top 64%) — families likely to look elsewhere, expect single-tenant / working-renter base with shorter leases.
- Market conditions: Rents soft (-2.0%/yr); 280 active listings in the ZIP; 32 comparable units currently listed for rent nearby; rentals at typical pace (median 24d on market — plan ~3-4 weeks tenant-placement turnaround); 3,402 units permitted in Volusia County in 2024 (681 in 5+ unit buildings).
- This rent runs 31% of the median local income ($57k/yr) — at the standard rent-burdened threshold; future hikes will face affordability resistance.
Forward outlook
- Local home prices are declining (-3.0%/yr); year-one equity from $552 of loan paydown is wiped out by about $2k of value loss. Plan a longer hold.
- Volusia County population projected at +19% by 2050 — long-run rental-demand tailwind backs the buy-and-hold thesis.
Negotiation context
- It's been on market 190 days — a 12% lower offer ($70k) is reasonable based on typical stale-listing flexibility.
- 2 sale attempts; this cycle's ask has dropped $5k (6%) from the opening price — seller is motivated, your offer sets the floor, not the list.
Risks & watch-outs
- Watch-outs: flood insurance adds $66/mo; HOA is 28% of rent.
- Climate carrying-cost: major flood risk; severe wind risk, 99% chance of damaging wind over 30y; extreme-heat days projected 7→21/yr by 2055 (HVAC capex compounding) — expect insurance premiums to compound above CPI over the hold.
Questions for the listing agent
- It's been on market 190 days. Have you received any prior offers? Is the seller open to a 12% concession, seller financing, or rate buy-down credit?
- Built in 1971 — when were the roof, HVAC, electrical panel, plumbing, and water heater last replaced?
- What's the actual annual flood-insurance premium (NFIP or private), and is the property in a SFHA with mandatory coverage?
- What does the HOA fee cover, when was the last increase, and are there any pending special assessments or reserve-fund shortfalls?
- Any open or pending special assessments — roof, HVAC, plumbing, elevator, façade? What's the per-unit balance and payoff schedule, and is the seller paying it off at close or rolling it to the buyer?
- Why hasn't it sold? Are there any deal-killer items the seller is aware of (foundation, flood, title, zoning, code violations)?
- Is there a deadline driving the sale (1031 exchange, divorce, estate, relocation)? That informs how much negotiation room exists.
- Schools are D-rated, which usually means shorter tenancies and higher turnover. Who's the typical renter profile here, and what's been the actual vacancy rate?
- What's the average days-on-market for RENTAL listings here right now (not sales)? A rising rental-DOM trend means longer vacancies and softer asking-rent achievability than the comps imply.
- What's the recent tenant-quality profile in this submarket — average credit score on applications, eviction rate, late-payment / NSF rate, and stable-employment percentage? A property-management company in the area should have these aggregated.
- How much new apartment / multifamily construction is in the pipeline within 1–3 miles? Heavy new supply (>2% of stock underway) typically softens rents 12–24 months out; light construction supports rent growth.
Investment metrics
- 1% rule
- 1.86% ✓
- Cap rate
- 9.36%
- Cash-on-cash
- 10.96%
- DSCR
- 1.49
- GRM
- 4.5
CMA / ARV
No comps found within radius.
Projected returns pro-forma
-3.0% appreciation · 0.0% rent growth · sell at horizon
- IRR
- -10.6%
- Equity multiple
- 0.63×
- Total profit
- $-8,213
- Equity at exit
- $11,913
- IRR
- -11.1%
- Equity multiple
- 0.49×
- Total profit
- $-11,411
- Equity at exit
- $6,908
Cash invested: $22,372 (down + closing). Projections, not guarantees.
Landlord ↔ Tenant lean methodology
- Overall (STATE)
- 87 Strongly Landlord-Friendly
- State Florida
- 87 Strongly Landlord-Friendly · R+3
- County
- — inherits STATE
- City
- — inherits STATE
ZIP-level market 32119
- Rents YoY
- -2.0%
- Active inventory
- 280
- Price-to-rent
- 4.5×
Monthly cashflow live
- Estimated rent
- $1,489 high interval (Pro) →
- Mortgage (P&I)
- −$419
- Tax est. 1.5%
- −$100 /mo · $1,198/yr
- Insurance
- −$33
- Flood insurance flood zone
- −$66 /mo · $798/yr
- HOA
- −$420
- Vacancy / Maint / Mgmt
- −$313
- Net cashflow
- $138
Break-even live
Sensitivity live
| Price | -10% $193 | -5% $165 | +0% $138 | +5% $110 | +10% $83 |
|---|---|---|---|---|---|
| Rent | -10% $20 | -5% $79 | +0% $138 | +5% $197 | +10% $255 |
| Rate | -1.0pp $178 | -0.5pp $158 | base $138 | +0.5pp $117 | +1.0pp $96 |
UW: 25.0% down · 7.5% · 30yr · 1.5% tax · 5.0% vac · 8.0% maint · 8.0% mgmt
Financing live
Cash to close
- Down payment
- $19,975
- Closing costs
- $2,397
- Reserves months
- —
- Total cash needed
- —
Loan-product check · same deal, 3 products live
Conventional
25% down · 7.5% · 30yr
- Down + closing
- —
- Monthly P&I
- —
- Monthly cashflow
- —
- DSCR
- —
- Eligible?
- —
Personal DTI + credit; lowest rate.
DSCR
20% down · 8.5% · 30yr
- Down + closing
- —
- Monthly P&I
- —
- Monthly cashflow
- —
- DSCR
- —
- Eligible?
- —
No personal income docs; deal must DSCR.
Hard money
10% down · 12.0% · 12mo
- Down + closing
- —
- Monthly P&I
- —
- Monthly cashflow
- —
- DSCR
- —
- Eligible?
- —
Short-term bridge; refi at stabilization.
Rent comps 32 comps
| Address | Beds | Baths | Sqft | Rent | $/sqft | DOM | Units | Dist |
|---|---|---|---|---|---|---|---|---|
| 301 Ridge Blvd #1020 South Daytona, FL | 2.0 | 1.0 | 810 | $1,375 | $1.70 | 24d | 1 | 0.02mi |
| 2275 Granada Dr Unit 1 South Daytona, FL | 2.0 | 2.0 | 1000 | $1,600 | $1.60 | 24d | 1 | 0.08mi |
| 2140 S Palmetto Ave South Daytona, FL | 2.0 | 1.5 | 1100 | $1,499 | $1.36 | 24d | 1 | 0.34mi |
| 2050 S Ridgewood Ave South Daytona, FL | 1.0–2.0 | 1.0–1.5 | 818 | $1,450 | $1.77 | 24d | 1 | 0.34mi |
| 580 Reed Canal Rd South Daytona, FL | 1.0 | 1.0 | 718 | $1,272 | $1.77 | 15d | 2 | 0.49mi |
| 2002 S Palmetto Ave Unit B South Daytona, FL | 1.0 | 1.0 | 625 | $975 | $1.56 | 15d | 1 | 0.52mi |
| 480 Reed Canal Rd #57 South Daytona, FL | 2.0 | 1.5 | 1024 | $1,550 | $1.51 | 24d | 1 | 0.57mi |
| 1910 S Palmetto Ave South Daytona, FL | 1.0 | 1.0 | 750 | $1,195 | $1.59 | 24d | 1 | 0.65mi |
| 535 Olive St South Daytona, FL | 2.0 | 1.0 | 1024 | $1,725 | $1.68 | 11d | 1 | 0.69mi |
| 201 Kost Rd South Daytona, FL | 2.0 | 1.0 | 850 | $1,149 | $1.35 | 11d | 2 | 0.69mi |
| 205 Kost Rd South Daytona, FL | 2.0 | 1.0 | 850 | $1,500 | $1.76 | 24d | 1 | 0.69mi |
| 1888 S Palmetto Ave South Daytona, FL | 2.0 | 1.0 | 850 | $1,199 | $1.41 | 24d | 1 | 0.72mi |
| 1830 S Palmetto Ave Unit 4 South Daytona, FL | 2.0 | 1.0 | 900 | $1,450 | $1.61 | 24d | 1 | 0.78mi |
| 1739 Eastern Rd South Daytona, FL | 1.0 | 1.0 | 800 | $1,099 | $1.37 | 15d | 1 | 0.98mi |
| 1620 S Palmetto Ave South Daytona, FL | 1.0 | 1.0 | 750 | $1,195 | $1.59 | 24d | 1 | 1.13mi |
| 1620 S Palmetto Ave Unit 206 South Daytona, FL | 2.0 | 1.0 | 850 | $1,295 | $1.52 | 21d | 1 | 1.13mi |
| 3131 S Ridgewood Ave #203 South Daytona, FL | 2.0 | 2.0 | 1013 | $1,795 | $1.77 | 15d | 1 | 1.15mi |
| 900 Boulder Dr South Daytona, FL | 2.0 | 1.0 | 939 | $1,850 | $1.97 | 24d | 1 | 1.16mi |
| 3230 S Ridgewood Ave South Daytona, FL | 1.0–3.0 | 1.0–2.0 | 1046 | $1,881 | $1.80 | 11d | 27 | 1.21mi |
| 700 Northern Rd Unit 728 South Daytona, FL | 1.0 | 1.0 | 774 | $1,240 | $1.60 | 24d | 1 | 1.26mi |
| 1504 Virginia Ave Daytona Beach, FL | 1.0–2.0 | 1.0–2.0 | 842 | $1,650 | $1.96 | 24d | 3 | 1.36mi |
| 2987 S Atlantic Ave #205 Daytona Beach Shores, FL | 2.0 | 2.0 | 1028 | $2,600 | $2.53 | 24d | 1 | 1.37mi |
| 3023 S Atlantic Ave Unit 1531031P Daytona Beach Shores, FL | 2.0 | 2.0 | 1097 | $4,430 | $4.04 | 15d | 1 | 1.40mi |
| 1500 Virginia Ave Daytona Beach, FL | 2.0 | 2.0 | 910 | $1,475 | $1.62 | 24d | 1 | 1.40mi |
| 3013 S Atlantic Ave Unit 907 Daytona Beach, FL | 2.0 | 2.0 | 1088 | $2,800 | $2.57 | 24d | 1 | 1.41mi |
| 3043 S Atlantic Ave #1901 Daytona Beach Shores, FL | 2.0 | 2.0 | 1062 | $2,450 | $2.31 | 24d | 1 | 1.43mi |
| 3043 S Atlantic Ave Apt 1602 Daytona Beach Shores, FL | 2.0 | 2.0 | 1028 | $2,550 | $2.48 | 24d | 1 | 1.43mi |
| 1350 Virginia Ave Apt 17 Daytona Beach, FL | 2.0 | 2.0 | 950 | $1,399 | $1.47 | 24d | 1 | 1.46mi |
| 3051 S Atlantic Ave #505 Daytona Beach, FL | 2.0 | 2.0 | 1058 | $2,450 | $2.32 | 11d | 1 | 1.47mi |
| 1401 S Palmetto Ave Daytona Beach, FL | 1.0–2.0 | 1.0–2.0 | 890 | $1,800 | $2.02 | 24d | 3 | 1.47mi |
| 3051 S Atlantic Ave Unit 1 Daytona Beach Shores, FL | 2.0 | 2.0 | 1072 | $2,500 | $2.33 | 24d | 1 | 1.47mi |
| 1351 S Ridgewood Ave #26 Daytona Beach, FL | 2.0 | 1.5 | 988 | $1,285 | $1.30 | 15d | 1 | 1.50mi |
HOA detail condo
- Monthly dues
- $420 · $5,040/yr
- Assessments
- None detected in remarks — confirm with the listing agent.
Listing history 18 events
-
2026-06-18status $79,900 Pending 190 DOM
-
2026-06-18days on market $79,900 Active 190 DOM
-
2026-06-17days on market $79,900 Active 189 DOM
-
2026-06-16days on market $79,900 Active 188 DOM
-
2026-06-15days on market $79,900 Active 187 DOM
-
2026-06-14days on market $79,900 Active 185 DOM
-
2026-06-10days on market $79,900 Active 182 DOM
-
2026-06-09days on market $79,900 Active 181 DOM
-
2026-06-08statusdays on market $79,900 Active 180 DOM
-
2026-05-31status $79,900 Pending 179 DOM
-
2026-05-23status Active
-
2026-05-12historical
-
2026-05-12price $79,900
-
2026-03-04price $78,000
-
2026-02-16price $79,000
-
2025-11-19$84,900 Active
-
2006-07-12soldstatus $120,500
-
1920-09-01soldstatus $35,900
ⓘ Source: listings_history table (triggers on properties + properties_extension) + one-shot
backfill from property_details.listing_events for pre-trigger history.
Climate risk First Street
- Flood 7/10 Severe FEMA zone X (unshaded) · 97% chance over 30 yrs
- Wildfire 1/10 Low
- Heat 10/10 Extreme 7 d/yr ≥105°F today · 21 d/yr by 30 yrs out
- Wind 10/10 Extreme 99% chance of damaging wind over 30 yrs
- Air quality 2/10 Low 2 unhealthy d/yr today · 2 by 30 yrs out
Nearby sold comps map
Loading sold comps map…
Walkable amenities ~0.75 mi
Loading nearby amenities…
Taxation est. · year 1
- Rental income
- $17,870
- − Mortgage interest
- −$4,476
- − Property taxes
- −$1,198
- − Insurance
- −$1,197
- − Repairs & maintenance
- −$1,430
- − Management
- −$1,430
- − HOA
- −$5,040
- − Depreciation
- −$2,324
- Taxable income
- $775
- Est. tax owed @ 24.0%
- −$186
- After-tax cash flow
- $1,468/yr
For passive investors: Depreciation is non-cash, so a rental often shows a tax loss while cash-flowing — sheltering income. Rental losses are passive: they offset passive income freely, and up to $25,000/yr can offset ordinary (W-2) income if you actively participate and your MAGI is under $100k (phasing out to $0 by $150k); unused losses carry forward. On sale, claimed depreciation is recaptured at up to 25%, and gains may owe capital-gains tax (a 1031 exchange can defer both). Figures are a year-1 estimate at your 24.0% rate — not tax advice; consult a CPA.
Schools (NCES district)
- District
- Volusia
- NCES district ID
- 1201920
- Math proficiency
- 44% ▼ -9.00%
- Reading proficiency
- 49% ▼ -3.00%
- Median HH income
- $42,946
- Composite
- 39.2/100
- National rank
- #4019
- State rank
- #47 of 73 in FL
Livability — South Daytona
- Score
- 80/100
- State rank
- #114
- US rank
- #1755
Category grades
Schools grade is shown separately in the Schools card above.
Census & demographics
- Census place
- South Daytona, FL
- County
- Volusia County · 556,871 people
- City population
- 22,348
- Metro
- Deltona-Daytona Beach-Ormond Beach, FL
- Population (ZIP)
- 22,348
- Household income
- $56,862
- Rent vs Own
- Severe rent burden
- 1158.0
Population outlook (Volusia County) Hauer SSP2
- Today (2025)
- 572,749 people
- By 2030
- 598,695 · +4.5%
- By 2040
- 644,880 · +12.6%
- By 2050
- 681,451 · +19.0%
- By 2075
- 759,957 · +32.7%
- By 2100
- 778,902 · +36.0%
Race, ethnicity, and origin ACS 2023
- Neighborhood character
- Predominantly White (75%)
- Race & ethnicity
- White 75% Black 10% Hispanic / Latino 9% Two or more races 5% Asian 2%
- Hispanic origin (detail)
- Puerto Rican 4%
- Common ancestry
- Lithuanian 2% Slovak 2% Romanian 2%
- Foreign-born
- 9% · Canada, South Korea, Jamaica
- Languages at home
- 87% English-only · Spanish 7% Other Indo-European 2% German/W. Germanic 1%
Political lean MEDSL · Volusia
- 2024 margin
- Strong R (+21.8) · D 38.7% · R 60.5%
- 2008→2024 swing
- -27.4pp toward R · 2008: 5.7pp · 2024: -21.8pp
- All cycles
- 2024: R+21.8 2020: R+14.1 2016: R+13.1 2012: R+1.2 2008: D+5.7
Not yet ingested
- Civics
- —
Market trends
- HPI YoY
- ▼ -247.99%
- Current HPI
- 309.304
- Rent YoY
- ▼ -2.01%
- Metro
- Deltona-Daytona Beach-Ormond Beach, FL
- State GDP YoY
- ▲ 3.28%
- F500 in state
- 36
Industry mix (Fortune 500 HQ in FL)
| Industry | F500 HQs | Revenue |
|---|---|---|
| Industrial Technology | 2 | $29B |
|
||
| Insurance | 2 | $17B |
|
||
| Retail | 1 | $60B |
|
||
| Technology Distribution | 1 | $58B |
|
||
| Homebuilding | 1 | $35B |
|
||
| Technology Manufacturing | 1 | $35B |
|
||
Price history
+122.6% since first listed8 events — show timeline
- 2026-05-23 Relisted — Daytona MLS
- 2026-05-12 Price Changed $79,900 Daytona MLS
- 2026-05-12 Listing Removed — Daytona MLS
- 2026-03-04 Price Changed $78,000 Daytona MLS
- 2026-02-16 Price Changed $79,000 Daytona MLS
- 2025-11-19 Listed $84,900 Daytona MLS
- 2006-07-12 Sold (Public Records) $120,500 Public Records
- 1920-09-01 Sold (Public Records) $35,900 Public Records
Property tax history
+3.1%/yrLatest (2025): $115 · +20.6% YoY. Source: county tax records.
Cash-flow waterfall
monthlySold comps — $/sqft
last 12 mo · ≤1 miLoading sold comps…