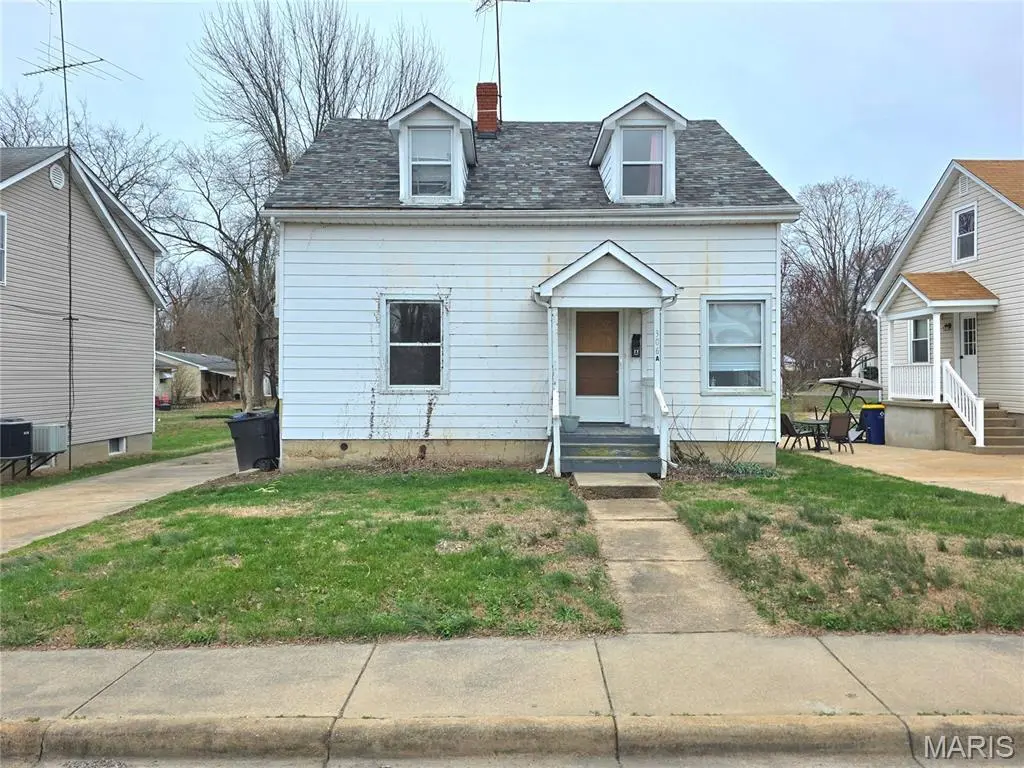
306 W 8th St · Washington, MO
Flood risk 1/10 · Minimal
- FEMA flood zone
- X (unshaded)
- Chance of flooding over 30 yrs
- 0.0%
- Est. flood insurance / yr
- $507 – $1,088
Fire risk 2/10 · Minimal
- Est. fire insurance / yr
- $1,054 – $1,958
Heat risk 5/10 · Moderate
- Hot days now (above 108°F)
- 7 days/yr
- Hot days in 30 yrs
- 20 days/yr
Wind risk 2/10 · Minimal
- Chance of severe wind over 30 yrs
- 1.0%
Air-quality risk 1/10 · Minimal
- Unhealthy air days now
- 0 days/yr
- Unhealthy air days in 30 yrs
- 0 days/yr
Risk factors via First Street. Map © Google.
Why this score? — see what drove the D grade
The composite is a weighted blend of 9 inputs, each scored 0–100. Each bar is that input's sub-score; the figure is the points it added to the 100-point composite (weight × sub-score).
- Cash flow +14.1/30.0
- ARV discount +8.0/15.0
- DSCR +4.3/10.0
- Schools +4.2/10.0
- Livability +4.0/5.0
- 1% rule +3.0/10.0
- Rent growth +2.5/5.0
- Condition / age +2.5/5.0
- Appreciation +0.0/10.0
$219,000
🖨 Deal sheet (PDF) 📄 Offer letter ✓ Due diligence
Listing remarks MLS
Welcome to this 4-bedroom, 2-bath home offering 1,571 sq ft of versatile living space. Currently used as a 2-family rental, this could easily be used as a single family residence. Each level houses 2 bedrooms and full bath as well as an eat-in kitchen. The upper level also features a family room and main level a spacious living room. Outside you'll find a 2-car detached garage and nice level lot. Set your appointment Today! More pictures coming.
Key facts
- 6,490 sq ft lot
- 2 garage spots
- Built 1950
Neighborhood map
What this means for you Summary
Snapshot
- This is a 4-bed/1.0-bath single-family listed at $219k.
Deal economics
- At list price, monthly cash flow is $31 ($373/yr) — positive.
- The deal already cash-flows at list — no discount required.
- To meet the 1% rule (rent ≥ 1% of price), the offer needs to be $175k (20.0% below list).
- Recommended offer: $175k (20.0% below list) — sets the bar for 1% rule.
- Cap rate 6.5% vs local median 2.4% in Washington — top-decile yield for the area; either an underpriced asset or a hidden risk that comps aren't pricing in. Stress-test before assuming the spread holds.
Location & tenants
- Location reads 81/100 on livability (#13 in MO, #1,373 nationally) — a professional / high-income tenant draw. Strengths: amenities A+, cost of living A+, housing A+; Watch: commute F.
- Washington (town): math 41% / reading 55% proficiency, ranked #46 of 324 in MO (top 14%) — families likely to look elsewhere, expect single-tenant / working-renter base with shorter leases.
- Zoned schools: Washington Middle (math 43% / reading 54%, grade C-, #81 of 391 statewide, top 21%, 551 students, 31% FRL) — zoned schools at 31% FRL track the district average.
- Market conditions: 203 active listings in the ZIP; 4 comparable units currently listed for rent nearby; rentals leasing fast (median 13d on market — plan ~1-2 weeks tenant-placement turnaround); 614 units permitted in Franklin County in 2024 (100 in 5+ unit buildings).
Forward outlook
- Local home prices are declining (-3.0%/yr); year-one equity from $2k of loan paydown is wiped out by about $7k of value loss. Plan a longer hold.
- Franklin County population projected to shrink 9% by 2050 — rents likely to lag national; underwrite the cash flow, not the appreciation.
Negotiation context
- It's been on market 82 days — a 6% lower offer ($206k) is reasonable based on typical stale-listing flexibility.
- 2 sale attempts with the ask held roughly flat each time — persistent listings suggest the price (not the market) is what's stuck; bring a comps-based counter.
Risks & watch-outs
- Watch-outs: built in 1950 — expect roof / HVAC / electrical / plumbing capex.
- Climate carrying-cost: extreme-heat days projected 7→20/yr by 2055 (HVAC capex compounding) — expect insurance premiums to compound above CPI over the hold.
Questions for the listing agent
- It's been on market 82 days. Have you received any prior offers? Is the seller open to a 20% concession, seller financing, or rate buy-down credit?
- Built in 1950 — when were the roof, HVAC, electrical panel, plumbing, and water heater last replaced?
- Why hasn't it sold? Are there any deal-killer items the seller is aware of (foundation, flood, title, zoning, code violations)?
- Is there a deadline driving the sale (1031 exchange, divorce, estate, relocation)? That informs how much negotiation room exists.
- Schools are B-rated — typically a magnet for longer-tenancy family renters. What's the average tenant stay here, and is there a school-zone premium baked into asking?
- The area grade is low — what's the realistic commute time and amenity access for the typical tenant pool here? Any planned neighborhood developments (good or bad) we should know about?
- What's the average days-on-market for RENTAL listings here right now (not sales)? A rising rental-DOM trend means longer vacancies and softer asking-rent achievability than the comps imply.
- What's the recent tenant-quality profile in this submarket — average credit score on applications, eviction rate, late-payment / NSF rate, and stable-employment percentage? A property-management company in the area should have these aggregated.
- How much new for-sale + rental construction is in the pipeline within 1–3 miles? Heavy new supply typically softens prices + rents 12–24 months out; constrained supply supports both.
Investment metrics
- 1% rule
- 0.80% ✗
- Cap rate
- 6.46%
- Cash-on-cash
- 0.61%
- DSCR
- 1.03
- GRM
- 10.4
CMA / ARV
- ARV (median comp)
- $221,592
- List price
- $219,000
- Delta
- -1.17%
- Verdict
- FAIR
- Comps
- 20 within 1.0 mi
Show comp detail 12 sales within ~0.75 mi
| Address | Dist | Beds/Ba | Sqft | Sold | Price | $/sf | Match |
|---|---|---|---|---|---|---|---|
| 8 E 11th St | 0.29mi | 3/2.0 (-1) | 1,550 (-1%) | 9mo | $269,900 | $174 | 67 |
| 612 W 3rd St | 0.56mi | 3/1.0 (-1) | 1,523 (-3%) | 2mo | $249,900 | $164 | 62 |
| 341 Stafford St | 0.44mi | 3/2.0 (-1) | 1,498 (-5%) | 2mo | $265,000 | $177 | 61 |
| 709 Ron Ave | 0.39mi | 4/2.5 | 1,404 (-11%) | 0mo | $260,000 | $185 | 58 |
| 701 Nora St | 0.31mi | 3/1.0 (-1) | 1,344 (-14%) | 1mo | $269,900 | $201 | 56 |
| 210 E Main St | 0.58mi | 4/3.0 | 1,486 (-5%) | 1mo | $335,000 | $225 | 55 |
| 426 E 5th St | 0.48mi | 4/2.0 | 1,458 (-7%) | 8mo | $207,000 | $142 | 55 |
| 528 E 11th St | 0.49mi | 3/2.0 (-1) | 1,436 (-9%) | 3mo | $225,000 | $157 | 52 |
| 310 Fair St | 0.66mi | 4/2.0 | 1,500 (-4%) | 9mo | $220,000 | $147 | 50 |
| 810 W 8th St | 0.35mi | 3/3.0 (-1) | 1,403 (-11%) | 7mo | $251,500 | $179 | 47 |
| 808 Macarthur St | 0.71mi | 3/2.0 (-1) | 1,665 (+6%) | 6mo | $267,000 | $160 | 44 |
| 824 Locust St | 0.32mi | 3/3.5 (-1) | 1,370 (-13%) | 8mo | $325,000 | $237 | 42 |
Match score weights: distance 35% · size 25% · config 20% · recency 20%. Top-matched comps best support the ARV.
Projected returns pro-forma
-3.0% appreciation · 3.0% rent growth · sell at horizon
- IRR
- -15.4%
- Equity multiple
- 0.45×
- Total profit
- $-33,580
- Equity at exit
- $32,654
- IRR
- -6.9%
- Equity multiple
- 0.56×
- Total profit
- $-26,986
- Equity at exit
- $18,935
Cash invested: $61,320 (down + closing). Projections, not guarantees.
Landlord ↔ Tenant lean methodology
- Overall (STATE)
- 81 Strongly Landlord-Friendly
- State Missouri
- 81 Strongly Landlord-Friendly · R+10
- County
- — inherits STATE
- City
- — inherits STATE
ZIP-level market 63090
- Active inventory
- 203
- Price-to-rent
- 10.4×
Monthly cashflow live
- Estimated rent
- $1,751 medium interval (Pro) →
- Mortgage (P&I)
- −$1,148
- Tax from tax record
- −$113 /mo · $1,352/yr
- Insurance
- −$91
- HOA
- −$0
- Vacancy / Maint / Mgmt
- −$368
- Net cashflow
- $31
Break-even live
Sensitivity live
| Price | -10% $155 | -5% $93 | +0% $31 | +5% $-31 | +10% $-93 |
|---|---|---|---|---|---|
| Rent | -10% $-107 | -5% $-38 | +0% $31 | +5% $100 | +10% $169 |
| Rate | -1.0pp $141 | -0.5pp $87 | base $31 | +0.5pp $-26 | +1.0pp $-83 |
UW: 25.0% down · 7.5% · 30yr · 1.5% tax · 5.0% vac · 8.0% maint · 8.0% mgmt
Financing live
Cash to close
- Down payment
- $54,750
- Closing costs
- $6,570
- Reserves months
- —
- Total cash needed
- —
Loan-product check · same deal, 3 products live
Conventional
25% down · 7.5% · 30yr
- Down + closing
- —
- Monthly P&I
- —
- Monthly cashflow
- —
- DSCR
- —
- Eligible?
- —
Personal DTI + credit; lowest rate.
DSCR
20% down · 8.5% · 30yr
- Down + closing
- —
- Monthly P&I
- —
- Monthly cashflow
- —
- DSCR
- —
- Eligible?
- —
No personal income docs; deal must DSCR.
Hard money
10% down · 12.0% · 12mo
- Down + closing
- —
- Monthly P&I
- —
- Monthly cashflow
- —
- DSCR
- —
- Eligible?
- —
Short-term bridge; refi at stabilization.
Rent comps 4 comps
| Address | Beds | Baths | Sqft | Rent | $/sqft | DOM | Units | Dist |
|---|---|---|---|---|---|---|---|---|
| 510 W 5th St Unit B Washington, MO | 3.0 | 1.0 | 1200 | $1,375 | $1.15 | 45d | 1 | 0.29mi |
| 715 W 2nd St Washington, MO | 4.0 | 2.5 | 1800 | $2,100 | $1.17 | 12d | 1 | 0.78mi |
| 1025 Don Ave Washington, MO | 1.0–3.0 | 1.0–2.0 | 1150 | $1,750 | $1.52 | 0d | 4 | 0.84mi |
| 25 Madison Ave Washington, MO | 3.0 | 2.0 | 1428 | $2,375 | $1.66 | 0d | 1 | 0.96mi |
Listing history 20 events
-
2026-06-21days on market $219,000 Active 82 DOM
-
2026-06-18days on market $219,000 Active 79 DOM
-
2026-06-17days on market $219,000 Active 78 DOM
-
2026-06-16days on market $219,000 Active 77 DOM
-
2026-06-15days on market $219,000 Active 76 DOM
-
2026-06-13days on market $219,000 Active 74 DOM
-
2026-06-13days on market $219,000 Active 73 DOM
-
2026-06-09days on market $219,000 Active 70 DOM
-
2026-06-08days on market $219,000 Active 69 DOM
-
2026-06-07days on market $219,000 Active 68 DOM
-
2026-06-03days on market $219,000 Active 64 DOM
-
2026-06-02days on market $219,000 Active 63 DOM
-
2026-06-01days on market $219,000 Active 62 DOM
-
2026-05-31days on market $219,000 Active 61 DOM
-
2026-05-07$224,900 Active 454-char remark
Show marketing remark (454 chars)
Welcome to this 4-bedroom, 2-bath home offering 1,571 sq ft of versatile living space. Currently used as a 2-family rental, this could easily be used as a single family residence. Each level houses 2 bedrooms and full bath as well as an eat-in kitchen. The upper level also features a family room and main level a spacious living room. Outside you'll find a 2-car detached garage and nice level lot. Set your appointment Today! More pictures coming.
-
2026-04-01$224,900 Active 455-char remark
Show marketing remark (455 chars)
Welcome to this 4-bedroom, 2-bath home offering 1,571 sq ft of versatile living space. Previously used as a 2-family rental, this could easily be used as a single family residence. Each level houses 2 bedrooms and full bath as well as an eat-in kitchen. The upper level also features a family room and main level a spacious living room. Outside you'll find a 2-car detached garage and nice level lot. Set your appointment Today! More pictures coming.
-
2026-03-26historical $224,900 455-char remark
Show marketing remark (455 chars)
Welcome to this 4-bedroom, 2-bath home offering 1,571 sq ft of versatile living space. Previously used as a 2-family rental, this could easily be used as a single family residence. Each level houses 2 bedrooms and full bath as well as an eat-in kitchen. The upper level also features a family room and main level a spacious living room. Outside you'll find a 2-car detached garage and nice level lot. Set your appointment Today! More pictures coming.
-
2022-03-24soldstatus
-
2004-06-30soldstatus
-
2001-08-21soldstatus
ⓘ Source: listings_history table (triggers on properties + properties_extension) + one-shot
backfill from property_details.listing_events for pre-trigger history.
Tax reassessment forecast MO · Resets to sale price
- Current annual tax
- $1,352 · $113/mo
- Projected year-2 tax
- $2,124 · $177/mo
- Expected delta
- +$772/yr (+$64/mo · 57.1%)
ⓘ Screening estimate from a state-policy table — verify with the county assessor before closing.
Climate risk First Street
- Flood 1/10 Low FEMA zone X (unshaded) · 0% chance over 30 yrs
- Wildfire 2/10 Low
- Heat 5/10 Major 7 d/yr ≥108°F today · 20 d/yr by 30 yrs out
- Wind 2/10 Low 100% chance of damaging wind over 30 yrs
- Air quality 1/10 Low 0 unhealthy d/yr today · 0 by 30 yrs out
Nearby sold comps map
Loading sold comps map…
Walkable amenities ~0.75 mi
Loading nearby amenities…
Taxation est. · year 1
- Rental income
- $21,015
- − Mortgage interest
- −$12,267
- − Property taxes
- −$1,352
- − Insurance
- −$1,095
- − Repairs & maintenance
- −$1,681
- − Management
- −$1,681
- − Depreciation
- −$6,371
- Taxable loss
- −$3,433
- Est. tax savings @ 24.0%
- +$824
- After-tax cash flow
- $1,197/yr
For passive investors: Depreciation is non-cash, so a rental often shows a tax loss while cash-flowing — sheltering income. Rental losses are passive: they offset passive income freely, and up to $25,000/yr can offset ordinary (W-2) income if you actively participate and your MAGI is under $100k (phasing out to $0 by $150k); unused losses carry forward. On sale, claimed depreciation is recaptured at up to 25%, and gains may owe capital-gains tax (a 1031 exchange can defer both). Figures are a year-1 estimate at your 24.0% rate — not tax advice; consult a CPA.
Schools (NCES district)
- District
- Washington
- NCES district ID
- 2931110
- Math proficiency
- 41% ▼ -3.00%
- Reading proficiency
- 55% ▼ -1.00%
- Median HH income
- $58,344
- Composite
- 41.87/100
- National rank
- #3372
- State rank
- #46 of 324 in MO
Livability — Washington
- Score
- 81/100
- State rank
- #13
- US rank
- #1373
Category grades
Schools grade is shown separately in the Schools card above.
Census & demographics
- Census place
- Washington, MO
- Population (ZIP)
- 22,471
Population outlook (Franklin County) Hauer SSP2
- Today (2025)
- 103,600 people
- By 2030
- 103,298 · -0.3%
- By 2040
- 100,607 · -2.9%
- By 2050
- 94,280 · -9.0%
- By 2075
- 77,103 · -25.6%
- By 2100
- 54,405 · -47.5%
Race, ethnicity, and origin ACS 2023
- Neighborhood character
- Predominantly White (93%)
- Race & ethnicity
- White 93% Two or more races 6% Hispanic / Latino 1%
- Common ancestry
- Lithuanian 3% Romanian 3% Slovak 2%
- Foreign-born
- 1% · Canada
- Languages at home
- 99% English-only · German/W. Germanic 1%
Political lean MEDSL · Franklin
- 2024 margin
- Solid R (+45.9) · D 26.5% · R 72.4% · Other 1.1%
- 2008→2024 swing
- -33.5pp toward R · 2008: -12.4pp · 2024: -45.9pp
- All cycles
- 2024: R+45.9 2020: R+43.8 2016: R+46.1 2012: R+27.9 2008: R+12.4
Not yet ingested
- Civics
- —
Market trends
- HPI YoY
- ▼ -96.53%
- Current HPI
- 175.3309
- Rent YoY
- —
- Metro
- —
- State GDP YoY
- ▲ 1.84%
- F500 in state
- 20
Industry mix (Fortune 500 HQ in MO)
| Industry | F500 HQs | Revenue |
|---|---|---|
| Healthcare | 1 | $163B |
|
||
| Insurance | 1 | $21B |
|
||
| Industrial Technology | 1 | $17B |
|
||
| Retail | 1 | $16B |
|
||
| Industrial Distribution | 1 | $10B |
|
||
| Utilities | 1 | $9B |
|
||
Price history
+0.0% since first listed6 events — show timeline
- 2026-05-07 Listed $224,900 MARIS as Distributed by MLS Grid
- 2026-04-01 Listed $224,900 MARIS as Distributed by MLS Grid
- 2026-03-26 Coming Soon $224,900 MARIS as Distributed by MLS Grid
- 2022-03-24 Sold (Public Records) — Public Records
- 2004-06-30 Sold (Public Records) — Public Records
- 2001-08-21 Sold (Public Records) — Public Records
Property tax history
+3.2%/yrLatest (2025): $1,352 · +3.7% YoY. Source: county tax records.
Cash-flow waterfall
monthlySold comps — $/sqft
last 12 mo · ≤1 miLoading sold comps…