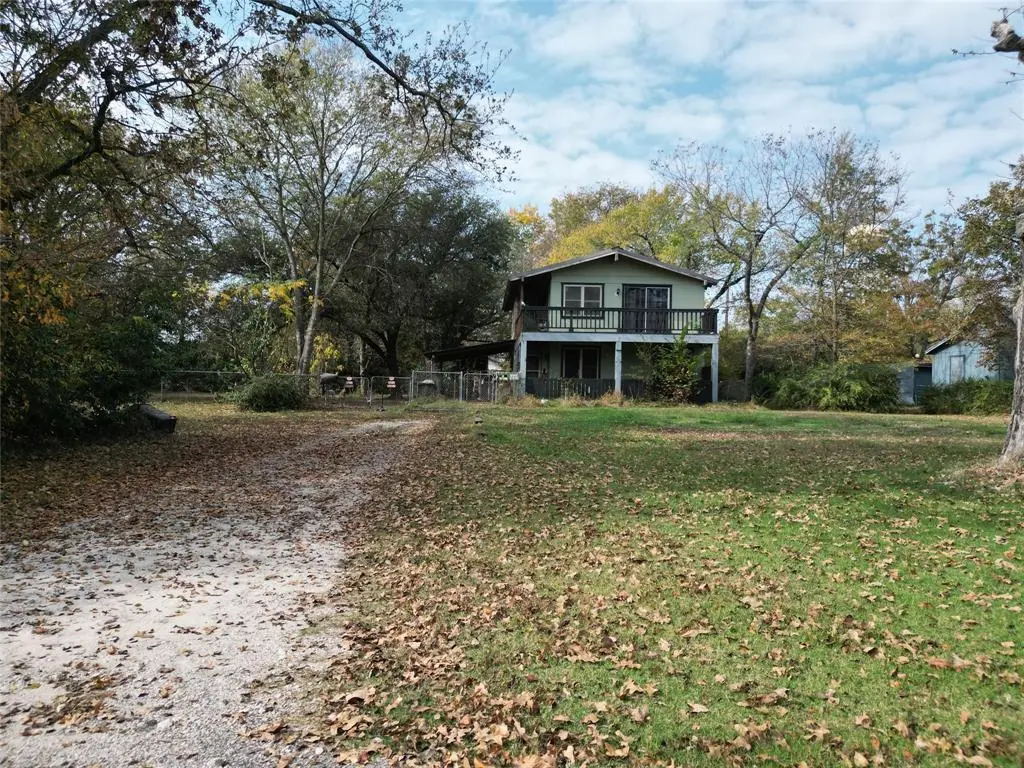
242 Club Park Ct · East Tawakoni, TX
Flood risk 1/10 · Minimal
- FEMA flood zone
- X (unshaded)
- Chance of flooding over 30 yrs
- 0.0%
- Est. flood insurance / yr
- $507 – $1,088
Fire risk 3/10 · Minor
- Est. fire insurance / yr
- $1,222 – $2,270
Heat risk 7/10 · Major
- Hot days now (above 110°F)
- 7 days/yr
- Hot days in 30 yrs
- 24 days/yr
Wind risk 6/10 · Moderate
- Chance of severe wind over 30 yrs
- 27.0%
Air-quality risk 2/10 · Minimal
- Unhealthy air days now
- 0 days/yr
- Unhealthy air days in 30 yrs
- 1 days/yr
Risk factors via First Street. Map © Google.
Why this score? — see what drove the C+ grade
The composite is a weighted blend of 9 inputs, each scored 0–100. Each bar is that input's sub-score; the figure is the points it added to the 100-point composite (weight × sub-score).
- Cash flow +22.6/30.0
- ARV discount +15.0/15.0
- DSCR +7.2/10.0
- 1% rule +5.8/10.0
- Livability +2.6/5.0
- Rent growth +2.5/5.0
- Condition / age +2.5/5.0
- Schools +2.2/10.0
- Appreciation +0.0/10.0
$170,000
🖨 Deal sheet 📄 Offer letter ✓ Due diligence
Listing remarks MLS
This charming two-story frame home sits near the lake on a peaceful cul-de-sac, offering a perfect blend of comfort and privacy. A spacious wrap-around porch invites you to relax and enjoy the surrounding views, while the fenced yard provides room for pets, gardening, or outdoor gatherings. Inside, the home features a warm and welcoming layout ideal for everyday living or weekend retreats. With its desirable location and inviting outdoor spaces, this property delivers the ideal lakeside lifestyle.
Key facts
- Lakeside lifestyle
- Fenced yard
- Peaceful cul-de-sac
Tags
Neighborhood map
What this means for you Summary
Snapshot
- This is a 3-bed/2.0-bath single-family listed at $170k.
Deal economics
- At list price, monthly cash flow is $288 ($3k/yr) — positive.
- The deal already cash-flows at list — no discount required.
- Meets the 1% rule at list price ($2k rent vs $170k).
- Recommended offer: $167k (1.5% below list) — sets the bar for market timing.
- Cap rate 8.3% vs local median 4.5% in East Tawakoni — top-decile yield for the area; either an underpriced asset or a hidden risk that comps aren't pricing in. Stress-test before assuming the spread holds.
Location & tenants
- Location reads 52/100 on livability (#1,455 in TX) — a working-class tenant base; expect higher turnover. Strengths: cost of living A+, housing A+; Watch: crime D, schools F, amenities F.
- Rains ISD (rural): math 22% / reading 30% proficiency, ranked #697 of 826 in TX (top 84%) — low school quality limits family demand, transient renter base, plan for 1-2y turnover.
- Market conditions: 137 active listings in the ZIP; 2 comparable units currently listed for rent nearby; 21 units permitted in Rains County in 2024 (0 in 5+ unit buildings).
Forward outlook
- Local home prices are declining (-3.0%/yr); year-one equity from $1k of loan paydown is wiped out by about $5k of value loss. Plan a longer hold.
Negotiation context
- It's been on market 17 days — a 2% lower offer ($167k) is reasonable based on typical stale-listing flexibility.
- 6 sale attempts since 8y ago with the ask held roughly flat each time — persistent listings suggest the price (not the market) is what's stuck; bring a comps-based counter.
Risks & watch-outs
- Climate carrying-cost: major wind risk, 27% chance of damaging wind over 30y; extreme-heat days projected 7→24/yr by 2055 (HVAC capex compounding) — expect insurance premiums to compound above CPI over the hold.
Questions for the listing agent
- Built in 1970 — when were the roof, HVAC, electrical panel, plumbing, and water heater last replaced?
- Is there a deadline driving the sale (1031 exchange, divorce, estate, relocation)? That informs how much negotiation room exists.
- Schools are F-rated, which usually means shorter tenancies and higher turnover. Who's the typical renter profile here, and what's been the actual vacancy rate?
- Crime grade is D in this area — have there been break-ins, vandalism, or insurance claims at this property in the last 3 years? What carrier currently insures it and at what premium?
- What's the average days-on-market for RENTAL listings here right now (not sales)? A rising rental-DOM trend means longer vacancies and softer asking-rent achievability than the comps imply.
- What's the recent tenant-quality profile in this submarket — average credit score on applications, eviction rate, late-payment / NSF rate, and stable-employment percentage? A property-management company in the area should have these aggregated.
- How much new for-sale + rental construction is in the pipeline within 1–3 miles? Heavy new supply typically softens prices + rents 12–24 months out; constrained supply supports both.
Investment metrics
- 1% rule
- 1.08% ✓
- Cap rate
- 8.33%
- Cash-on-cash
- 7.27%
- DSCR
- 1.32
- GRM
- 7.7
CMA / ARV
- ARV (median comp)
- $237,163
- List price
- $170,000
- Delta
- -28.32%
- Verdict
- UNDERPRICED
- Comps
- 20 within 1.0 mi
Show comp detail 10 sales within ~0.75 mi
| Address | Dist | Beds/Ba | Sqft | Sold | Price | $/sf | Match |
|---|---|---|---|---|---|---|---|
| 949 Little Oaks Dr | 0.17mi | 3/2.0 | 1,500 (+5%) | 5mo | $520,000 | $347 | 79 |
| 175 Harris Harbor Rd | 0.42mi | 3/2.0 | 1,416 (-1%) | 1mo | $279,000 | $197 | 78 |
| 608 Oak Leaf Trl | 0.03mi | 3/2.0 | 1,500 (+5%) | 16mo | $285,000 | $190 | 76 |
| 450 Oak Leaf Trl | 0.25mi | 3/2.0 | 1,408 (-1%) | 16mo | $139,900 | $99 | 73 |
| 488 Briggs Blvd | 0.31mi | 3/1.0 | 1,400 (-2%) | 9mo | $329,000 | $235 | 72 |
| 130 Pierson Xing | 0.47mi | 3/2.0 | 1,500 (+5%) | 1mo | $269,900 | $180 | 69 |
| 950 Little Oaks Dr | 0.18mi | 3/2.5 | 1,544 (+8%) | 10mo | $345,000 | $223 | 67 |
| 161 Harris Harbor Rd | 0.42mi | 3/2.0 | 1,391 (-2%) | 12mo | $275,000 | $198 | 66 |
| 190 Harris Harbor Rd | 0.41mi | 3/2.0 | 1,425 (+0%) | 22mo | $265,000 | $186 | 62 |
| 1049 E State Highway 276 | 0.56mi | 3/2.0 | 1,518 (+7%) | 11mo | $359,000 | $236 | 54 |
Match score weights: distance 35% · size 25% · config 20% · recency 20%. Top-matched comps best support the ARV.
Projected returns pro-forma
-3.0% appreciation · 3.0% rent growth · sell at horizon
- IRR
- -5.2%
- Equity multiple
- 0.81×
- Total profit
- $-9,161
- Equity at exit
- $25,348
- IRR
- 4.5%
- Equity multiple
- 1.33×
- Total profit
- $15,761
- Equity at exit
- $14,698
Cash invested: $47,600 (down + closing). Projections, not guarantees.
Landlord ↔ Tenant lean methodology
- Overall (STATE)
- 87 Strongly Landlord-Friendly
- State Texas
- 87 Strongly Landlord-Friendly · R+5
- County
- — inherits STATE
- City
- — inherits STATE
ZIP-level market 75472
- Home prices YoY
- -6.4%
- Active inventory
- 137
- Price-to-rent
- 7.7×
Monthly cashflow live
- Estimated rent
- $1,842 medium interval (Pro) →
- Mortgage (P&I)
- −$891
- Tax from tax record
- −$205 /mo · $2,454/yr
- Insurance
- −$71
- HOA
- −$0
- Vacancy / Maint / Mgmt
- −$387
- Net cashflow
- $288
Break-even live
UW: 25.0% down · 7.5% · 30yr · 1.5% tax · 5.0% vac · 8.0% maint · 8.0% mgmt
Financing live
Cash to close
- Down payment
- $42,500
- Closing costs
- $5,100
- Reserves months
- —
- Total cash needed
- —
Loan-product check · same deal, 3 products live
Conventional
25% down · 7.5% · 30yr
- Down + closing
- —
- Monthly P&I
- —
- Monthly cashflow
- —
- DSCR
- —
- Eligible?
- —
Personal DTI + credit; lowest rate.
DSCR
20% down · 8.5% · 30yr
- Down + closing
- —
- Monthly P&I
- —
- Monthly cashflow
- —
- DSCR
- —
- Eligible?
- —
No personal income docs; deal must DSCR.
Hard money
10% down · 12.0% · 12mo
- Down + closing
- —
- Monthly P&I
- —
- Monthly cashflow
- —
- DSCR
- —
- Eligible?
- —
Short-term bridge; refi at stabilization.
Rent comps 2 comps
| Address | Beds | Baths | Sqft | Rent | $/sqft | DOM | Units | Dist |
|---|---|---|---|---|---|---|---|---|
| 743 Oak Leaf Trl Point, TX | 3.0 | 1.0 | 1215 | $1,850 | $1.52 | 1d | 1 | 0.13mi |
| 469 Rs County Road 1605 Unit 1605 Point, TX | 2.0 | 1.5 | 900 | $1,750 | $1.94 | 44d | 1 | 1.12mi |
Listing history 26 events
-
2026-06-19days on market $170,000 Active 17 DOM
-
2026-06-18days on market $170,000 Active 16 DOM
-
2026-06-17days on market $170,000 Active 15 DOM
-
2026-06-16days on market $170,000 Active 14 DOM
-
2026-06-15days on market $170,000 Active 13 DOM
-
2026-06-14days on market $170,000 Active 11 DOM
-
2026-06-12days on market $170,000 Active 10 DOM
-
2026-06-09days on market $170,000 Active 7 DOM
-
2026-06-08days on market $170,000 Active 6 DOM
-
2026-06-07days on market $170,000 Active 5 DOM
-
2026-06-07days on market $170,000 Active 4 DOM
-
2026-06-03days on market $170,000 Active 1 DOM
-
2026-05-31days on market $170,000 Active 191 DOM
-
2026-05-30days on market $170,000 Active 190 DOM
-
2025-11-21historical
-
2025-11-21status Active
-
2025-11-19$170,000 Active 502-char remark
Show marketing remark (502 chars)
This charming two-story frame home sits near the lake on a peaceful cul-de-sac, offering a perfect blend of comfort and privacy. A spacious wrap-around porch invites you to relax and enjoy the surrounding views, while the fenced yard provides room for pets, gardening, or outdoor gatherings. Inside, the home features a warm and welcoming layout ideal for everyday living or weekend retreats. With its desirable location and inviting outdoor spaces, this property delivers the ideal lakeside lifestyle.
-
2025-09-02price $170,000
-
2025-08-28$200,000 Active
-
2025-07-16historical
-
2025-04-16$225,000 Active
-
2025-04-15historical
-
2025-03-22price $225,000
-
2025-01-15$275,000 Active
-
2018-09-24soldstatus
-
2018-04-06$78,000
ⓘ Source: listings_history table (triggers on properties + properties_extension) + one-shot
backfill from property_details.listing_events for pre-trigger history.
Tax reassessment forecast TX · Resets to sale price
- Current annual tax
- $2,454 · $205/mo
- Projected year-2 tax
- $3,111 · $259/mo
- Expected delta
- +$657/yr (+$55/mo · 26.7%)
ⓘ Screening estimate from a state-policy table — verify with the county assessor before closing.
Climate risk First Street
- Flood 1/10 Low FEMA zone X (unshaded) · 0% chance over 30 yrs
- Wildfire 3/10 Moderate
- Heat 7/10 Severe 7 d/yr ≥110°F today · 24 d/yr by 30 yrs out
- Wind 6/10 Major 27% chance of damaging wind over 30 yrs
- Air quality 2/10 Low 0 unhealthy d/yr today · 1 by 30 yrs out
Nearby sold comps map
Loading sold comps map…
Walkable amenities ~0.75 mi
Loading nearby amenities…
Taxation est. · year 1
- Rental income
- $22,104
- − Mortgage interest
- −$9,523
- − Property taxes
- −$2,454
- − Insurance
- −$850
- − Repairs & maintenance
- −$1,768
- − Management
- −$1,768
- − Depreciation
- −$4,945
- Taxable income
- $795
- Est. tax owed @ 24.0%
- −$191
- After-tax cash flow
- $3,269/yr
For passive investors: Depreciation is non-cash, so a rental often shows a tax loss while cash-flowing — sheltering income. Rental losses are passive: they offset passive income freely, and up to $25,000/yr can offset ordinary (W-2) income if you actively participate and your MAGI is under $100k (phasing out to $0 by $150k); unused losses carry forward. On sale, claimed depreciation is recaptured at up to 25%, and gains may owe capital-gains tax (a 1031 exchange can defer both). Figures are a year-1 estimate at your 24.0% rate — not tax advice; consult a CPA.
Schools (NCES district)
- District
- Rains ISD
- NCES district ID
- 4836360
- Math proficiency
- 22% ▼ -20.00%
- Reading proficiency
- 30% ▼ -10.00%
- Median HH income
- $45,836
- Composite
- 22.46/100
- National rank
- #8106
- State rank
- #697 of 826 in TX
Livability — East Tawakoni
- Score
- 52/100
- State rank
- #1455
- US rank
- #24873
Category grades
Schools grade is shown separately in the Schools card above.
Census & demographics
- Census place
- East Tawakoni, TX
- Population (ZIP)
- 4,290
Population outlook (Rains County) Hauer SSP2
- Today (2025)
- 11,516 people
- By 2030
- 11,610 · +0.8%
- By 2040
- 11,622 · +0.9%
- By 2050
- 11,329 · -1.6%
- By 2075
- 10,390 · -9.8%
- By 2100
- 8,809 · -23.5%
Race, ethnicity, and origin ACS 2023
- Neighborhood character
- Predominantly White (80%)
- Race & ethnicity
- White 80% Hispanic / Latino 13% Two or more races 11% Black 3%
- Hispanic origin (detail)
- Mexican 12%
- Common ancestry
- Iranian 3% Lithuanian 2% Slovak 1%
- Foreign-born
- 1% · Canada
- Languages at home
- 96% English-only · Spanish 3%
Political lean MEDSL · Rains
- 2024 margin
- Solid R (+72.9) · D 13.3% · R 86.2%
- 2008→2024 swing
- -23.4pp toward R · 2008: -49.5pp · 2024: -72.9pp
- All cycles
- 2024: R+72.9 2020: R+71.2 2016: R+71.3 2012: R+61.8 2008: R+49.5
Not yet ingested
- Civics
- —
Market trends
- HPI YoY
- ▼ -10.57%
- Current HPI
- 153.54
- Rent YoY
- —
- Metro
- —
- State GDP YoY
- ▲ 3.95%
- F500 in state
- 110
Industry mix (Fortune 500 HQ in TX)
| Industry | F500 HQs | Revenue |
|---|---|---|
| Energy | 16 | $1,198B |
|
||
| Technology | 5 | $198B |
|
||
| Engineering / Construction | 4 | $72B |
|
||
| Energy Services | 3 | $60B |
|
||
| Utilities | 3 | $41B |
|
||
| Healthcare | 2 | $330B |
|
||
Price history
+117.9% since first listed12 events — show timeline
- 2025-11-21 Listing Removed — NTREIS
- 2025-11-21 Relisted — NTREIS
- 2025-11-19 Listed $170,000 NTREIS
- 2025-09-02 Price Changed $170,000 NTREIS
- 2025-08-28 Listed $200,000 NTREIS
- 2025-07-16 Listing Removed — NTREIS
- 2025-04-16 Listed $225,000 NTREIS
- 2025-04-15 Listing Removed — NTREIS
- 2025-03-22 Price Changed $225,000 NTREIS
- 2025-01-15 Listed $275,000 NTREIS
- 2018-09-24 Sold (MLS) — NTREIS
- 2018-04-06 Listed $78,000 NTREIS
Property tax history
+4.8%/yrLatest (2025): $2,454 · +17.7% YoY. Source: county tax records.
Cash-flow waterfall
monthlySold comps — $/sqft
last 12 mo · ≤1 miLoading sold comps…