 🌊 Lakefront
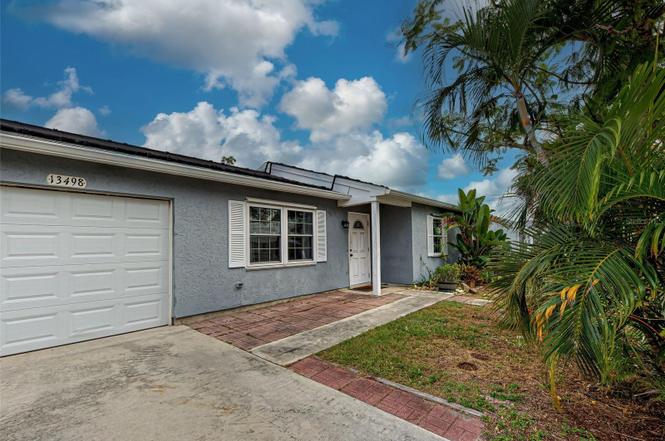
13498 Darnell Ave · North Port, FL
Flood risk 9/10 · Severe
- FEMA flood zone
- AE
- Chance of flooding over 30 yrs
- 0.99%
- Est. flood insurance / yr
- $1,737 – $8,500
Fire risk 3/10 · Minor
- Est. fire insurance / yr
- $947 – $1,759
Heat risk 10/10 · Severe
- Hot days now (above 106°F)
- 7 days/yr
- Hot days in 30 yrs
- 29 days/yr
Wind risk 10/10 · Severe
- Chance of severe wind over 30 yrs
- 99.0%
Air-quality risk 2/10 · Minimal
- Unhealthy air days now
- 1 days/yr
- Unhealthy air days in 30 yrs
- 1 days/yr
Risk factors via First Street. Map © Google.
Why this score? — see what drove the C grade
The composite is a weighted blend of 9 inputs, each scored 0–100. Each bar is that input's sub-score; the figure is the points it added to the 100-point composite (weight × sub-score).
- Cash flow +21.6/30.0
- ARV discount +8.4/15.0
- DSCR +6.9/10.0
- 1% rule +5.2/10.0
- Schools +4.6/10.0
- Rent growth +3.8/5.0
- Livability +3.8/5.0
- Condition / age +2.5/5.0
- Appreciation +0.0/10.0
$210,000
🖨 Deal sheet 📄 Offer letter ✓ Due diligence
Listing remarks
Under contract-accepting backup offers. * * MOTIVATED SELLER-BELOW MARKET VALUE * * Welcome to 13498 Darnell Ave in the Gardens of Gulf Cove! This charming 3-bedroom, 3-bath home WITH an ATTACHED IN-LAW SUITE offers plenty of space, comfort, and thoughtful updates throughout. Enjoy peace of mind with a NEW ROOF (2023), NEW A/C, NEW WATER HEATER, NEW ELECTRIC PANEL and a HURRICANE-RATED GARAGE DOOR. HURRICANE-RATED WINDOWS have also been installed throughout the main home for added protection. The IN-LAW SUITE features its own private entry, kitchen, and bathroom. Perfect for extended family, guests, or rental flexibility. Step outside and enjoy your FREE FORM SOLAR HEATED POOL, ideal fo
Key facts
- New water heater
- New a c
- New electric panel
Tags
Property features AI
Finance
- Other: Partially furnished
- Financial info: Lease restrictions apply
- HOA & community: Gardens of Gulf Cove HOA (annual fee $470, monthly approx. $39.17) — association approval required; Community amenities: clubhouse, fitness center, pool, tennis courts, pickleball courts, shuffleboard, recreation facilities, sidewalks; Pets allowed; Buyer approval required
Exterior
- Parking: Driveway; Attached garage with garage door opener (1 car)
- Utilities: Public water; Public sewer; Electricity connected; Cable available; Broadband/High-speed internet available; Water connected; Sewer connected
- Home design: Single family residence; One story; Faces south; Residential property
- Construction: Stucco and frame construction; Shingle roof; Other foundation
- Exterior features: Lighting; Rain gutters; Sidewalk; Sliding doors; Chain link fence; Canal water view; Private in-ground gunite pool with solar heat
Interior
- Kitchen: Dishwasher; Microwave; Range; Refrigerator
- Bedrooms: 3 bedrooms
- Flooring: Tile
- Bathrooms: 3 full bathrooms
- Heating & cooling: Central heating; Central air conditioning
- Interior features: Ceiling fans; Shutters; Storm windows
- Laundry & utility: Washer hookup; Electric dryer hookup; Laundry in garage
Neighborhood map
What this means for you Summary
Snapshot
- This is a 3-bed/3.0-bath single-family listed at $210k.
Deal economics
- At list price, monthly cash flow is $-107 ($-1k/yr) — negative.
- To cash-flow at today's rent, offer at most $191k (9.0% below list).
- Meets the 1% rule at list price ($2k rent vs $210k).
- Recommended offer: $185k (12.0% below list) — sets the bar for market timing.
- Cap rate 8.1% vs local median 3.6% in North Port — top-decile yield for the area; either an underpriced asset or a hidden risk that comps aren't pricing in. Stress-test before assuming the spread holds.
Location & tenants
- Location reads 75/100 on livability (#252 in FL, #3,975 nationally) — a middle-class / working-renter tenant base. Strengths: crime A+, housing A+, health & safety A+; Watch: amenities F, commute F.
- Charlotte (suburban): math 54% / reading 54% proficiency, ranked #22 of 73 in FL (top 30%) — acceptable for families but not a draw, mixed tenant base, ~2y average lease.
- Zoned schools: Myakka River Elementary School (math 65% / reading 60%, grade B, #601 of 2,144 statewide, top 28%, 608 students, 51% FRL); Lemon Bay High School (math 50% / reading 56%, grade C-, #148 of 667 statewide, top 23%, 1,360 students, 28% FRL).
- Market conditions: Rents rising fast (+5.3%/yr); 2188 active listings in the ZIP; 13 comparable units currently listed for rent nearby; rentals at typical pace (median 21d on market — plan ~3-4 weeks tenant-placement turnaround); solid renter incomes; 4,585 units permitted in Charlotte County in 2024 (703 in 5+ unit buildings).
- This rent runs 31% of the median local income ($84k/yr) — at the standard rent-burdened threshold; future hikes will face affordability resistance.
Forward outlook
- Local home prices are declining (-3.0%/yr); year-one equity from $1k of loan paydown is wiped out by about $6k of value loss. Plan a longer hold.
- Charlotte County population projected at +24% by 2050 — long-run rental-demand tailwind backs the buy-and-hold thesis.
Negotiation context
- It's been on market 209 days — a 12% lower offer ($185k) is reasonable based on typical stale-listing flexibility.
- Current owner paid $58k; list at $210k implies a 265% gain — meaningful room to come down on a strong offer.
Risks & watch-outs
- Watch-outs: flood insurance adds $427/mo.
- Climate carrying-cost: in FEMA flood zone AE (mandatory federal flood insurance); severe wind risk, 99% chance of damaging wind over 30y; extreme-heat days projected 7→29/yr by 2055 (HVAC capex compounding) — expect insurance premiums to compound above CPI over the hold.
Questions for the listing agent
- What do current leases actually rent for vs. the listed asking? Can we see a recent rent roll and the last 12 months of T-12 income?
- It's been on market 209 days. Have you received any prior offers? Is the seller open to a 12% concession, seller financing, or rate buy-down credit?
- What's the actual annual flood-insurance premium (NFIP or private), and is the property in a SFHA with mandatory coverage?
- What does the HOA fee cover, when was the last increase, and are there any pending special assessments or reserve-fund shortfalls?
- Why hasn't it sold? Are there any deal-killer items the seller is aware of (foundation, flood, title, zoning, code violations)?
- Is there a deadline driving the sale (1031 exchange, divorce, estate, relocation)? That informs how much negotiation room exists.
- Schools are B-rated — typically a magnet for longer-tenancy family renters. What's the average tenant stay here, and is there a school-zone premium baked into asking?
- This sits on a lake — are riparian / water-frontage rights deeded with the parcel? Any dock permits, shoreline easements, or HOA water-use restrictions?
- What's the documented flood / surge / shoreline-erosion history here (FEMA AND non-FEMA — e.g., storm surge, creek backup, septic-field saturation)?
- Any water-quality or seasonal algae-bloom issues that affect tenant satisfaction or short-term-rental demand?
- What's the average days-on-market for RENTAL listings here right now (not sales)? A rising rental-DOM trend means longer vacancies and softer asking-rent achievability than the comps imply.
- What's the recent tenant-quality profile in this submarket — average credit score on applications, eviction rate, late-payment / NSF rate, and stable-employment percentage? A property-management company in the area should have these aggregated.
- How much new for-sale + rental construction is in the pipeline within 1–3 miles? Heavy new supply typically softens prices + rents 12–24 months out; constrained supply supports both.
Investment metrics
- 1% rule
- 1.02% ✓
- Cap rate
- 8.12%
- Cash-on-cash
- 6.51%
- DSCR
- 1.29
- GRM
- 8.1
CMA / ARV
- ARV (on-the-fly)
- $214,400
- Comps found
- 12
Show comp detail 12 sales within ~0.75 mi
| Address | Dist | Beds/Ba | Sqft | Sold | Price | $/sf | Match |
|---|---|---|---|---|---|---|---|
| 13561 Darnell Ave | 0.12mi | 2/2.0 (-1) | 1,087 (+1%) | 11mo | $162,000 | $149 | 74 |
| 13562 Bennett Dr | 0.19mi | 2/2.0 (-1) | 998 (-7%) | 8mo | $210,000 | $210 | 64 |
| 13366 Bronze Ave | 0.46mi | 2/2.0 (-1) | 1,050 (-2%) | 4mo | $209,999 | $200 | 63 |
| 6233 Drucker Cir | 0.38mi | 3/2.0 | 1,116 (+4%) | 13mo | $220,000 | $197 | 60 |
| 6414 Coliseum Blvd | 0.29mi | 3/2.0 | 1,203 (+12%) | 10mo | $210,000 | $175 | 54 |
| 6543 Coliseum Blvd | 0.54mi | 2/2.0 (-1) | 1,006 (-6%) | 14mo | $250,000 | $249 | 44 |
| 5546 Montego Ln | 0.75mi | 2/2.0 (-1) | 1,001 (-7%) | 4mo | $170,000 | $170 | 42 |
| 5415 Joslyn Ter | 0.61mi | 3/2.0 | 1,224 (+14%) | 4mo | $280,000 | $229 | 40 |
| 13238 Fowler Ave | 0.65mi | 3/2.0 | 1,203 (+12%) | 8mo | $225,000 | $187 | 39 |
| 13577 Bennett Dr | 0.22mi | 2/1.0 (-1) | 918 (-14%) | 23mo | $239,900 | $261 | 33 |
| 13265 Fowler Ave | 0.63mi | 2/1.0 (-1) | 918 (-14%) | 2mo | $126,000 | $137 | 32 |
| 6398 Granger Rd | 0.70mi | 2/1.0 (-1) | 918 (-14%) | 22mo | $240,000 | $261 | 12 |
Match score weights: distance 35% · size 25% · config 20% · recency 20%. Top-matched comps best support the ARV.
Projected returns pro-forma
-3.0% appreciation · 5.29% rent growth · sell at horizon
- IRR
- -16.6%
- Equity multiple
- 0.40×
- Total profit
- $-35,548
- Equity at exit
- $31,312
- IRR
- -3.9%
- Equity multiple
- 0.71×
- Total profit
- $-16,940
- Equity at exit
- $18,157
Cash invested: $58,800 (down + closing). Projections, not guarantees.
Landlord ↔ Tenant lean methodology
- Overall (STATE)
- 87 Strongly Landlord-Friendly
- State Florida
- 87 Strongly Landlord-Friendly · R+3
- County
- — inherits STATE
- City
- — inherits STATE
ZIP-level market 33981
- Home prices YoY
- -7.5%
- Rents YoY
- 5.3%
- Active inventory
- 2188
- Price-to-rent
- 8.1×
Monthly cashflow live
- Estimated rent
- $2,151 high interval (Pro) →
- Mortgage (P&I)
- −$1,101
- Tax from tax record
- −$153 /mo · $1,831/yr
- Insurance
- −$88
- Flood insurance flood zone
- −$427 /mo · $5,118/yr
- HOA
- −$39
- Vacancy / Maint / Mgmt
- −$452
- Net cashflow
- $-107
Break-even live
UW: 25.0% down · 7.5% · 30yr · 1.5% tax · 5.0% vac · 8.0% maint · 8.0% mgmt
Financing live
Cash to close
- Down payment
- $52,500
- Closing costs
- $6,300
- Reserves months
- —
- Total cash needed
- —
Loan-product check · same deal, 3 products live
Conventional
25% down · 7.5% · 30yr
- Down + closing
- —
- Monthly P&I
- —
- Monthly cashflow
- —
- DSCR
- —
- Eligible?
- —
Personal DTI + credit; lowest rate.
DSCR
20% down · 8.5% · 30yr
- Down + closing
- —
- Monthly P&I
- —
- Monthly cashflow
- —
- DSCR
- —
- Eligible?
- —
No personal income docs; deal must DSCR.
Hard money
10% down · 12.0% · 12mo
- Down + closing
- —
- Monthly P&I
- —
- Monthly cashflow
- —
- DSCR
- —
- Eligible?
- —
Short-term bridge; refi at stabilization.
Rent comps 13 comps
| Address | Beds | Baths | Sqft | Rent | $/sqft | DOM | Units | Dist |
|---|---|---|---|---|---|---|---|---|
| 13280 Foresman Blvd Port Charlotte, FL | 3.0 | 2.0 | 1500 | $2,800 | $1.87 | 13d | 1 | 0.36mi |
| 6248 Drucker Cir Port Charlotte, FL | 3.0 | 2.0 | 1414 | $1,810 | $1.28 | 13d | 1 | 0.40mi |
| 6351 Coniston St Port Charlotte, FL | 3.0 | 2.0 | 1200 | $1,950 | $1.62 | 21d | 1 | 0.53mi |
| 6551 Coliseum Blvd Port Charlotte, FL | 3.0 | 2.0 | 1386 | $1,850 | $1.33 | 13d | 1 | 0.53mi |
| 13288 Fowler Ave Port Charlotte, FL | 3.0 | 2.0 | 1203 | $2,500 | $2.08 | 21d | 1 | 0.56mi |
| 6628 Thorman Rd Port Charlotte, FL | 3.0 | 2.0 | 1116 | $1,800 | $1.61 | 21d | 1 | 0.64mi |
| 5292 Early Ter Port Charlotte, FL | 2.0 | 2.0 | 1130 | $1,800 | $1.59 | 21d | 1 | 0.80mi |
| 5498 Montego Ln Port Charlotte, FL | 2.0 | 2.0 | 1070 | $1,695 | $1.58 | 21d | 1 | 0.83mi |
| 13100 S McCall Rd Port Charlotte, FL | 2.0 | 2.0 | 832 | $1,300 | $1.56 | 21d | 1 | 1.03mi |
| 5496 Brussels Ter Port Charlotte, FL | 3.0 | 2.0 | 1400 | $3,900 | $2.79 | 21d | 1 | 1.22mi |
| 6795 David Blvd Apt A Port Charlotte, FL | 2.0 | 1.0 | 1127 | $1,375 | $1.22 | 21d | 1 | 1.39mi |
| 5311 Levy Ln Port Charlotte, FL | 3.0 | 2.0 | 1192 | $1,850 | $1.55 | 13d | 1 | 1.43mi |
| 12223 Maltz Ave Unit 12225" Port Charlotte, FL | 3.0 | 2.0 | 1162 | $1,649 | $1.42 | 21d | 1 | 1.50mi |
HOA detail
- Monthly dues
- $39 · $468/yr
- Likely covers
- waterelectricpool
Listing history 18 events
-
2026-06-13statusdays on market $210,000 Pending 209 DOM
-
2026-06-10days on market $210,000 Active 208 DOM
-
2026-06-09days on market $210,000 Active 207 DOM
-
2026-06-08pricedays on market $210,000 Active 206 DOM
-
2026-06-05days on market $225,000 Active 202 DOM
-
2026-06-02days on market $225,000 Active 200 DOM
-
2026-06-01days on market $225,000 Active 199 DOM
-
2026-05-31days on market $225,000 Active 198 DOM
-
2026-05-30days on market $225,000 Active 197 DOM
-
2026-05-02price $225,000
-
2026-04-28price $235,000
-
2026-04-24price $245,000
-
2026-03-10price $252,500
-
2026-02-12price $265,000
-
2026-01-15price $275,000
-
2025-11-14$285,000 Active
-
1991-09-01soldstatus $57,500
-
1990-02-01soldstatus $45,700
ⓘ Source: listings_history table (triggers on properties + properties_extension) + one-shot
backfill from property_details.listing_events for pre-trigger history.
Tax reassessment forecast FL · Resets to sale price
- Current annual tax
- $1,831 · $153/mo
- Projected year-2 tax
- $1,831 · $153/mo
- Expected delta
- $0/yr ($0/mo · -0.0%)
ⓘ Screening estimate from a state-policy table — verify with the county assessor before closing.
Climate risk First Street
- Flood 9/10 Extreme FEMA zone AE · 99% chance over 30 yrs
- Wildfire 3/10 Moderate
- Heat 10/10 Extreme 7 d/yr ≥106°F today · 29 d/yr by 30 yrs out
- Wind 10/10 Extreme 99% chance of damaging wind over 30 yrs
- Air quality 2/10 Low 1 unhealthy d/yr today · 1 by 30 yrs out
Nearby sold comps map
Loading sold comps map…
Walkable amenities ~0.75 mi
Loading nearby amenities…
Taxation est. · year 1
- Rental income
- $25,815
- − Mortgage interest
- −$11,763
- − Property taxes
- −$1,831
- − Insurance
- −$6,169
- − Repairs & maintenance
- −$2,065
- − Management
- −$2,065
- − HOA
- −$468
- − Depreciation
- −$6,109
- Taxable loss
- −$4,655
- Est. tax savings @ 24.0%
- +$1,117
- After-tax cash flow
- $-171/yr
For passive investors: Depreciation is non-cash, so a rental often shows a tax loss while cash-flowing — sheltering income. Rental losses are passive: they offset passive income freely, and up to $25,000/yr can offset ordinary (W-2) income if you actively participate and your MAGI is under $100k (phasing out to $0 by $150k); unused losses carry forward. On sale, claimed depreciation is recaptured at up to 25%, and gains may owe capital-gains tax (a 1031 exchange can defer both). Figures are a year-1 estimate at your 24.0% rate — not tax advice; consult a CPA.
Schools (NCES district)
- District
- Charlotte
- NCES district ID
- 1200240
- Math proficiency
- 54% ▼ -6.00%
- Reading proficiency
- 54% ▼ -1.00%
- Median HH income
- $44,864
- Composite
- 45.62/100
- National rank
- #2586
- State rank
- #22 of 73 in FL
Livability — North Port
- Score
- 75/100
- State rank
- #252
- US rank
- #3975
Category grades
Schools grade is shown separately in the Schools card above.
Census & demographics
- County
- Charlotte County · 196,994 people
- City population
- 75,324
- Metro
- Punta Gorda, FL
- Population (ZIP)
- 15,622
- Household income
- $84,098
- Rent vs Own
- Severe rent burden
- 105.0
Population outlook (Charlotte County) Hauer SSP2
- Today (2025)
- 198,646 people
- By 2030
- 210,507 · +6.0%
- By 2040
- 230,857 · +16.2%
- By 2050
- 247,148 · +24.4%
- By 2075
- 281,777 · +41.8%
- By 2100
- 293,609 · +47.8%
Race, ethnicity, and origin ACS 2023
- Neighborhood character
- Predominantly White (89%)
- Race & ethnicity
- White 89% Two or more races 4% Hispanic / Latino 4% Black 2% Asian 1%
- Common ancestry
- Romanian 4% Lithuanian 3% Italian 2%
- Foreign-born
- 6% · Canada
- Languages at home
- 96% English-only · Spanish 1% German/W. Germanic 1% Tagalog/Filipino 1%
Political lean MEDSL · Charlotte
- 2024 margin
- Solid R (+34.0) · D 32.7% · R 66.7%
- 2008→2024 swing
- -26.7pp toward R · 2008: -7.2pp · 2024: -34.0pp
- All cycles
- 2024: R+34.0 2020: R+26.6 2016: R+27.8 2012: R+14.3 2008: R+7.2
Not yet ingested
- Civics
- —
Market trends
- HPI YoY
- ▼ -28.09%
- Current HPI
- 346.5247
- Rent YoY
- ▲ 5.29%
- Metro
- Punta Gorda, FL
- State GDP YoY
- ▲ 3.28%
- F500 in state
- 36
Industry mix (Fortune 500 HQ in FL)
| Industry | F500 HQs | Revenue |
|---|---|---|
| Industrial Technology | 2 | $29B |
|
||
| Insurance | 2 | $17B |
|
||
| Retail | 1 | $60B |
|
||
| Technology Distribution | 1 | $58B |
|
||
| Homebuilding | 1 | $35B |
|
||
| Technology Manufacturing | 1 | $35B |
|
||
Price history
+392.3% since first listed9 events — show timeline
- 2026-05-02 Price Changed $225,000 Stellar MLS as Distributed by MLS Grid
- 2026-04-28 Price Changed $235,000 Stellar MLS as Distributed by MLS Grid
- 2026-04-24 Price Changed $245,000 Stellar MLS as Distributed by MLS Grid
- 2026-03-10 Price Changed $252,500 Stellar MLS as Distributed by MLS Grid
- 2026-02-12 Price Changed $265,000 Stellar MLS as Distributed by MLS Grid
- 2026-01-15 Price Changed $275,000 Stellar MLS as Distributed by MLS Grid
- 2025-11-14 Listed $285,000 Stellar MLS as Distributed by MLS Grid
- 1991-09-01 Sold (Public Records) $57,500 Public Records
- 1990-02-01 Sold (Public Records) $45,700 Public Records
Property tax history
+3.7%/yrLatest (2025): $1,831 · +12.3% YoY. Source: county tax records.
Cash-flow waterfall
monthlySold comps — $/sqft
last 12 mo · ≤1 miLoading sold comps…