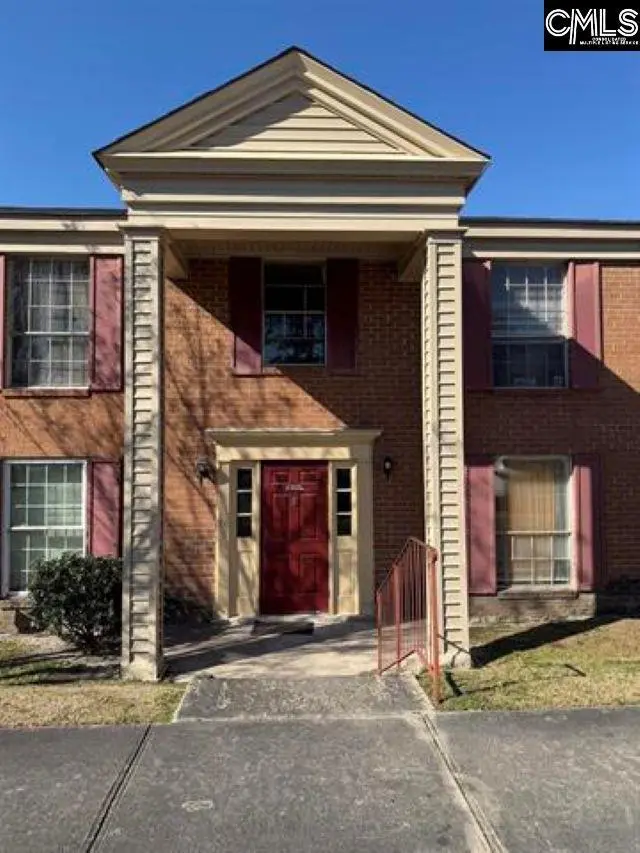
3630 Ranch Rd Unit 16-8 · Forest Acres, SC
Flood risk 1/10 · Minimal
- FEMA flood zone
- X (unshaded)
- Chance of flooding over 30 yrs
- 0.0%
- Est. flood insurance / yr
- $507 – $1,088
Fire risk 3/10 · Minor
- Est. fire insurance / yr
- $783 – $1,453
Heat risk 7/10 · Major
- Hot days now (above 108°F)
- 7 days/yr
- Hot days in 30 yrs
- 16 days/yr
Wind risk 6/10 · Moderate
- Chance of severe wind over 30 yrs
- 67.0%
Air-quality risk 3/10 · Minor
- Unhealthy air days now
- 2 days/yr
- Unhealthy air days in 30 yrs
- 2 days/yr
Risk factors via First Street. Map © Google.
Why this score? — see what drove the C+ grade
The composite is a weighted blend of 9 inputs, each scored 0–100. Each bar is that input's sub-score; the figure is the points it added to the 100-point composite (weight × sub-score).
- Cash flow +23.4/30.0
- 1% rule +10.0/10.0
- DSCR +7.5/10.0
- ARV discount +7.5/15.0
- Rent growth +3.7/5.0
- Livability +3.7/5.0
- Schools +3.6/10.0
- Condition / age +2.5/5.0
- Appreciation +0.0/10.0
$73,000
🖨 Deal sheet 📄 Offer letter ✓ Due diligence
Listing remarks
This condo is an excellent investment property, currently generating $895 per month. Tenant is month to month. With rents below market value, there is room for future rental growth. Key updates include a new roof and dishwasher (2025) and a new HVAC System (2026). Centrally located near Fort Jackson, shopping, and dining, this unit offers an ideal location with seamless interstate access. Additional pictures and videos are available upon request. Disclaimer: CMLS has not reviewed and, therefore, does not endorse vendors who may appear in listings.
Key facts
- Centrally located
- New dishwasher
- New roof
Tags
Property features AI
Finance
- Other: Directions: Enter from Northshore Rd onto Willow Ridge Rd. Drive straight to the end to Building 16. Unit 8 is on the right side on the upper level.
- HOA & community: Association present; Association maintains common areas, exterior, front yard, sidewalks, street lights and green areas
Exterior
- Parking: 2 parking spaces
- Utilities: Public water; Public sewer
- Home design: Single-story unit
- Construction: Slab foundation
- Exterior features: Covered back porch; Paved road access; Brick exterior above foundation
Interior
- Kitchen: Pantry; Solid surface countertops; Painted cabinets; Luxury vinyl plank flooring; Dishwasher; Refrigerator; Free-standing range
- Bedrooms: Main-level master bedroom with private bath, tub/shower, ceiling fan and private closet; Main-level second bedroom with shared bath, ceiling fan, private closet and engineered hardwood floors
- Flooring: Engineered hardwood in great room, formal dining and bedroom 2; Luxury vinyl plank in kitchen
- Bathrooms: Two full bathrooms
- Heating & cooling: Central heating; Central air conditioning
- Interior features: Great room with engineered hardwood floors; Formal dining room with engineered hardwood floors; Cable TV available
- Laundry & utility: Main-level utility room (unheated) for laundry
Neighborhood map
What this means for you Summary
Snapshot
- This is a 2-bed/2.0-bath condo listed at $73k.
Deal economics
- At list price, monthly cash flow is $134 ($2k/yr) — positive.
- The deal already cash-flows at list — no discount required.
- Meets the 1% rule at list price ($1k rent vs $73k).
- Recommended offer: $72k (1.5% below list) — sets the bar for market timing.
Location & tenants
- Location reads 73/100 on livability (#39 in SC) — a middle-class / working-renter tenant base. Strengths: housing A+, cost of living A, employment A-; Watch: crime D, amenities F, commute F.
- Richland 02 (suburban): math 35% / reading 47% proficiency, ranked #29 of 80 in SC (top 36%) — families likely to look elsewhere, expect single-tenant / working-renter base with shorter leases.
- Zoned schools: Forest Lake Elementary (math 42% / reading 46%, grade F, #239 of 597 statewide, top 41%, 614 students, 70% FRL) — zoned schools average 70% FRL vs 38% district-wide (32 pts higher); higher-poverty schools than district average — tighter screening recommended.
- Market conditions: Rents rising fast (+4.8%/yr); 114 active listings in the ZIP; 19 comparable units currently listed for rent nearby; rentals at typical pace (median 23d on market — plan ~3-4 weeks tenant-placement turnaround); solid renter incomes; 3,472 units permitted in Richland County in 2024 (1,096 in 5+ unit buildings).
- This rent is only 17% of the median local income ($92k/yr) — well below the 30% rent-burden line; pricing power to push rent on renewal without tenant pushback.
Forward outlook
- Local home prices are declining (-3.0%/yr); year-one equity from $505 of loan paydown is wiped out by about $2k of value loss. Plan a longer hold.
- Richland County population projected at +30% by 2050 — long-run rental-demand tailwind backs the buy-and-hold thesis.
- At projected returns (-3.0% appreciation + 4.8% rent growth), your $20k cash investment doubles in ~9 years — after that, you're playing with house money.
Negotiation context
- It's been on market 28 days — a 2% lower offer ($72k) is reasonable based on typical stale-listing flexibility.
- 4 sale attempts since 6y ago with the ask held roughly flat each time — persistent listings suggest the price (not the market) is what's stuck; bring a comps-based counter.
Risks & watch-outs
- Watch-outs: property tax is 3.5% of price; HOA is 21% of rent.
- Climate carrying-cost: major wind risk, 67% chance of damaging wind over 30y; extreme-heat days projected 7→16/yr by 2055 (HVAC capex compounding) — expect insurance premiums to compound above CPI over the hold.
Questions for the listing agent
- Built in 1971 — when were the roof, HVAC, electrical panel, plumbing, and water heater last replaced?
- Property tax is high relative to price — has the assessment been appealed recently, and will the sale trigger a re-assessment?
- What does the HOA fee cover, when was the last increase, and are there any pending special assessments or reserve-fund shortfalls?
- Any open or pending special assessments — roof, HVAC, plumbing, elevator, façade? What's the per-unit balance and payoff schedule, and is the seller paying it off at close or rolling it to the buyer?
- Is there a deadline driving the sale (1031 exchange, divorce, estate, relocation)? That informs how much negotiation room exists.
- Schools are A-rated — typically a magnet for longer-tenancy family renters. What's the average tenant stay here, and is there a school-zone premium baked into asking?
- Crime grade is D in this area — have there been break-ins, vandalism, or insurance claims at this property in the last 3 years? What carrier currently insures it and at what premium?
- What's the average days-on-market for RENTAL listings here right now (not sales)? A rising rental-DOM trend means longer vacancies and softer asking-rent achievability than the comps imply.
- What's the recent tenant-quality profile in this submarket — average credit score on applications, eviction rate, late-payment / NSF rate, and stable-employment percentage? A property-management company in the area should have these aggregated.
- How much new apartment / multifamily construction is in the pipeline within 1–3 miles? Heavy new supply (>2% of stock underway) typically softens rents 12–24 months out; light construction supports rent growth.
Investment metrics
- 1% rule
- 1.80% ✓
- Cap rate
- 8.50%
- Cash-on-cash
- 7.89%
- DSCR
- 1.35
- GRM
- 4.6
CMA / ARV
No comps found within radius.
Projected returns pro-forma
-3.0% appreciation · 4.8% rent growth · sell at horizon
- IRR
- -0.7%
- Equity multiple
- 0.97×
- Total profit
- $-590
- Equity at exit
- $10,885
- IRR
- 11.9%
- Equity multiple
- 2.07×
- Total profit
- $21,865
- Equity at exit
- $6,312
Cash invested: $20,440 (down + closing). Projections, not guarantees.
Landlord ↔ Tenant lean methodology
- Overall (STATE)
- 90 Strongly Landlord-Friendly
- State South Carolina
- 90 Strongly Landlord-Friendly · R+6
- County
- — inherits STATE
- City
- — inherits STATE
ZIP-level market 29206
- Rents YoY
- 4.8%
- Active inventory
- 114
- Price-to-rent
- 4.6×
Monthly cashflow live
- Estimated rent
- $1,311 high interval (Pro) →
- Mortgage (P&I)
- −$383
- Tax from tax record
- −$213 /mo · $2,555/yr
- Insurance
- −$30
- HOA
- −$275
- Vacancy / Maint / Mgmt
- −$275
- Net cashflow
- $134
Break-even live
UW: 25.0% down · 7.5% · 30yr · 1.5% tax · 5.0% vac · 8.0% maint · 8.0% mgmt
Financing live
Cash to close
- Down payment
- $18,250
- Closing costs
- $2,190
- Reserves months
- —
- Total cash needed
- —
Loan-product check · same deal, 3 products live
Conventional
25% down · 7.5% · 30yr
- Down + closing
- —
- Monthly P&I
- —
- Monthly cashflow
- —
- DSCR
- —
- Eligible?
- —
Personal DTI + credit; lowest rate.
DSCR
20% down · 8.5% · 30yr
- Down + closing
- —
- Monthly P&I
- —
- Monthly cashflow
- —
- DSCR
- —
- Eligible?
- —
No personal income docs; deal must DSCR.
Hard money
10% down · 12.0% · 12mo
- Down + closing
- —
- Monthly P&I
- —
- Monthly cashflow
- —
- DSCR
- —
- Eligible?
- —
Short-term bridge; refi at stabilization.
Rent comps 19 comps
| Address | Beds | Baths | Sqft | Rent | $/sqft | DOM | Units | Dist |
|---|---|---|---|---|---|---|---|---|
| 3630 Ranch Rd Unit 3-8 Columbia, SC | 2.0 | 2.0 | 1400 | $1,250 | $0.89 | 23d | 1 | 0.03mi |
| 3611 Ranch Rd Columbia, SC | 2.0–3.0 | 2.0 | 1400 | $1,250 | $0.89 | 3d | 3 | 0.10mi |
| 1930 Greenoaks Rd Unit A Columbia, SC | 2.0 | 1.5 | 900 | $1,175 | $1.31 | 11d | 1 | 0.46mi |
| 1633 Overhill Rd Columbia, SC | 3.0 | 1.5 | 1052 | $1,661 | $1.58 | 23d | 1 | 0.55mi |
| 2102 Long Shadow Ln Columbia, SC | 2.0 | 1.5 | 1150 | $1,300 | $1.13 | 3d | 1 | 0.61mi |
| 3509 Lake Ave Columbia, SC | 1.0–3.0 | 1.0–2.0 | 1195 | $1,245 | $1.04 | 2d | 23 | 0.63mi |
| 1741 Springfield Ave Columbia, SC | 3.0 | 1.0 | 1582 | $930 | $0.59 | 11d | 1 | 0.76mi |
| 1630 Edgemore Rd Unit 1 Columbia, SC | 3.0 | 2.0 | 1225 | $1,650 | $1.35 | 23d | 1 | 0.76mi |
| 7006 Brookfield Rd Columbia, SC | 1.0–3.0 | 1.0–2.0 | 1090 | $1,122 | $1.03 | 11d | 7 | 0.81mi |
| 308 Percival Rd Columbia, SC | 3.0 | 2.5 | 1360 | $1,395 | $1.03 | 23d | 1 | 1.07mi |
| 202 Partridge Dr Columbia, SC | 3.0 | 2.0 | 1500 | $1,850 | $1.23 | 14d | 1 | 1.09mi |
| 7501 Brookfield Rd Columbia, SC | 1.0–3.0 | 1.0–2.5 | 1097 | $1,074 | $0.98 | 23d | 1 | 1.10mi |
| 300 Meredith Sq Columbia, SC | 2.0–3.0 | 2.0–2.5 | 1258 | $1,299 | $1.03 | 23d | 1 | 1.17mi |
| 6905 Cleaton Rd Columbia, SC | 3.0 | 2.5–3.0 | 1546 | $1,925 | $1.25 | 23d | 3 | 1.27mi |
| 7502 Hunt Club Rd Columbia, SC | 1.0–3.0 | 1.0–2.0 | 875 | $1,292 | $1.48 | 23d | 1 | 1.31mi |
| 7502 Hunt Club Rd Columbia, SC | 1.0–2.0 | 1.0–2.0 | 825 | $1,305 | $1.58 | 3d | 22 | 1.31mi |
| 7400 Hunt Club Rd Columbia, SC | 1.0–3.0 | 1.0–2.0 | 1087 | $1,040 | $0.96 | 23d | 1 | 1.32mi |
| 7602 Hunt Club Rd Columbia, SC | 1.0–2.0 | 1.0–2.5 | 950 | $1,295 | $1.36 | 23d | 2 | 1.32mi |
| 7602 Hunt Club Rd Unit I-104 Columbia, SC | 2.0 | 2.5 | 1200 | $1,295 | $1.08 | 18d | 1 | 1.33mi |
HOA detail condo
- Monthly dues
- $275 · $3,300/yr
- Assessments
- None detected in remarks — confirm with the listing agent.
Listing history 29 events
-
2026-06-18days on market $73,000 Active 28 DOM
-
2026-06-17days on market $73,000 Active 27 DOM
-
2026-06-16days on market $73,000 Active 26 DOM
-
2026-06-15days on market $73,000 Active 25 DOM
-
2026-06-14days on market $73,000 Active 23 DOM
-
2026-06-13days on market $73,000 Active 22 DOM
-
2026-06-10days on market $73,000 Active 20 DOM
-
2026-06-09days on market $73,000 Active 19 DOM
-
2026-06-08days on market $73,000 Active 18 DOM
-
2026-06-07days on market $73,000 Active 17 DOM
-
2026-06-05days on market $73,000 Active 14 DOM
-
2026-06-03days on market $73,000 Active 13 DOM
-
2026-06-03days on market $73,000 Active 12 DOM
-
2026-06-01days on market $73,000 Active 11 DOM
-
2026-05-31days on market $73,000 Active 10 DOM
-
2026-05-21$73,000 Active
-
2026-04-18status Pending
-
2026-04-03historical Active - Contingent
-
2026-03-28price $75,000
-
2026-02-06$79,000 Active
-
2024-04-10historical $1,095
-
2024-04-02price $1,095
-
2024-03-24price $1,195
-
2024-03-13$1,295
-
2023-09-08soldstatus $79,000
-
2020-09-08soldstatus $30,000
-
2020-08-19historical
-
2020-07-01$30,000 Active
-
1982-09-01soldstatus $50,000
ⓘ Source: listings_history table (triggers on properties + properties_extension) + one-shot
backfill from property_details.listing_events for pre-trigger history.
Tax reassessment forecast SC · Resets to sale price
- Current annual tax
- $2,555 · $213/mo
- Projected year-2 tax
- $2,555 · $213/mo
- Expected delta
- $0/yr ($0/mo · 0.0%)
ⓘ Screening estimate from a state-policy table — verify with the county assessor before closing.
Climate risk First Street
- Flood 1/10 Low FEMA zone X (unshaded) · 0% chance over 30 yrs
- Wildfire 3/10 Moderate
- Heat 7/10 Severe 7 d/yr ≥108°F today · 16 d/yr by 30 yrs out
- Wind 6/10 Major 67% chance of damaging wind over 30 yrs
- Air quality 3/10 Moderate 2 unhealthy d/yr today · 2 by 30 yrs out
Nearby sold comps map
Loading sold comps map…
Walkable amenities ~0.75 mi
Loading nearby amenities…
Taxation est. · year 1
- Rental income
- $15,730
- − Mortgage interest
- −$4,089
- − Property taxes
- −$2,555
- − Insurance
- −$365
- − Repairs & maintenance
- −$1,258
- − Management
- −$1,258
- − HOA
- −$3,300
- − Depreciation
- −$2,124
- Taxable income
- $780
- Est. tax owed @ 24.0%
- −$187
- After-tax cash flow
- $1,425/yr
For passive investors: Depreciation is non-cash, so a rental often shows a tax loss while cash-flowing — sheltering income. Rental losses are passive: they offset passive income freely, and up to $25,000/yr can offset ordinary (W-2) income if you actively participate and your MAGI is under $100k (phasing out to $0 by $150k); unused losses carry forward. On sale, claimed depreciation is recaptured at up to 25%, and gains may owe capital-gains tax (a 1031 exchange can defer both). Figures are a year-1 estimate at your 24.0% rate — not tax advice; consult a CPA.
Schools (NCES district)
- District
- Richland 02
- NCES district ID
- 4503390
- Math proficiency
- 35% ▼ -15.00%
- Reading proficiency
- 47% ▼ -5.00%
- Median HH income
- $59,684
- Composite
- 36.2/100
- National rank
- #4730
- State rank
- #29 of 80 in SC
Livability — Forest Acres
- Score
- 73/100
- State rank
- #39
- US rank
- #5064
Category grades
Schools grade is shown separately in the Schools card above.
Census & demographics
- County
- Richland County · 389,530 people
- City population
- 20,054
- Metro
- Columbia, SC
- Population (ZIP)
- 19,759
- Household income
- $91,847
- Rent vs Own
- Severe rent burden
- 697.0
Population outlook (Richland County) Hauer SSP2
- Today (2025)
- 459,667 people
- By 2030
- 487,524 · +6.1%
- By 2040
- 542,035 · +17.9%
- By 2050
- 595,371 · +29.5%
- By 2075
- 732,998 · +59.5%
- By 2100
- 820,415 · +78.5%
Race, ethnicity, and origin ACS 2023
- Neighborhood character
- Predominantly White (74%)
- Race & ethnicity
- White 74% Black 14% Two or more races 6% Hispanic / Latino 5% Asian 1%
- Common ancestry
- Italian 5% Serbian 4% Slovak 4%
- Foreign-born
- 3% · Canada, Guatemala, South Korea
- Languages at home
- 97% English-only · Spanish 1% Other Indo-European 1%
Political lean MEDSL · Richland
- 2024 margin
- Solid D (+34.6) · D 66.4% · R 31.8% · Other 1.8%
- 2008→2024 swing
- +5.7pp toward D · 2008: 28.9pp · 2024: 34.6pp
- All cycles
- 2024: D+34.6 2020: D+38.3 2016: D+32.9 2012: D+33.3 2008: D+28.9
Not yet ingested
- Civics
- —
Market trends
- HPI YoY
- ▼ -325.76%
- Current HPI
- 224.5418
- Rent YoY
- ▲ 4.80%
- Metro
- Columbia, SC
- State GDP YoY
- ▲ 4.51%
- F500 in state
- 2
Industry mix (Fortune 500 HQ in SC)
| Industry | F500 HQs | Revenue |
|---|---|---|
| Packaging | 1 | $7B |
|
||
Price history
+46.0% since first listed14 events — show timeline
- 2026-05-21 Listed $73,000 Consolidated MLS
- 2026-04-18 Pending — Consolidated MLS
- 2026-04-03 Contingent — Consolidated MLS
- 2026-03-28 Price Changed $75,000 Consolidated MLS
- 2026-02-06 Listed $79,000 Consolidated MLS
- 2024-04-10 Rental Removed $1,095 APPFOLIO
- 2024-04-02 Price Changed $1,095 APPFOLIO
- 2024-03-24 Price Changed $1,195 APPFOLIO
- 2024-03-13 Listed for Rent $1,295 APPFOLIO
- 2023-09-08 Sold (Public Records) $79,000 Public Records
- 2020-09-08 Sold (Public Records) $30,000 Public Records
- 2020-08-19 Delisted — Consolidated MLS
- 2020-07-01 Listed $30,000 Consolidated MLS
- 1982-09-01 Sold (Public Records) $50,000 Public Records
Property tax history
+10.5%/yrLatest (2025): $2,555 · +2.1% YoY. Source: county tax records.
Cash-flow waterfall
monthlySold comps — $/sqft
last 12 mo · ≤1 miLoading sold comps…