 Duplex
1806 / 1808 SW 15th Pl · Cape Coral, FL
Flood risk 7/10 · Major
- FEMA flood zone
- X (shaded)
- Chance of flooding over 30 yrs
- 0.76%
- Est. flood insurance / yr
- $507 – $1,088
Fire risk 1/10 · Minimal
- Est. fire insurance / yr
- $947 – $1,759
Heat risk 10/10 · Severe
- Hot days now (above 107°F)
- 7 days/yr
- Hot days in 30 yrs
- 27 days/yr
Wind risk 10/10 · Severe
- Chance of severe wind over 30 yrs
- 99.0%
Air-quality risk 2/10 · Minimal
- Unhealthy air days now
- 1 days/yr
- Unhealthy air days in 30 yrs
- 1 days/yr
Risk factors via First Street. Map © Google.
Why this score? — see what drove the C grade
The composite is a weighted blend of 9 inputs, each scored 0–100. Each bar is that input's sub-score; the figure is the points it added to the 100-point composite (weight × sub-score).
- Cash flow +22.8/30.0
- ARV discount +7.5/15.0
- DSCR +7.3/10.0
- 1% rule +5.9/10.0
- Schools +4.1/10.0
- Livability +3.9/5.0
- Condition / age +3.8/5.0
- Rent growth +0.4/5.0
- Appreciation +0.0/10.0
$339,000
🖨 Deal sheet 📄 Offer letter ✓ Due diligence
Multi-family units
County records classify this as Multi-Family (2-4 Unit). Listing-text estimate: 2 units. confirmed
Listing remarks
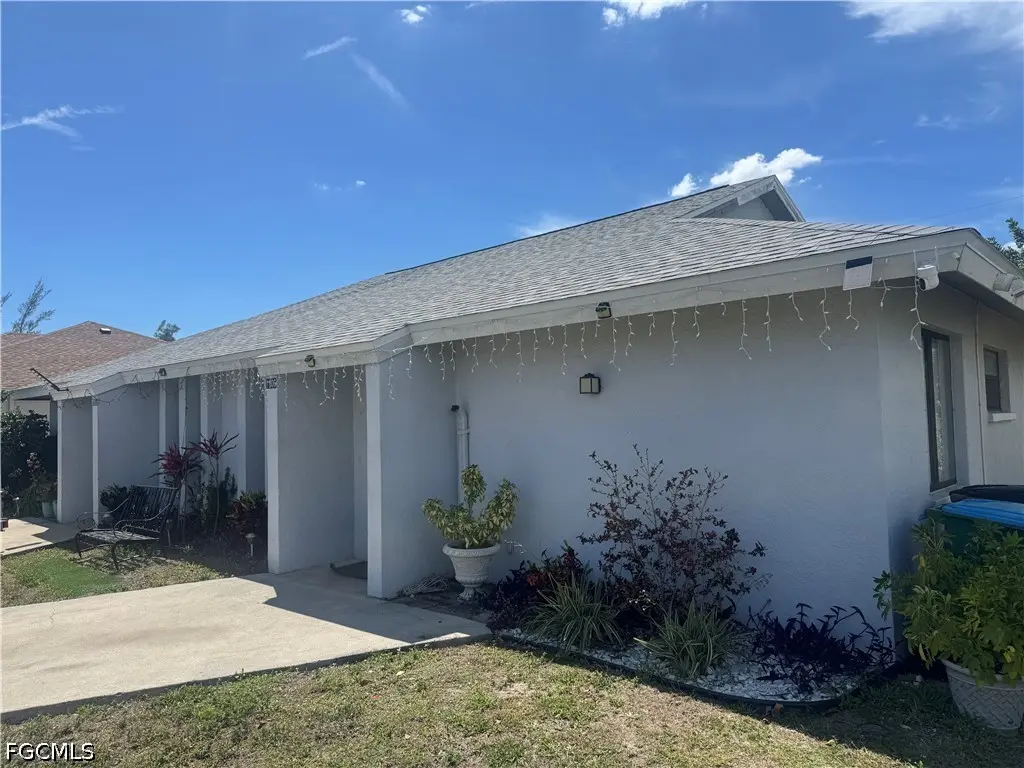
Investors, take notice! This exceptionally maintained duplex at 1806 SW 15th Place offers a seamless "buy and hold" opportunity in one of Cape Coral’s most desirable areas. This property is a true turnkey investment with a reliable lease already in place, providing immediate cash flow from day one. The property features a newer roof 2022, significantly reducing future capital expenditure and providing peace of mind for years to come. Situated in a quiet, safe neighborhood in deep Southwest Cape Coral, this duplex is perfectly positioned across from a beautiful local church and just minutes from essential amenities including Publix, Walmart, and various dining and shopping ce
Key facts
- Newer roof
- Fenced backyard
- 0.24 acre lot
Tags
Property features AI
Finance
- Other: Irrigation available at extra cost
- Financial info: Gross scheduled income: $32,400; Operating expenses: $2,000; Tenant pays electricity and water; Pets allowed
- HOA & community: Non-gated community; No association fee
Exterior
- Utilities: Public water (assessment unpaid); Sewer assessment unpaid; Cable available
- Home design: Single-story property; Resale condition; Zoned C
- Construction: Concrete and stucco construction; Shingle roof
- Exterior features: Room for a pool; Rectangular lot with dimensions approximately 80 x 125 x 80 x 125
Interior
- Flooring: Concrete
- Bathrooms: 2 full bathrooms
- Heating & cooling: Central electric heating
- Interior features: Concrete flooring
Neighborhood map
What this means for you Summary
Snapshot
- This is a 2 × 2-bed/1.0-bath units multifamily listed at $339k. Condition is rated good.
Deal economics
- At list price, monthly cash flow is $521 ($6k/yr) — positive. Per door: $260/mo.
- The deal already cash-flows at list — no discount required.
- Meets the 1% rule at list price ($4k rent vs $339k).
- Recommended offer: $329k (3.0% below list) — sets the bar for market timing.
- Cap rate 8.4% vs local median 3.1% in Cape Coral — top-decile yield for the area; either an underpriced asset or a hidden risk that comps aren't pricing in. Stress-test before assuming the spread holds.
Location & tenants
- Location reads 77/100 on livability (#208 in FL, #3,098 nationally) — a middle-class / working-renter tenant base. Strengths: housing A+, health & safety A+, amenities B+; Watch: commute F.
- Lee (suburban): math 47% / reading 50% proficiency, ranked #42 of 73 in FL (top 58%) — families likely to look elsewhere, expect single-tenant / working-renter base with shorter leases.
- Market conditions: Rents falling (-8.6%/yr); 686 active listings in the ZIP; 40 comparable units currently listed for rent nearby; rentals at typical pace (median 20d on market — plan ~3-4 weeks tenant-placement turnaround); solid renter incomes; 15,411 units permitted in Lee County in 2024 (4,686 in 5+ unit buildings).
- At $3,709/mo this rent would consume 53% of the median local household income ($84k/yr) (locally 760% of renters already pay >50% of income on rent) — very limited rent-growth headroom before tenants either downsize or default.
Forward outlook
- Local home prices are declining (-3.0%/yr); year-one equity from $2k of loan paydown is wiped out by about $10k of value loss. Plan a longer hold.
- Lee County population projected at +44% by 2050 — long-run rental-demand tailwind backs the buy-and-hold thesis.
Negotiation context
- It's been on market 43 days — a 3% lower offer ($329k) is reasonable based on typical stale-listing flexibility.
- 2 sale attempts since 7y ago with the ask held roughly flat each time — persistent listings suggest the price (not the market) is what's stuck; bring a comps-based counter.
Risks & watch-outs
- Watch-outs: flood insurance adds $66/mo.
- Climate carrying-cost: major flood risk; severe wind risk, 99% chance of damaging wind over 30y; extreme-heat days projected 7→27/yr by 2055 (HVAC capex compounding) — expect insurance premiums to compound above CPI over the hold.
Questions for the listing agent
- It's been on market 43 days. Have you received any prior offers? Is the seller open to a 3% concession, seller financing, or rate buy-down credit?
- Can we see the unit-by-unit rent roll, current vacancy, and any below-market leases? What's the average tenancy length?
- What capital expenditures (roof, boiler, parking lot, exteriors) have been made in the last 5 years, and what's planned in the next 2?
- What's the actual annual flood-insurance premium (NFIP or private), and is the property in a SFHA with mandatory coverage?
- Is there a deadline driving the sale (1031 exchange, divorce, estate, relocation)? That informs how much negotiation room exists.
- Schools are B-rated — typically a magnet for longer-tenancy family renters. What's the average tenant stay here, and is there a school-zone premium baked into asking?
- What's the average days-on-market for RENTAL listings here right now (not sales)? A rising rental-DOM trend means longer vacancies and softer asking-rent achievability than the comps imply.
- What's the recent tenant-quality profile in this submarket — average credit score on applications, eviction rate, late-payment / NSF rate, and stable-employment percentage? A property-management company in the area should have these aggregated.
- How much new apartment / multifamily construction is in the pipeline within 1–3 miles? Heavy new supply (>2% of stock underway) typically softens rents 12–24 months out; light construction supports rent growth.
Investment metrics
- 1% rule
- 1.09% ✓
- Cap rate
- 8.37%
- Cash-on-cash
- 7.43%
- DSCR
- 1.33
- GRM
- 7.6
CMA / ARV
No comps found within radius.
Projected returns pro-forma
-3.0% appreciation · 0.0% rent growth · sell at horizon
- IRR
- -9.7%
- Equity multiple
- 0.66×
- Total profit
- $-32,529
- Equity at exit
- $50,546
- IRR
- -5.1%
- Equity multiple
- 0.71×
- Total profit
- $-27,219
- Equity at exit
- $29,311
Cash invested: $94,920 (down + closing). Projections, not guarantees.
Landlord ↔ Tenant lean methodology
- Overall (STATE)
- 87 Strongly Landlord-Friendly
- State Florida
- 87 Strongly Landlord-Friendly · R+3
- County
- — inherits STATE
- City
- — inherits STATE
ZIP-level market 33991
- Home prices YoY
- -27.8%
- Rents YoY
- -8.6%
- Active inventory
- 686
- Price-to-rent
- 15.2×
Monthly cashflow live
- Estimated rent
- $3,709 high interval (Pro) →
- Mortgage (P&I)
- −$1,778
- Tax est. 1.5%
- −$424 /mo · $5,085/yr
- Insurance
- −$141
- Flood insurance flood zone
- −$66 /mo · $798/yr
- HOA
- −$0
- Vacancy / Maint / Mgmt
- −$779
- Net cashflow
- $521
Break-even live
2-unit breakdown (identical units grouped — click to expand)
| Units | Beds | Baths | Est. rent |
|---|---|---|---|
| 2× units | 2 | 1 | $3,710 |
| #1 | 2 | 1 | $1,855 |
| #2 | 2 | 1 | $1,855 |
| Total (2 units) | $3,709 | ||
UW: 25.0% down · 7.5% · 30yr · 1.5% tax · 5.0% vac · 8.0% maint · 8.0% mgmt
Financing live
Cash to close
- Down payment
- $84,750
- Closing costs
- $10,170
- Reserves months
- —
- Total cash needed
- —
Loan-product check · same deal, 3 products live
Conventional
25% down · 7.5% · 30yr
- Down + closing
- —
- Monthly P&I
- —
- Monthly cashflow
- —
- DSCR
- —
- Eligible?
- —
Personal DTI + credit; lowest rate.
DSCR
20% down · 8.5% · 30yr
- Down + closing
- —
- Monthly P&I
- —
- Monthly cashflow
- —
- DSCR
- —
- Eligible?
- —
No personal income docs; deal must DSCR.
Hard money
10% down · 12.0% · 12mo
- Down + closing
- —
- Monthly P&I
- —
- Monthly cashflow
- —
- DSCR
- —
- Eligible?
- —
Short-term bridge; refi at stabilization.
Rent comps 40 comps
| Address | Beds | Baths | Sqft | Rent | $/sqft | DOM | Units | Dist |
|---|---|---|---|---|---|---|---|---|
| 1715 Chiquita Blvd S Cape Coral, FL | 5.0 | 3.0 | 2207 | $3,500 | $1.59 | 23d | 1 | 0.08mi |
| 1916 SW 15th Pl Cape Coral, FL | 3.0 | 2.0 | 1200 | $1,549 | $1.29 | 19d | 1 | 0.17mi |
| 1622 SW 16th Ct Cape Coral, FL | 3.0 | 2.0 | 1789 | $2,200 | $1.23 | 23d | 1 | 0.24mi |
| 1407 SW 16th Ter #201 Cape Coral, FL | 3.0 | 2.0 | 1186 | $1,000 | $0.84 | 23d | 1 | 0.25mi |
| 1704 SW 17th Ave Cape Coral, FL | 3.0 | 3.0 | 2140 | $8,000 | $3.74 | 23d | 1 | 0.27mi |
| 2005 Chiquita Blvd S Cape Coral, FL | 3.0 | 2.0 | 1200 | $1,600 | $1.33 | 3d | 1 | 0.30mi |
| 1314 Trafalgar Pkwy Cape Coral, FL | 3.0 | 2.0 | 1209 | $1,550 | $1.28 | 16d | 1 | 0.31mi |
| 1314 Trafalgar Pkwy Cape Coral, FL | 3.0 | 2.0 | 1209 | $1,525 | $1.26 | 3d | 1 | 0.31mi |
| 1405 SW Trafalgar Pkwy Cape Coral, FL | 4.0 | 2.5 | 2100 | $2,395 | $1.14 | 3d | 1 | 0.31mi |
| 1228 Trafalgar Pkwy Unit 1228 Cape Coral, FL | 3.0 | 2.0 | 1623 | $1,500 | $0.92 | 23d | 1 | 0.34mi |
| 1206 SW Trafalgar Pkwy Cape Coral, FL | 3.0 | 2.0 | 1522 | $2,150 | $1.41 | 23d | 1 | 0.40mi |
| 1710 SW 10th Pl Cape Coral, FL | 3.0 | 2.0 | 1993 | $1,999 | $1.00 | 14d | 1 | 0.56mi |
| 1713 SW 10th Pl Cape Coral, FL | 3.0 | 2.0 | 1704 | $1,850 | $1.09 | 23d | 1 | 0.59mi |
| 1726 SW 22nd St Cape Coral, FL | 3.0 | 2.0 | 1283 | $1,920 | $1.50 | 3d | 1 | 0.63mi |
| 1815 SW 22nd St Cape Coral, FL | 4.0 | 2.0 | 1845 | $4,095 | $2.22 | 23d | 1 | 0.65mi |
| 1409 SW 11th Pl Cape Coral, FL | 4.0 | 2.0 | 1499 | $1,790 | $1.19 | 21d | 1 | 0.68mi |
| 1408 SW 23rd St Cape Coral, FL | 3.0 | 2.5 | 1901 | $3,500 | $1.84 | 14d | 1 | 0.72mi |
| 1817 SW 22nd Ln Cape Coral, FL | 4.0 | 3.0 | 3000 | $3,100 | $1.03 | 21d | 1 | 0.74mi |
| 1229 SW 18th Ave Cape Coral, FL | 3.0 | 2.0 | 1993 | $2,141 | $1.07 | 3d | 1 | 0.76mi |
| 1110 SW 15th Ave Cape Coral, FL | 3.0 | 2.0 | 2371 | $2,495 | $1.05 | 3d | 1 | 0.78mi |
| 1633 SW 12th Ter Cape Coral, FL | 4.0 | 2.0 | 1828 | $1,950 | $1.07 | 3d | 1 | 0.79mi |
| 1912 SW 13th St Cape Coral, FL | 3.0 | 3.0 | 1931 | $3,125 | $1.62 | 23d | 1 | 0.81mi |
| 2054 Willow Branch Dr Cape Coral, FL | 3.0 | 2.5 | 2523 | $2,850 | $1.13 | 23d | 1 | 0.84mi |
| 2305 SW 19th Pl Cape Coral, FL | 3.0 | 2.0 | 1521 | $4,975 | $3.27 | 23d | 1 | 0.84mi |
| 1915 SW 13th St Cape Coral, FL | 3.0 | 2.0 | 1557 | $1,900 | $1.22 | 23d | 1 | 0.85mi |
| 1817 SW 12th Ln Cape Coral, FL | 4.0 | 2.0 | 1898 | $2,275 | $1.20 | 3d | 1 | 0.85mi |
| 902 SW 21st Ln Cape Coral, FL | 3.0 | 2.0 | 1656 | $1,795 | $1.08 | 11d | 1 | 0.86mi |
| 1137 SW 18th Ct Cape Coral, FL | 4.0 | 3.0 | 1918 | $8,785 | $4.58 | 23d | 1 | 0.90mi |
| 1510 SW 8th Pl Cape Coral, FL | 3.0 | 2.0 | 1524 | $2,400 | $1.57 | 2d | 1 | 0.90mi |
| 2112 SW 8th Pl Cape Coral, FL | 3.0 | 2.0 | 1580 | $2,100 | $1.33 | 23d | 1 | 0.95mi |
| 1218 SW 9th Ct Cape Coral, FL | 3.0 | 2.0 | 1476 | $2,850 | $1.93 | 2d | 1 | 0.96mi |
| 1218 SW 9th Ct Cape Coral, FL | 3.0 | 2.0 | 1476 | $2,850 | $1.93 | 3d | 1 | 0.96mi |
| 1409 SW 10th St Cape Coral, FL | 3.0 | 2.0 | 1412 | $1,750 | $1.24 | 23d | 1 | 0.97mi |
| 1627 SW 25th Ln Cape Coral, FL | 4.0 | 2.0 | 1828 | $1,861 | $1.02 | 3d | 1 | 0.97mi |
| 2100 SW 12th Ter Cape Coral, FL | 4.0 | 2.0 | 1951 | $2,631 | $1.35 | 3d | 1 | 0.98mi |
| 1825 SW 25th St Cape Coral, FL | 3.0 | 2.0 | 1785 | $1,950 | $1.09 | 3d | 1 | 0.98mi |
| 1833 SW 11th Ter Cape Coral, FL | 4.0 | 2.0 | 1838 | $8,000 | $4.35 | 23d | 1 | 1.01mi |
| 916 SW 24th St Cape Coral, FL | 4.0 | 2.0 | 2260 | $2,749 | $1.22 | 23d | 1 | 1.04mi |
| 2200 Oasis Palm Cir Cape Coral, FL | 1.0–3.0 | 1.0–2.0 | 1076 | $1,919 | $1.78 | 2d | 19 | 1.10mi |
| 2427 Woodbourne Pl Cape Coral, FL | 3.0 | 2.0 | 1507 | $2,300 | $1.53 | 16d | 1 | 1.10mi |
Listing history 6 events
-
2026-05-07status Pending
-
2026-04-20price $339,000
-
2026-03-24$349,000 Active
-
2019-08-16historical
-
2019-08-05price $177,000
-
2019-03-18$189,000 Active
ⓘ Source: listings_history table (triggers on properties + properties_extension) + one-shot
backfill from property_details.listing_events for pre-trigger history.
Climate risk First Street
- Flood 7/10 Severe FEMA zone X (shaded) · 76% chance over 30 yrs
- Wildfire 1/10 Low
- Heat 10/10 Extreme 7 d/yr ≥107°F today · 27 d/yr by 30 yrs out
- Wind 10/10 Extreme 99% chance of damaging wind over 30 yrs
- Air quality 2/10 Low 1 unhealthy d/yr today · 1 by 30 yrs out
Nearby sold comps map
Loading sold comps map…
Walkable amenities ~0.75 mi
Loading nearby amenities…
Taxation est. · year 1
- Rental income
- $44,508
- − Mortgage interest
- −$18,989
- − Property taxes
- −$5,085
- − Insurance
- −$2,492
- − Repairs & maintenance
- −$3,561
- − Management
- −$3,561
- − Depreciation
- −$9,862
- Taxable income
- $958
- Est. tax owed @ 24.0%
- −$230
- After-tax cash flow
- $6,021/yr
For passive investors: Depreciation is non-cash, so a rental often shows a tax loss while cash-flowing — sheltering income. Rental losses are passive: they offset passive income freely, and up to $25,000/yr can offset ordinary (W-2) income if you actively participate and your MAGI is under $100k (phasing out to $0 by $150k); unused losses carry forward. On sale, claimed depreciation is recaptured at up to 25%, and gains may owe capital-gains tax (a 1031 exchange can defer both). Figures are a year-1 estimate at your 24.0% rate — not tax advice; consult a CPA.
Condition & rehab AI · 8 photos
This well-maintained duplex is in good condition with some minor repairs and maintenance needed. It offers a seamless 'buy and hold' opportunity in a desirable area.
Repairs flagged
- Minor Kitchen cabinets — The kitchen cabinets appear to be in good condition, with no visible damage or wear.
- Minor Bathroom fixtures — The bathroom fixtures appear to be in good condition, with no visible damage or wear.
- Minor Landscaping — The landscaping appears to be in average condition, with some overgrown areas visible.
Value-add opportunities
- Resale Paint interior walls — Painting interior walls can improve the home's appearance and make it more appealing to potential buyers.
- Resale Replace kitchen cabinets — Replacing old kitchen cabinets can improve the home's appearance and make it more appealing to potential buyers.
- Resale Replace bathroom fixtures — Replacing old bathroom fixtures can improve the home's appearance and make it more appealing to potential buyers.
- Rental Landscaping maintenance — Maintaining the landscaping can improve the home's curb appeal and make it more attractive to potential renters.
Renovation cost estimate screening
| Repair item | Severity | Est. cost |
|---|---|---|
| Kitchen cabinets · The kitchen cabinets appear to be in good condition, with no visible damage or wear. | Minor | $500–3,000 |
| Bathroom fixtures · The bathroom fixtures appear to be in good condition, with no visible damage or wear. | Minor | $500–3,000 |
| Landscaping · The landscaping appears to be in average condition, with some overgrown areas visible. | Minor | $500–3,000 |
| Total estimated repair cost · 3 items | $1,500–9,000 |
Value-add ROI direction
- Resale Paint interior walls — Painting interior walls can improve the home's appearance and make it more appealing to potential buyers. ↑
- Resale Replace kitchen cabinets — Replacing old kitchen cabinets can improve the home's appearance and make it more appealing to potential buyers. ↑
- Resale Replace bathroom fixtures — Replacing old bathroom fixtures can improve the home's appearance and make it more appealing to potential buyers. ↑
- Rental Landscaping maintenance — Maintaining the landscaping can improve the home's curb appeal and make it more attractive to potential renters. ↑
ⓘ Cost ranges are severity-bucket heuristics (US national rule-of-thumb). Get contractor quotes + a written scope before underwriting a rehab budget.
Schools (NCES district)
- District
- Lee
- NCES district ID
- 1201080
- Math proficiency
- 47% ▼ -11.00%
- Reading proficiency
- 50% ▼ -4.00%
- Median HH income
- $49,518
- Composite
- 41.49/100
- National rank
- #3458
- State rank
- #42 of 73 in FL
Livability — Cape Coral
- Score
- 77/100
- State rank
- #208
- US rank
- #3098
Category grades
Schools grade is shown separately in the Schools card above.
Census & demographics
- Census place
- Cape Coral, FL
- County
- Lee County · 788,662 people
- City population
- 217,388
- Metro
- Cape Coral-Fort Myers, FL
- Population (ZIP)
- 27,725
- Household income
- $84,470
- Rent vs Own
- Severe rent burden
- 760.0
Population outlook (Lee County) Hauer SSP2
- Today (2025)
- 871,946 people
- By 2030
- 955,468 · +9.6%
- By 2040
- 1,113,587 · +27.7%
- By 2050
- 1,256,891 · +44.1%
- By 2075
- 1,560,270 · +78.9%
- By 2100
- 1,726,848 · +98.0%
Race, ethnicity, and origin ACS 2023
- Neighborhood character
- Predominantly White (71%)
- Race & ethnicity
- White 71% Hispanic / Latino 20% Two or more races 14% Black 3% Asian 1%
- Hispanic origin (detail)
- Mexican 1% Puerto Rican 6% Cuban 6%
- Common ancestry
- Romanian 5% Lithuanian 3% Italian 3%
- Foreign-born
- 13% · Canada, Jamaica
- Languages at home
- 81% English-only · Spanish 15% Russian/Polish/Slavic 1% Tagalog/Filipino 1%
Political lean MEDSL · Lee
- 2024 margin
- Strong R (+28.4) · D 35.5% · R 63.9%
- 2008→2024 swing
- -18.0pp toward R · 2008: -10.4pp · 2024: -28.4pp
- All cycles
- 2024: R+28.4 2020: R+19.2 2016: R+20.4 2012: R+16.6 2008: R+10.4
Not yet ingested
- Civics
- —
Market trends
- HPI YoY
- ▼ -108.25%
- Current HPI
- 281.0735
- Rent YoY
- ▼ -8.55%
- Metro
- Cape Coral-Fort Myers, FL
- State GDP YoY
- ▲ 3.28%
- F500 in state
- 36
Industry mix (Fortune 500 HQ in FL)
| Industry | F500 HQs | Revenue |
|---|---|---|
| Industrial Technology | 2 | $29B |
|
||
| Insurance | 2 | $17B |
|
||
| Retail | 1 | $60B |
|
||
| Technology Distribution | 1 | $58B |
|
||
| Homebuilding | 1 | $35B |
|
||
| Technology Manufacturing | 1 | $35B |
|
||
Price history
+79.4% since first listed6 events — show timeline
- 2026-05-07 Pending — FORTMLS
- 2026-04-20 Price Changed $339,000 FORTMLS
- 2026-03-24 Listed $349,000 FORTMLS
- 2019-08-16 Listing Removed — Stellar MLS as Distributed by MLS Grid
- 2019-08-05 Price Changed $177,000 Stellar MLS as Distributed by MLS Grid
- 2019-03-18 Listed $189,000 Stellar MLS as Distributed by MLS Grid
Cash-flow waterfall
monthlySold comps — $/sqft
last 12 mo · ≤1 miLoading sold comps…