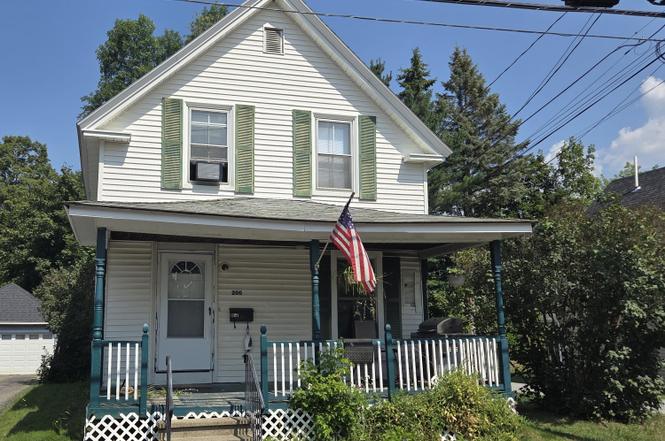
200 Fourth St · Old Town, ME
Flood risk 1/10 · Minimal
- FEMA flood zone
- X (unshaded)
- Chance of flooding over 30 yrs
- 0.0%
- Est. flood insurance / yr
- $473 – $860
Fire risk 1/10 · Minimal
- Est. fire insurance / yr
- $669 – $1,243
Heat risk 3/10 · Minor
- Hot days now (above 92°F)
- 7 days/yr
- Hot days in 30 yrs
- 15 days/yr
Wind risk 6/10 · Moderate
- Chance of severe wind over 30 yrs
- 27.0%
Air-quality risk 1/10 · Minimal
- Unhealthy air days now
- 0 days/yr
- Unhealthy air days in 30 yrs
- 0 days/yr
Risk factors via First Street. Map © Google.
Why this score? — see what drove the C+ grade
The composite is a weighted blend of 9 inputs, each scored 0–100. Each bar is that input's sub-score; the figure is the points it added to the 100-point composite (weight × sub-score).
- Cash flow +20.7/30.0
- ARV discount +12.7/15.0
- Schools +6.8/10.0
- DSCR +6.6/10.0
- 1% rule +5.6/10.0
- Livability +3.8/5.0
- Rent growth +2.5/5.0
- Condition / age +2.5/5.0
- Appreciation +2.4/10.0
$190,000
🖨 Deal sheet 📄 Offer letter ✓ Due diligence
Key facts
- 4,791 sq ft lot
- Parking
- Built 1900
Property features AI
Exterior
- Parking: 1–4 spaces on gravel; Other vehicle storage
- Utilities: Public water; Public sewer
- Home design: Single family residence; Built in 1900
- Construction: Vinyl siding; Wood frame construction; Stone and brick/mortar foundation; Shingle roof
- Exterior features: Deck; Porch; Shed(s); Open, level lot; Near shopping; Neighborhood/suburban setting; Paved road
Interior
- Kitchen: Refrigerator; Gas range
- Bedrooms: Bedroom 1 on first floor; Bedroom 2 on second floor; Bedroom 3 on second floor; Bedroom 4 on second floor; Bedroom 5 on second floor
- Flooring: Wood; Vinyl; Carpet
- Bathrooms: 1 full bathroom
- Heating & cooling: Direct vent furnace; Baseboard heating; Circuit breaker electric service; Electric water heater
- Interior features: First-floor bedroom; Shower; Unfurnished; Internet access available; 8 total rooms
- Laundry & utility: Washer hookup
Neighborhood map
What this means for you Summary
Snapshot
- This is a 4-bed/1.0-bath single-family listed at $190k.
Deal economics
- At list price, monthly cash flow is $259 ($3k/yr) — positive.
- The deal already cash-flows at list — no discount required.
- Meets the 1% rule at list price ($2k rent vs $190k).
- Recommended offer: $167k (12.0% below list) — sets the bar for market timing.
- Cap rate 7.9% vs local median 6.0% in Old Town — top-decile yield for the area; either an underpriced asset or a hidden risk that comps aren't pricing in. Stress-test before assuming the spread holds.
Location & tenants
- Location reads 75/100 on livability (#38 in ME, #3,905 nationally) — a middle-class / working-renter tenant base. Strengths: crime A+, cost of living A+, housing A+; Watch: schools D+, employment D, amenities F.
- RSU 34 (suburban): math 81% / reading 83% proficiency, ranked #80 of 112 in ME (top 71%) — strong family-tenant draw, lease renewals of 3-5y typical.
- Market conditions: 46 active listings in the ZIP; 5 comparable units currently listed for rent nearby; rentals lingering (median 44d on market — plan ~5-8 weeks vacancy on turnover, expect pricing pressure); 100% of comp listings sitting > 30 days — soft ceiling on asking rent; 440 units permitted in Penobscot County in 2024 (40 in 5+ unit buildings).
- This rent runs 43% of the median local income ($56k/yr) — at the standard rent-burdened threshold; future hikes will face affordability resistance.
Forward outlook
- Local home prices are declining (-3.0%/yr); year-one equity from $1k of loan paydown is wiped out by about $6k of value loss. Plan a longer hold.
- Penobscot County population projected at -17% by 2050 — secular population decline; favor cash flow + early exit over multi-decade hold.
Negotiation context
- It's been on market 276 days — a 12% lower offer ($167k) is reasonable based on typical stale-listing flexibility.
Risks & watch-outs
- Watch-outs: built in 1900 — expect roof / HVAC / electrical / plumbing capex.
- Climate carrying-cost: major wind risk, 27% chance of damaging wind over 30y — expect insurance premiums to compound above CPI over the hold.
Questions for the listing agent
- It's been on market 276 days. Have you received any prior offers? Is the seller open to a 12% concession, seller financing, or rate buy-down credit?
- Built in 1900 — when were the roof, HVAC, electrical panel, plumbing, and water heater last replaced?
- Why hasn't it sold? Are there any deal-killer items the seller is aware of (foundation, flood, title, zoning, code violations)?
- Is there a deadline driving the sale (1031 exchange, divorce, estate, relocation)? That informs how much negotiation room exists.
- Schools are D-rated, which usually means shorter tenancies and higher turnover. Who's the typical renter profile here, and what's been the actual vacancy rate?
- What's the average days-on-market for RENTAL listings here right now (not sales)? A rising rental-DOM trend means longer vacancies and softer asking-rent achievability than the comps imply.
- What's the recent tenant-quality profile in this submarket — average credit score on applications, eviction rate, late-payment / NSF rate, and stable-employment percentage? A property-management company in the area should have these aggregated.
- How much new for-sale + rental construction is in the pipeline within 1–3 miles? Heavy new supply typically softens prices + rents 12–24 months out; constrained supply supports both.
Investment metrics
- 1% rule
- 1.06% ✓
- Cap rate
- 7.93%
- Cash-on-cash
- 5.84%
- DSCR
- 1.26
- GRM
- 7.9
CMA / ARV
- ARV (on-the-fly)
- $214,880
- Comps found
- 12
Show comp detail 12 sales within ~0.75 mi
| Address | Dist | Beds/Ba | Sqft | Sold | Price | $/sf | Match |
|---|---|---|---|---|---|---|---|
| 200 Fourth St | 0.00mi | 5/1.0 (+1) | 1,343 (0%) | 1mo | $190,000 | $141 | 94 |
| 87 Veazie St | 0.10mi | 4/1.5 | 1,355 (+1%) | 9mo | $215,000 | $159 | 85 |
| 108 Middle St | 0.26mi | 3/2.0 (-1) | 1,368 (+2%) | 9mo | $264,900 | $194 | 68 |
| 26 Elm St | 0.30mi | 3/2.0 (-1) | 1,305 (-3%) | 6mo | $209,000 | $160 | 67 |
| 24 Gilman Falls Ave | 0.29mi | 3/1.5 (-1) | 1,437 (+7%) | 1mo | $271,500 | $189 | 67 |
| 30 Elm St | 0.31mi | 5/1.0 (+1) | 1,506 (+12%) | 0mo | $130,000 | $86 | 60 |
| 58 Elm St | 0.37mi | 4/1.0 | 1,182 (-12%) | 8mo | $60,000 | $51 | 56 |
| 150 Middle St | 0.28mi | 3/1.5 (-1) | 1,200 (-11%) | 12mo | $268,000 | $223 | 52 |
| 20 Gilmore Ct | 0.31mi | 5/1.0 (+1) | 1,202 (-10%) | 14mo | $133,201 | $111 | 51 |
| 399 4th St | 0.48mi | 3/1.5 (-1) | 1,250 (-7%) | 13mo | $184,000 | $147 | 48 |
| 32 Fifth St | 0.48mi | 3/2.5 (-1) | 1,512 (+13%) | 2mo | $295,000 | $195 | 45 |
| 126 Bosworth St | 0.70mi | 3/1.0 (-1) | 1,262 (-6%) | 10mo | $217,000 | $172 | 44 |
Match score weights: distance 35% · size 25% · config 20% · recency 20%. Top-matched comps best support the ARV.
Projected returns pro-forma
-3.0% appreciation · 3.0% rent growth · sell at horizon
- IRR
- -7.3%
- Equity multiple
- 0.73×
- Total profit
- $-14,266
- Equity at exit
- $28,330
- IRR
- 2.4%
- Equity multiple
- 1.17×
- Total profit
- $8,973
- Equity at exit
- $16,428
Cash invested: $53,200 (down + closing). Projections, not guarantees.
Landlord ↔ Tenant lean methodology
- Overall (STATE)
- 41 Moderately Tenant-Leaning
- State Maine
- 41 Moderately Tenant-Leaning · D+2
- County
- — inherits STATE
- City
- — inherits STATE
ZIP-level market 04468
- Home prices YoY
- -1.8%
- Active inventory
- 46
- Price-to-rent
- 7.9×
Monthly cashflow live
- Estimated rent
- $2,016 high interval (Pro) →
- Mortgage (P&I)
- −$996
- Tax from tax record
- −$259 /mo · $3,105/yr
- Insurance
- −$79
- HOA
- −$0
- Vacancy / Maint / Mgmt
- −$423
- Net cashflow
- $259
Break-even live
UW: 25.0% down · 7.5% · 30yr · 1.5% tax · 5.0% vac · 8.0% maint · 8.0% mgmt
Financing live
Cash to close
- Down payment
- $47,500
- Closing costs
- $5,700
- Reserves months
- —
- Total cash needed
- —
Loan-product check · same deal, 3 products live
Conventional
25% down · 7.5% · 30yr
- Down + closing
- —
- Monthly P&I
- —
- Monthly cashflow
- —
- DSCR
- —
- Eligible?
- —
Personal DTI + credit; lowest rate.
DSCR
20% down · 8.5% · 30yr
- Down + closing
- —
- Monthly P&I
- —
- Monthly cashflow
- —
- DSCR
- —
- Eligible?
- —
No personal income docs; deal must DSCR.
Hard money
10% down · 12.0% · 12mo
- Down + closing
- —
- Monthly P&I
- —
- Monthly cashflow
- —
- DSCR
- —
- Eligible?
- —
Short-term bridge; refi at stabilization.
Rent comps 5 comps
| Address | Beds | Baths | Sqft | Rent | $/sqft | DOM | Units | Dist |
|---|---|---|---|---|---|---|---|---|
| 21 Jefferson St Unit 5 Old Town, ME | 3.0 | 2.0 | 1250 | $1,795 | $1.44 | 43d | 1 | 0.52mi |
| 53 Perkins Ave Apt 1 Old Town, ME | 3.0 | 1.5 | 1400 | $2,100 | $1.50 | 43d | 1 | 0.59mi |
| 128 Jefferson St Old Town, ME | 3.0 | 1.0 | 1300 | $1,850 | $1.42 | 43d | 1 | 0.70mi |
| 13 Eaton St Old Town, ME | 3.0 | 1.0 | 1200 | $2,100 | $1.75 | 43d | 1 | 0.77mi |
| 41 County Rd Milford, ME | 3.0 | 2.0 | 1000 | $1,500 | $1.50 | 43d | 1 | 0.78mi |
Listing history 4 events
-
2026-05-19status Pending
-
2026-04-26historical Active Under Contract
-
2026-02-25price $190,000
-
2025-08-16$197,000 Active
ⓘ Source: listings_history table (triggers on properties + properties_extension) + one-shot
backfill from property_details.listing_events for pre-trigger history.
Tax reassessment forecast ME · Partial reset (capped growth)
- Current annual tax
- $3,105 · $259/mo
- Projected year-2 tax
- $3,105 · $259/mo
- Expected delta
- $0/yr ($0/mo · 0.0%)
ⓘ Screening estimate from a state-policy table — verify with the county assessor before closing.
Climate risk First Street
- Flood 1/10 Low FEMA zone X (unshaded) · 0% chance over 30 yrs
- Wildfire 1/10 Low
- Heat 3/10 Moderate 7 d/yr ≥92°F today · 15 d/yr by 30 yrs out
- Wind 6/10 Major 27% chance of damaging wind over 30 yrs
- Air quality 1/10 Low 0 unhealthy d/yr today · 0 by 30 yrs out
Nearby sold comps map
Loading sold comps map…
Walkable amenities ~0.75 mi
Loading nearby amenities…
Taxation est. · year 1
- Rental income
- $24,198
- − Mortgage interest
- −$10,643
- − Property taxes
- −$3,105
- − Insurance
- −$950
- − Repairs & maintenance
- −$1,936
- − Management
- −$1,936
- − Depreciation
- −$5,527
- Taxable income
- $101
- Est. tax owed @ 24.0%
- −$24
- After-tax cash flow
- $3,081/yr
For passive investors: Depreciation is non-cash, so a rental often shows a tax loss while cash-flowing — sheltering income. Rental losses are passive: they offset passive income freely, and up to $25,000/yr can offset ordinary (W-2) income if you actively participate and your MAGI is under $100k (phasing out to $0 by $150k); unused losses carry forward. On sale, claimed depreciation is recaptured at up to 25%, and gains may owe capital-gains tax (a 1031 exchange can defer both). Figures are a year-1 estimate at your 24.0% rate — not tax advice; consult a CPA.
Schools (NCES district)
- District
- RSU 34
- NCES district ID
- 2314782
- Math proficiency
- 81% ▲ 48.00%
- Reading proficiency
- 83% ▲ 31.00%
- Median HH income
- $39,466
- Composite
- 68.31/100
- National rank
- #351
- State rank
- #80 of 112 in ME
Livability — Old Town
- Score
- 75/100
- State rank
- #38
- US rank
- #3905
Category grades
Schools grade is shown separately in the Schools card above.
Census & demographics
- Census place
- Old Town, ME
- County
- Penobscot County · 81,539 people
- City population
- 9,291
- Metro
- Bangor, ME
- Population (ZIP)
- 9,291
- Household income
- $56,358
- Rent vs Own
- Severe rent burden
- 334.0
Population outlook (Penobscot County) Hauer SSP2
- Today (2025)
- 149,928 people
- By 2030
- 146,386 · -2.4%
- By 2040
- 135,952 · -9.3%
- By 2050
- 123,864 · -17.4%
- By 2075
- 97,825 · -34.8%
- By 2100
- 77,196 · -48.5%
Race, ethnicity, and origin ACS 2023
- Neighborhood character
- Predominantly White (88%)
- Race & ethnicity
- White 88% Native American 6% Two or more races 3% Hispanic / Latino 2%
- Common ancestry
- Lithuanian 18% Slovak 4% Romanian 1%
- Foreign-born
- 2% · Canada
- Languages at home
- 96% English-only · French/Haitian/Cajun 1% Other Indo-European 1%
Political lean MEDSL · Penobscot
- 2024 margin
- R (+10.9) · D 43.6% · R 54.5% · Other 1.9%
- 2008→2024 swing
- -15.9pp toward R · 2008: 5.0pp · 2024: -10.9pp
- All cycles
- 2024: R+10.9 2020: R+8.3 2016: R+10.9 2012: D+2.9 2008: D+5.0
Not yet ingested
- Civics
- —
Market trends
- HPI YoY
- ▼ -5.29%
- Current HPI
- 285.3183
- Rent YoY
- —
- Metro
- Bangor, ME
- State GDP YoY
- —
- F500 in state
- 0
Price history
-3.6% since first listed4 events — show timeline
- 2026-05-19 Pending — MREIS
- 2026-04-26 Contingent — MREIS
- 2026-02-25 Price Changed $190,000 MREIS
- 2025-08-16 Listed $197,000 MREIS
Property tax history
+4.4%/yrLatest (2025): $3,105 · +12.9% YoY. Source: county tax records.
Cash-flow waterfall
monthlySold comps — $/sqft
last 12 mo · ≤1 miLoading sold comps…