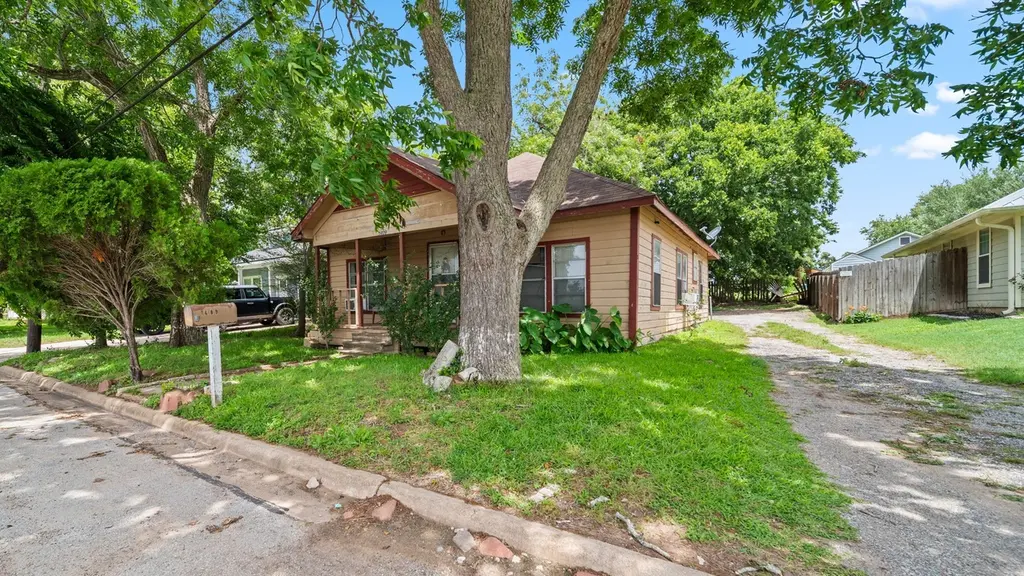
1409 Lauraine St · Brenham, TX
Flood risk 1/10 · Minimal
- FEMA flood zone
- X (unshaded)
- Chance of flooding over 30 yrs
- 0.0%
- Est. flood insurance / yr
- $507 – $1,088
Fire risk 5/10 · Moderate
- Est. fire insurance / yr
- $1,222 – $2,270
Heat risk 8/10 · Major
- Hot days now (above 111°F)
- 7 days/yr
- Hot days in 30 yrs
- 23 days/yr
Wind risk 8/10 · Major
- Chance of severe wind over 30 yrs
- 99.0%
Air-quality risk 1/10 · Minimal
- Unhealthy air days now
- 0 days/yr
- Unhealthy air days in 30 yrs
- 0 days/yr
Risk factors via First Street. Map © Google.
Why this score? — see what drove the B- grade
The composite is a weighted blend of 9 inputs, each scored 0–100. Each bar is that input's sub-score; the figure is the points it added to the 100-point composite (weight × sub-score).
- Cash flow +29.8/30.0
- DSCR +10.0/10.0
- 1% rule +8.5/10.0
- ARV discount +7.5/15.0
- Schools +3.9/10.0
- Livability +3.8/5.0
- Rent growth +2.5/5.0
- Condition / age +2.5/5.0
- Appreciation +0.0/10.0
$115,000
🖨 Deal sheet 📄 Offer letter ✓ Due diligence
Listing remarks
Conveniently located just 1 mile from the heart of downtown Brenham, this 3-bedroom, 1,253 square feet home sits on a spacious lot shaded by mature trees in a quiet part of town. With close proximity to schools, local businesses, and everyday amenities, the location offers both convenience and small-town charm. This pier-and-beam home presents an excellent opportunity for investors, flippers, or buyers looking to build sweat equity. With solid bones and a functional layout, it’s an ideal canvas for renovation and transformation into your vision. The property features wood siding, along with a mix of wood flooring, carpet, and tile—ready for your updates and personal touch. Wheth
Key facts
- Pier-and-beam home
- Spacious lot
- Wood siding
Tags
Property features AI
Finance
- Other: Seller disclosure available; Lease not considered
Exterior
- Parking: Detached carport; Carport for 2 vehicles
- Utilities: Public water; Public sewer
- Home design: Residential property; Built in 1986; Pillar/post/pier foundation
- Construction: Wood siding construction; Composition roof
- Exterior features: Lot includes other features
Interior
- Bedrooms: Primary bedroom on the first floor (13 x 14); Bedroom on the first floor (11 x 11); Bedroom on the first floor (11 x 10)
- Bathrooms: 1 full bathroom
- Heating & cooling: Window unit cooling
- Interior features: 3 total rooms
Neighborhood map
What this means for you Summary
Snapshot
- This is a 3-bed/1.0-bath single-family listed at $115k.
Deal economics
- At list price, monthly cash flow is $424 ($5k/yr) — positive.
- The deal already cash-flows at list — no discount required.
- Meets the 1% rule at list price ($2k rent vs $115k).
- Cap rate 10.7% vs local median 2.7% in Brenham — top-decile yield for the area; either an underpriced asset or a hidden risk that comps aren't pricing in. Stress-test before assuming the spread holds.
Location & tenants
- Location reads 75/100 on livability (#136 in TX, #3,978 nationally) — a middle-class / working-renter tenant base. Strengths: cost of living A+, housing A+, amenities A; Watch: employment C-, crime F, commute F.
- Brenham ISD (town): math 50% / reading 40% proficiency, ranked #263 of 826 in TX (top 32%) — families likely to look elsewhere, expect single-tenant / working-renter base with shorter leases.
- Zoned schools: Brenham H S (math 50% / reading 45%, grade D, #583 of 1,632 statewide, top 36%, 1,584 students, 50% FRL) — zoned schools at 50% FRL track the district average.
- Market conditions: 514 active listings in the ZIP; 20 comparable units currently listed for rent nearby; rentals lingering (median 44d on market — plan ~5-8 weeks vacancy on turnover, expect pricing pressure); 100% of comp listings sitting > 30 days — soft ceiling on asking rent; 111 units permitted in Washington County in 2024 (0 in 5+ unit buildings).
Forward outlook
- Local home prices are declining (-3.0%/yr); year-one equity from $795 of loan paydown is wiped out by about $3k of value loss. Plan a longer hold.
- Washington County population projected at +16% by 2050 — long-run rental-demand tailwind backs the buy-and-hold thesis.
- At projected returns (-3.0% appreciation + 3.0% rent growth), your $32k cash investment doubles in ~8 years — after that, you're playing with house money.
Negotiation context
- Only 2 days on market — expect competitive offers; lowballing is unlikely to land.
Risks & watch-outs
- Climate carrying-cost: severe wind risk, 99% chance of damaging wind over 30y; moderate wildfire risk; extreme-heat days projected 7→23/yr by 2055 (HVAC capex compounding) — expect insurance premiums to compound above CPI over the hold.
Questions for the listing agent
- Is there a deadline driving the sale (1031 exchange, divorce, estate, relocation)? That informs how much negotiation room exists.
- Crime grade is F in this area — have there been break-ins, vandalism, or insurance claims at this property in the last 3 years? What carrier currently insures it and at what premium?
- What's the average days-on-market for RENTAL listings here right now (not sales)? A rising rental-DOM trend means longer vacancies and softer asking-rent achievability than the comps imply.
- What's the recent tenant-quality profile in this submarket — average credit score on applications, eviction rate, late-payment / NSF rate, and stable-employment percentage? A property-management company in the area should have these aggregated.
- How much new for-sale + rental construction is in the pipeline within 1–3 miles? Heavy new supply typically softens prices + rents 12–24 months out; constrained supply supports both.
Investment metrics
- 1% rule
- 1.35% ✓
- Cap rate
- 10.72%
- Cash-on-cash
- 15.80%
- DSCR
- 1.70
- GRM
- 6.2
CMA / ARV
- ARV (on-the-fly)
- $233,058
- Comps found
- 12
Show comp detail 12 sales within ~0.75 mi
| Address | Dist | Beds/Ba | Sqft | Sold | Price | $/sf | Match |
|---|---|---|---|---|---|---|---|
| 1107 Thiel St | 0.20mi | 2/1.0 (-1) | 1,209 (-4%) | 14mo | $125,000 | $103 | 68 |
| 400 N Chappell Hill St | 0.33mi | 2/1.0 (-1) | 1,331 (+6%) | 2mo | $249,900 | $188 | 67 |
| 605 Gay Hill St | 0.43mi | 3/1.0 | 1,238 (-1%) | 14mo | $250,000 | $202 | 67 |
| 1201 E Alamo St | 0.35mi | 3/1.0 | 1,158 (-8%) | 6mo | $214,900 | $186 | 66 |
| 706 Matilda St | 0.48mi | 3/1.0 | 1,210 (-3%) | 8mo | $199,900 | $165 | 65 |
| 1006 Barnhill St | 0.28mi | 3/1.0 | 1,341 (+7%) | 14mo | $95,000 | $71 | 63 |
| 1304 E Alamo St | 0.35mi | 3/1.0 | 1,161 (-7%) | 14mo | $184,900 | $159 | 60 |
| 907 Martin St | 0.29mi | 2/2.0 (-1) | 1,160 (-7%) | 12mo | $199,000 | $172 | 55 |
| 1002 Norris St | 0.59mi | 3/2.0 | 1,174 (-6%) | 5mo | $305,000 | $260 | 54 |
| 1310 Bridge St | 0.16mi | 3/2.0 | 1,386 (+11%) | 22mo | $325,000 | $234 | 53 |
| 505 Alma St | 0.57mi | 2/1.0 (-1) | 1,259 (+0%) | 18mo | $380,000 | $302 | 52 |
| 801 Kerr St | 0.72mi | 3/1.5 | 1,415 (+13%) | 21mo | $229,900 | $162 | 25 |
Match score weights: distance 35% · size 25% · config 20% · recency 20%. Top-matched comps best support the ARV.
Projected returns pro-forma
-3.0% appreciation · 3.0% rent growth · sell at horizon
- IRR
- 6.7%
- Equity multiple
- 1.26×
- Total profit
- $8,391
- Equity at exit
- $17,147
- IRR
- 16.0%
- Equity multiple
- 2.31×
- Total profit
- $42,184
- Equity at exit
- $9,943
Cash invested: $32,200 (down + closing). Projections, not guarantees.
Landlord ↔ Tenant lean methodology
- Overall (STATE)
- 87 Strongly Landlord-Friendly
- State Texas
- 87 Strongly Landlord-Friendly · R+5
- County
- — inherits STATE
- City
- — inherits STATE
ZIP-level market 77833
- Active inventory
- 514
- Price-to-rent
- 6.2×
Monthly cashflow live
- Estimated rent
- $1,551 high interval (Pro) →
- Mortgage (P&I)
- −$603
- Tax from tax record
- −$151 /mo · $1,807/yr
- Insurance
- −$48
- HOA
- −$0
- Vacancy / Maint / Mgmt
- −$326
- Net cashflow
- $424
Break-even live
UW: 25.0% down · 7.5% · 30yr · 1.5% tax · 5.0% vac · 8.0% maint · 8.0% mgmt
Financing live
Cash to close
- Down payment
- $28,750
- Closing costs
- $3,450
- Reserves months
- —
- Total cash needed
- —
Loan-product check · same deal, 3 products live
Conventional
25% down · 7.5% · 30yr
- Down + closing
- —
- Monthly P&I
- —
- Monthly cashflow
- —
- DSCR
- —
- Eligible?
- —
Personal DTI + credit; lowest rate.
DSCR
20% down · 8.5% · 30yr
- Down + closing
- —
- Monthly P&I
- —
- Monthly cashflow
- —
- DSCR
- —
- Eligible?
- —
No personal income docs; deal must DSCR.
Hard money
10% down · 12.0% · 12mo
- Down + closing
- —
- Monthly P&I
- —
- Monthly cashflow
- —
- DSCR
- —
- Eligible?
- —
Short-term bridge; refi at stabilization.
Rent comps 20 comps
| Address | Beds | Baths | Sqft | Rent | $/sqft | DOM | Units | Dist |
|---|---|---|---|---|---|---|---|---|
| 715 Sabine St Brenham, TX | 2.0 | 1.0 | 900 | $1,450 | $1.61 | 43d | 1 | 0.15mi |
| 1506 Simon Ave Brenham, TX | 3.0 | 2.0 | 1579 | $1,400 | $0.89 | 43d | 1 | 0.26mi |
| 1002 Garrett St Brenham, TX | 3.0 | 2.0 | 1084 | $1,450 | $1.34 | 43d | 1 | 0.44mi |
| 1000 Marie St Brenham, TX | 3.0 | 2.0 | 1322 | $1,450 | $1.10 | 43d | 1 | 0.92mi |
| 101 W Second St Brenham, TX | 3.0 | 2.5 | 1763 | $1,700 | $0.96 | 43d | 1 | 0.98mi |
| 309 Duprie Dr Brenham, TX | 3.0 | 2.0 | 1094 | $1,550 | $1.42 | 43d | 1 | 1.02mi |
| 303 Ava Dr Brenham, TX | 4.0 | 2.0 | 1685 | $1,800 | $1.07 | 43d | 1 | 1.11mi |
| 809 Jersey Ln Brenham, TX | 2.0 | 1.0 | 884 | $1,300 | $1.47 | 43d | 1 | 1.13mi |
| 309 McNeese St Brenham, TX | 2.0 | 1.0 | 877 | $1,400 | $1.60 | 43d | 1 | 1.13mi |
| 201 Ava Dr Brenham, TX | 3.0 | 2.0 | 1301 | $1,800 | $1.38 | 43d | 1 | 1.16mi |
| 1700 Ellen St Brenham, TX | 3.0 | 2.0 | 1860 | $1,550 | $0.83 | 43d | 1 | 1.23mi |
| 812 Burleson St Brenham, TX | 3.0 | 1.0 | 1553 | $1,525 | $0.98 | 43d | 1 | 1.24mi |
| 509 E Mansfield St Brenham, TX | 3.0 | 2.0 | 1506 | $1,400 | $0.93 | 43d | 1 | 1.25mi |
| 500 College Ave Brenham, TX | 1.0–3.0 | 1.0–1.5 | 800 | $1,375 | $1.72 | 43d | 2 | 1.35mi |
| 705 S Jackson St Brenham, TX | 2.0 | 1.0 | 1050 | $1,312 | $1.25 | 43d | 2 | 1.36mi |
| 908 E Stone St Brenham, TX | 4.0 | 1.5 | 1769 | $1,400 | $0.79 | 43d | 1 | 1.43mi |
| 900 E Stone St Brenham, TX | 4.0 | 1.0 | 1272 | $1,100 | $0.86 | 43d | 1 | 1.44mi |
| 806 E Stone St Brenham, TX | 3.0 | 2.0 | 1419 | $1,500 | $1.06 | 43d | 1 | 1.45mi |
| 802 E Stone St Brenham, TX | 3.0 | 2.0 | 1318 | $1,750 | $1.33 | 43d | 1 | 1.46mi |
| 1003 Oakridge St Brenham, TX | 3.0 | 2.0 | 1452 | $1,750 | $1.21 | 43d | 1 | 1.49mi |
Listing history 2 events
-
2026-06-12remarks 687-char remark
-
2026-06-12$115,000 Pending 2 DOM
ⓘ Source: listings_history table (triggers on properties + properties_extension) + one-shot
backfill from property_details.listing_events for pre-trigger history.
Tax reassessment forecast TX · Resets to sale price
- Current annual tax
- $1,807 · $151/mo
- Projected year-2 tax
- $2,104 · $175/mo
- Expected delta
- +$298/yr (+$25/mo · 16.5%)
ⓘ Screening estimate from a state-policy table — verify with the county assessor before closing.
Climate risk First Street
- Flood 1/10 Low FEMA zone X (unshaded) · 0% chance over 30 yrs
- Wildfire 5/10 Major
- Heat 8/10 Severe 7 d/yr ≥111°F today · 23 d/yr by 30 yrs out
- Wind 8/10 Severe 99% chance of damaging wind over 30 yrs
- Air quality 1/10 Low 0 unhealthy d/yr today · 0 by 30 yrs out
Nearby sold comps map
Loading sold comps map…
Walkable amenities ~0.75 mi
Loading nearby amenities…
Taxation est. · year 1
- Rental income
- $18,615
- − Mortgage interest
- −$6,442
- − Property taxes
- −$1,807
- − Insurance
- −$575
- − Repairs & maintenance
- −$1,489
- − Management
- −$1,489
- − Depreciation
- −$3,345
- Taxable income
- $3,467
- Est. tax owed @ 24.0%
- −$832
- After-tax cash flow
- $4,255/yr
For passive investors: Depreciation is non-cash, so a rental often shows a tax loss while cash-flowing — sheltering income. Rental losses are passive: they offset passive income freely, and up to $25,000/yr can offset ordinary (W-2) income if you actively participate and your MAGI is under $100k (phasing out to $0 by $150k); unused losses carry forward. On sale, claimed depreciation is recaptured at up to 25%, and gains may owe capital-gains tax (a 1031 exchange can defer both). Figures are a year-1 estimate at your 24.0% rate — not tax advice; consult a CPA.
Schools (NCES district)
- District
- Brenham ISD
- NCES district ID
- 4811280
- Math proficiency
- 50% ▼ -4.00%
- Reading proficiency
- 40% ▼ -4.00%
- Median HH income
- $48,090
- Composite
- 38.51/100
- National rank
- #4177
- State rank
- #263 of 826 in TX
Livability — Brenham
- Score
- 75/100
- State rank
- #136
- US rank
- #3978
Category grades
Schools grade is shown separately in the Schools card above.
Census & demographics
- Census place
- Brenham, TX
- County
- Washington County · 29,498 people
- City population
- 29,498
- Metro
- Brenham, TX
- Population (ZIP)
- 29,498
- Household income
- $73,388
- Rent vs Own
- Severe rent burden
- 614.0
Population outlook (Washington County) Hauer SSP2
- Today (2025)
- 37,557 people
- By 2030
- 38,789 · +3.3%
- By 2040
- 41,305 · +10.0%
- By 2050
- 43,687 · +16.3%
- By 2075
- 50,242 · +33.8%
- By 2100
- 53,235 · +41.7%
Race, ethnicity, and origin ACS 2023
- Neighborhood character
- Diverse neighborhood (Simpson 0.59)
- Race & ethnicity
- White 59% Hispanic / Latino 20% Black 16% Two or more races 12% Asian 2%
- Hispanic origin (detail)
- Mexican 18%
- Common ancestry
- Romanian 2% Lithuanian 2% Slovak 1%
- Foreign-born
- 7% · Canada, South Korea
- Languages at home
- 85% English-only · Spanish 12% Tagalog/Filipino 1% Russian/Polish/Slavic 1%
Political lean MEDSL · Washington
- 2024 margin
- Solid R (+54.7) · D 22.3% · R 77.0%
- 2008→2024 swing
- -12.0pp toward R · 2008: -42.7pp · 2024: -54.7pp
- All cycles
- 2024: R+54.7 2020: R+49.9 2016: R+51.3 2012: R+52.0 2008: R+42.7
Not yet ingested
- Civics
- —
Market trends
- HPI YoY
- ▼ -107.24%
- Current HPI
- 192.9078
- Rent YoY
- —
- Metro
- Brenham, TX
- State GDP YoY
- ▲ 3.95%
- F500 in state
- 110
Industry mix (Fortune 500 HQ in TX)
| Industry | F500 HQs | Revenue |
|---|---|---|
| Energy | 16 | $1,198B |
|
||
| Technology | 5 | $198B |
|
||
| Engineering / Construction | 4 | $72B |
|
||
| Energy Services | 3 | $60B |
|
||
| Utilities | 3 | $41B |
|
||
| Healthcare | 2 | $330B |
|
||
Price history
2 events — show timeline
- 2026-06-12 Pending — HARMLS
- 2026-06-10 Listed $115,000 HARMLS
Property tax history
+1.8%/yrLatest (2025): $1,807 · +12.2% YoY. Source: county tax records.
Cash-flow waterfall
monthlySold comps — $/sqft
last 12 mo · ≤1 miLoading sold comps…