13 Leonard St · South Glens Falls, NY
Flood risk 1/10 · Minimal
- FEMA flood zone
- X
- Chance of flooding over 30 yrs
- 0.0%
- Est. flood insurance / yr
- $473 – $860
Fire risk 4/10 · Minor
- Est. fire insurance / yr
- $691 – $1,283
Heat risk 3/10 · Minor
- Hot days now (above 97°F)
- 7 days/yr
- Hot days in 30 yrs
- 16 days/yr
Wind risk 2/10 · Minimal
- Chance of severe wind over 30 yrs
- 3.0%
Air-quality risk 1/10 · Minimal
- Unhealthy air days now
- 0 days/yr
- Unhealthy air days in 30 yrs
- 0 days/yr
Risk factors via First Street. Map © Google.
Why this score? — see what drove the B- grade
The composite is a weighted blend of 9 inputs, each scored 0–100. Each bar is that input's sub-score; the figure is the points it added to the 100-point composite (weight × sub-score).
- Cash flow +29.1/30.0
- DSCR +10.0/10.0
- 1% rule +9.0/10.0
- ARV discount +7.5/15.0
- Schools +4.7/10.0
- Livability +3.7/5.0
- Rent growth +2.5/5.0
- Condition / age +2.5/5.0
- Appreciation +0.0/10.0
$175,000
🖨 Deal sheet 📄 Offer letter ✓ Due diligence
Listing remarks
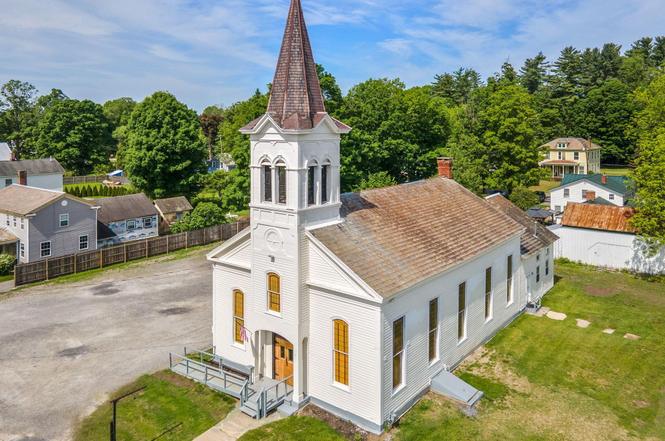
Here is your opportunity to acquire a former church property with tremendous flexibility and future potential. Situated on a level 0.40-acre lot, with an AADT traffic count over 3000, this 2,998-square-foot building features a spacious main assembly hall (33'-2'' X 47'-9'') ideal for worship services, community gatherings, banquet events, wedding receptions, educational programs, conferences, nonprofit organizations, and meeting facilities. The property's Hamlet zoning supports a wide variety of uses, making it attractive not only for religious organizations but also for investors and entrepreneurs seeking space for offices, retail operations, restaurants, fitness facilities, medical practi
Key facts
- Full basement
- Level 0.40 acre lot
- Drilled well
Tags
Property features AI
Finance
- Financial info: 5 total residential units
Exterior
- Parking: Off-street parking for 30 vehicles
- Utilities: Septic tank
- Home design: Multi-family property
- Construction: Vinyl siding
- Exterior features: Level lot; Other exterior features
Interior
- Bedrooms: Unit 1: 2 bedrooms
- Bathrooms: 2 bathrooms total (1 full, 1 half)
- Heating & cooling: Forced air heating; Natural gas heating
- Interior features: Full unfinished basement; Porch
Neighborhood map
What this means for you Summary
Snapshot
- This is a 2-bed/1.5-bath single-family listed at $175k.
Deal economics
- At list price, monthly cash flow is $604 ($7k/yr) — positive.
- The deal already cash-flows at list — no discount required.
- Meets the 1% rule at list price ($2k rent vs $175k).
- Cap rate 10.4% vs local median 2.3% in South Glens Falls — top-decile yield for the area; either an underpriced asset or a hidden risk that comps aren't pricing in. Stress-test before assuming the spread holds.
Location & tenants
- Location reads 73/100 on livability (#331 in NY) — a middle-class / working-renter tenant base. Strengths: housing A+, health & safety A+, crime B+; Watch: amenities F, commute F.
- South Glens Falls Central School District (suburban): math 49% / reading 59% proficiency, ranked #307 of 590 in NY (top 52%) — acceptable for families but not a draw, mixed tenant base, ~2y average lease.
- Zoned schools: South Glens Falls Senior High School (math 92% / reading 91%, grade A+, #197 of 1,100 statewide, top 18%, 908 students, 36% FRL).
- Zoned-school proficiency averages 92% at this address vs 54% district-wide (+38 pts) — the actual schools serving this property are materially stronger than the South Glens Falls Central School District average implies; a family-tenant draw the district grade alone would hide.
- Market conditions: 113 active listings in the ZIP; solid renter incomes; 1,132 units permitted in Saratoga County in 2024 (378 in 5+ unit buildings).
Forward outlook
- Local home prices are declining (-3.0%/yr); year-one equity from $1k of loan paydown is wiped out by about $5k of value loss. Plan a longer hold.
- Saratoga County population projected at +4% by 2050 — modest demand growth; plan on rents tracking national, not racing it.
- At projected returns (-3.0% appreciation + 3.0% rent growth), your $49k cash investment doubles in ~8 years — after that, you're playing with house money.
Negotiation context
- Only 8 days on market — expect competitive offers; lowballing is unlikely to land.
- 3 sale attempts since 21y ago with the ask held roughly flat each time — persistent listings suggest the price (not the market) is what's stuck; bring a comps-based counter.
- Current owner paid $96k; list at $175k implies a 82% gain — meaningful room to come down on a strong offer.
Risks & watch-outs
- Watch-outs: built in 1860 — expect roof / HVAC / electrical / plumbing capex.
Questions for the listing agent
- Built in 1860 — when were the roof, HVAC, electrical panel, plumbing, and water heater last replaced?
- Is there a deadline driving the sale (1031 exchange, divorce, estate, relocation)? That informs how much negotiation room exists.
- What's the average days-on-market for RENTAL listings here right now (not sales)? A rising rental-DOM trend means longer vacancies and softer asking-rent achievability than the comps imply.
- What's the recent tenant-quality profile in this submarket — average credit score on applications, eviction rate, late-payment / NSF rate, and stable-employment percentage? A property-management company in the area should have these aggregated.
- How much new for-sale + rental construction is in the pipeline within 1–3 miles? Heavy new supply typically softens prices + rents 12–24 months out; constrained supply supports both.
Investment metrics
- 1% rule
- 1.40% ✓
- Cap rate
- 10.44%
- Cash-on-cash
- 14.80%
- DSCR
- 1.66
- GRM
- 6.0
CMA / ARV
No comps found within radius.
Projected returns pro-forma
-3.0% appreciation · 3.0% rent growth · sell at horizon
- IRR
- 5.4%
- Equity multiple
- 1.21×
- Total profit
- $10,238
- Equity at exit
- $26,093
- IRR
- 14.8%
- Equity multiple
- 2.20×
- Total profit
- $58,915
- Equity at exit
- $15,131
Cash invested: $49,000 (down + closing). Projections, not guarantees.
Landlord ↔ Tenant lean methodology
- Overall (STATE)
- 15 Strongly Tenant-Friendly
- State New York
- 15 Strongly Tenant-Friendly · D+10
- County
- — inherits STATE
- City
- — inherits STATE
ZIP-level market 12831
- Home prices YoY
- -12.8%
- Active inventory
- 113
- Price-to-rent
- 6.0×
Monthly cashflow live
- Estimated rent
- $2,444 medium interval (Pro) →
- Mortgage (P&I)
- −$918
- Tax from tax record
- −$336 /mo · $4,029/yr
- Insurance
- −$73
- HOA
- −$0
- Vacancy / Maint / Mgmt
- −$513
- Net cashflow
- $604
Break-even live
UW: 25.0% down · 7.5% · 30yr · 1.5% tax · 5.0% vac · 8.0% maint · 8.0% mgmt
Financing live
Cash to close
- Down payment
- $43,750
- Closing costs
- $5,250
- Reserves months
- —
- Total cash needed
- —
Loan-product check · same deal, 3 products live
Conventional
25% down · 7.5% · 30yr
- Down + closing
- —
- Monthly P&I
- —
- Monthly cashflow
- —
- DSCR
- —
- Eligible?
- —
Personal DTI + credit; lowest rate.
DSCR
20% down · 8.5% · 30yr
- Down + closing
- —
- Monthly P&I
- —
- Monthly cashflow
- —
- DSCR
- —
- Eligible?
- —
No personal income docs; deal must DSCR.
Hard money
10% down · 12.0% · 12mo
- Down + closing
- —
- Monthly P&I
- —
- Monthly cashflow
- —
- DSCR
- —
- Eligible?
- —
Short-term bridge; refi at stabilization.
Listing history 6 events
-
2026-06-18days on market $175,000 Active 8 DOM
-
2026-06-17days on market $175,000 Active 7 DOM
-
2026-06-16days on market $175,000 Active 6 DOM
-
2026-06-15days on market $175,000 Active 5 DOM
-
2026-06-14remarks 699-char remark
-
2026-06-14$175,000 Active 3 DOM
ⓘ Source: listings_history table (triggers on properties + properties_extension) + one-shot
backfill from property_details.listing_events for pre-trigger history.
Tax reassessment forecast NY · Partial reset (capped growth)
- Current annual tax
- $4,029 · $336/mo
- Projected year-2 tax
- $4,029 · $336/mo
- Expected delta
- $0/yr ($0/mo · 0.0%)
ⓘ Screening estimate from a state-policy table — verify with the county assessor before closing.
Climate risk First Street
- Flood 1/10 Low FEMA zone X · 0% chance over 30 yrs
- Wildfire 4/10 Moderate
- Heat 3/10 Moderate 7 d/yr ≥97°F today · 16 d/yr by 30 yrs out
- Wind 2/10 Low 3% chance of damaging wind over 30 yrs
- Air quality 1/10 Low 0 unhealthy d/yr today · 0 by 30 yrs out
Nearby sold comps map
Loading sold comps map…
Walkable amenities ~0.75 mi
Loading nearby amenities…
Taxation est. · year 1
- Rental income
- $29,327
- − Mortgage interest
- −$9,803
- − Property taxes
- −$4,029
- − Insurance
- −$875
- − Repairs & maintenance
- −$2,346
- − Management
- −$2,346
- − Depreciation
- −$5,091
- Taxable income
- $4,837
- Est. tax owed @ 24.0%
- −$1,161
- After-tax cash flow
- $6,091/yr
For passive investors: Depreciation is non-cash, so a rental often shows a tax loss while cash-flowing — sheltering income. Rental losses are passive: they offset passive income freely, and up to $25,000/yr can offset ordinary (W-2) income if you actively participate and your MAGI is under $100k (phasing out to $0 by $150k); unused losses carry forward. On sale, claimed depreciation is recaptured at up to 25%, and gains may owe capital-gains tax (a 1031 exchange can defer both). Figures are a year-1 estimate at your 24.0% rate — not tax advice; consult a CPA.
Schools (NCES district)
- District
- South Glens Falls Central School District
- NCES district ID
- 3627240
- Math proficiency
- 49% ▼ -9.00%
- Reading proficiency
- 59% ▲ 12.00%
- Median HH income
- $59,015
- Composite
- 46.93/100
- National rank
- #2363
- State rank
- #307 of 590 in NY
Livability — South Glens Falls
- Score
- 73/100
- State rank
- #331
- US rank
- #5457
Category grades
Schools grade is shown separately in the Schools card above.
Census & demographics
- County
- Saratoga County · 166,192 people
- City population
- 8,915
- Metro
- Albany-Schenectady-Troy, NY
- Population (ZIP)
- 18,025
- Household income
- $100,024
- Rent vs Own
- Severe rent burden
- 497.0
Population outlook (Saratoga County) Hauer SSP2
- Today (2025)
- 238,889 people
- By 2030
- 243,681 · +2.0%
- By 2040
- 249,118 · +4.3%
- By 2050
- 248,638 · +4.1%
- By 2075
- 241,675 · +1.2%
- By 2100
- 213,150 · -10.8%
Race, ethnicity, and origin ACS 2023
- Neighborhood character
- Predominantly White (92%)
- Race & ethnicity
- White 92% Hispanic / Latino 3% Two or more races 3% Asian 1%
- Common ancestry
- Lithuanian 11% Romanian 4% Iranian 2%
- Foreign-born
- 3% · Canada
- Languages at home
- 95% English-only · Spanish 2% Russian/Polish/Slavic 1% Other Indo-European 1%
Political lean MEDSL · Saratoga
- 2024 margin
- Toss-up / Even · D 50.9% · R 49.1%
- 2008→2024 swing
- -1.6pp toward R · 2008: 3.4pp · 2024: 1.8pp
- All cycles
- 2024: D+1.8 2020: D+5.4 2016: R+4.4 2012: D+2.1 2008: D+3.4
Not yet ingested
- Civics
- —
Market trends
- HPI YoY
- ▼ -51.79%
- Current HPI
- 351.6972
- Rent YoY
- —
- Metro
- Albany-Schenectady-Troy, NY
- State GDP YoY
- ▲ 2.60%
- F500 in state
- 92
Industry mix (Fortune 500 HQ in NY)
| Industry | F500 HQs | Revenue |
|---|---|---|
| Financial Services | 10 | $950B |
|
||
| Consumer Goods | 9 | $162B |
|
||
| Insurance | 4 | $225B |
|
||
| Telecommunications | 2 | $144B |
|
||
| Pharmaceuticals | 2 | $112B |
|
||
| Media / Entertainment | 2 | $69B |
|
||
Price history
+82.3% since first listed6 events — show timeline
- 2026-06-10 Listed $175,000 Global MLS
- 2013-10-21 Listing Removed — Global MLS
- 2013-08-19 Listed $249,000 Global MLS
- 2005-07-19 Listing Removed — Global MLS
- 2005-01-20 Listed $169,900 Global MLS
- 2003-10-16 Sold (Public Records) $95,981 Public Records
Property tax history
+3.3%/yrLatest (2025): $4,029 · +1.6% YoY. Source: county tax records.
Cash-flow waterfall
monthlySold comps — $/sqft
last 12 mo · ≤1 miLoading sold comps…